
Syntax. FISHER(x)
Definition. This function returns the Fisher transformation for x. This transformation produces a function that is normally distributed with a skewness of about 0. Use this function to test the hypothesis for the correlation coefficient.
Arguments
x (required). The numeric value you want to transform
Note
If x isn’t a numeric value, the FISHER() function returns the #VALUE! error. If x is less than or equal to –1, or greater than or equal to 1, the FISHER() function returns the #NUM! error.
Background. Whereas the regression describes the type and covariance of the correlation between two characteristics, the correlation is the term for their relation.
The following provides an overview of the product-moment correlation (Pearson):
The correlation describes the linear correlation of two variables.
The correlation is the standardized covariance or the covariance.
The correlation doesn’t change with the linear transformation of the values.
The correlation coefficient r has values between –1 and +1 and a two-tailed limit.
The coefficient is calculated for interval-scaled variables.
The coefficient depends on the variance of the two characteristics.
A causal relationship cannot be derived from a correlation.
The Fisher transformation (Fisher z-transformation) was developed by Sir Ronald Aylmer Fisher (1890–1962), one of the most renowned geneticists, evolutionary modelers, and statisticians of the 20th century.
This type of transformation was developed to average correlations. Because the correlation coefficient is not interval-scaled—that is, the distance between r = .20 and r = .40 is not identical with the distance between r = .40 and r = .60—the average between different correlations cannot be calculated.
The solution is the Fisher transformation, which converts correlations into interval-scaled variables.
The average of multiple correlations is calculated as follows:
Convert all correlation coefficients to be averaged into Fisher values.
Average the z-values.
Retransform the averaged z-values into correlation coefficients.
The transformed value can be calculated with the FISHER() function or generated with the following formula:
The z-transformation transforms the correlation coefficient in its value range (–1 to +1) into an approximately normal distribution—that is, the correlation coefficient is asymptotic normal distributed to perform tests based on the normal distribution. This includes significance calculations.
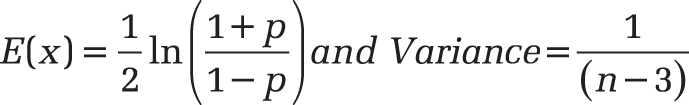
The formula for the expected value and the variance of the z-transformed correlation coefficient is:
Example. A software company sells all of its products through the company website. The company regularly sends out newsletters to inform existing and potential customers about new and updated products and to draw attention to its website. The company was founded in 2005.
The marketing department wants to analyze the website visits as well as the online orders in the last four years to determine the dependency between the orders and the website visits. You have already calculated the correlation coefficient for each year to see the correlation between the two variables (see Figure 12-50).
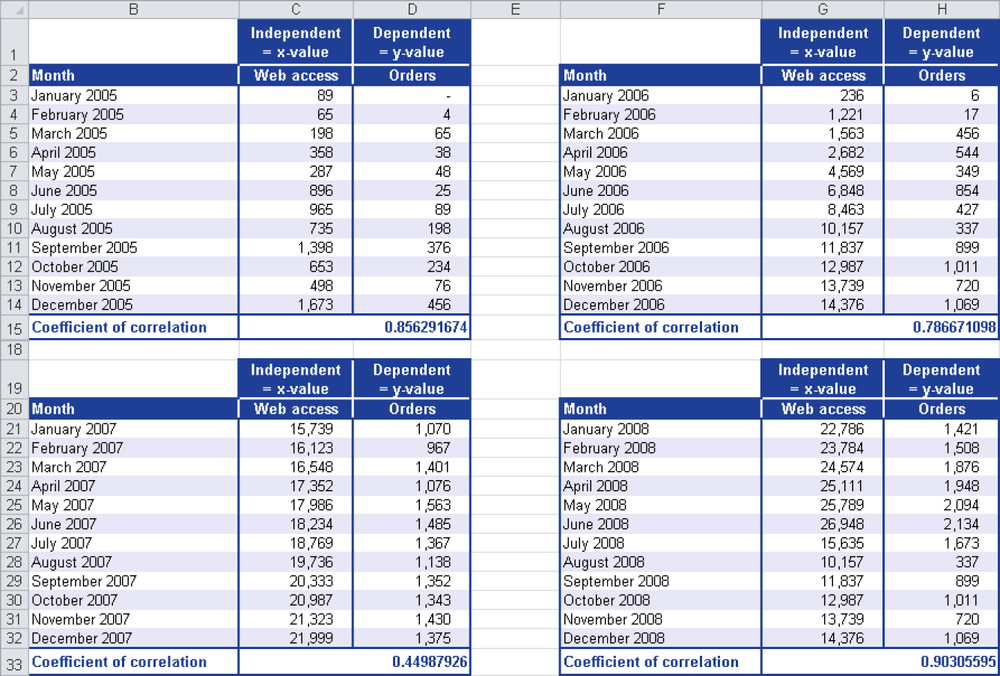
Now you want to calculate the average correlation for the last four years. Because the correlation coefficient is not interval-scaled, you cannot calculate the average from different correlations.
Therefore, you use the FISHER() function to transform all correlation coefficients into Fisher values. You specify the correlation coefficient for the x argument of the FISHER() function.
Figure 12-51 shows the result of the calculation with the FISHER() function.
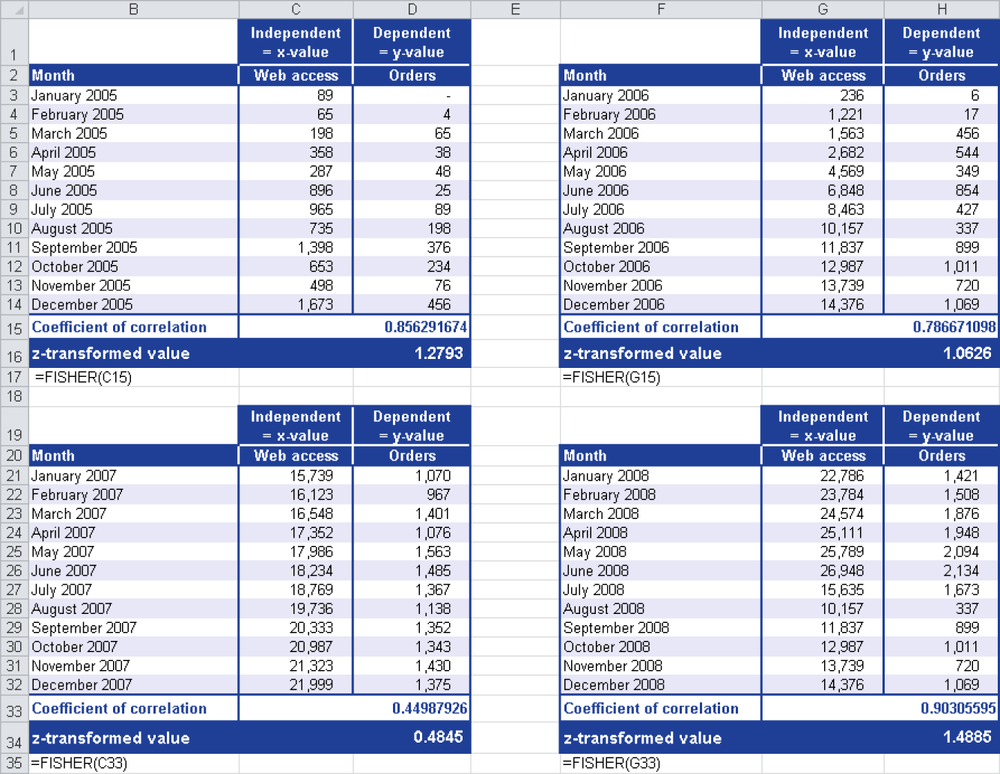
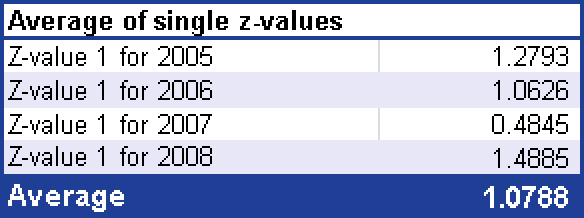
Figure 12-52 shows how you can calculate the average from the z-values returned by FISHER().
To retransform the average calculated from the z-values into a correlation coefficient, use the FISHERINV() function.
You have to retransform the calculated average into a correlation coefficient to get the correlation between the website visits and the online orders in the last four years. As you can see in Figure 12-53, the correlation coefficient calculated from the average is 0.7927.
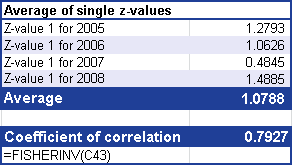
Figure 12-53. Transforming the average (calculated from the z-values) into a correlation coefficient.
The following statements can be made:
The correlation coefficient of 0.7927 indicates a positive correlation. The closer the correlation coefficient is to 1, the closer the correlation. This means that the website visits and online orders are linear interdependent.
If the number of website visits increases because of marketing activities, the number of online orders also increases.
This proves that in the last four years the online orders were dependent on the number of website visits.