
Syntax. GROWTH(known_y’s;known_x’s;new_x’s;const)
Definition. This function returns values from an exponential trend. GROWTH() returns the y-values for a series of new x-values that you specify by using existing x-values and y-values. You can also use the GROWTH() function to calculate an exponential curve for the existing x-values and y-values.
Arguments
known_y’s (required). The y-values you already know from the relationship y = b * mx
If the known_y’s array consists of a single column, then each column in the known_x’s array is interpreted as a separate variable.
If the known_y’s array consists of a single row, then each row in the known_x’s array is interpreted as a separate variable.
known_x’s (optional). The x-values you already know from the relationship y = b * mx
The known_x’s array can include one or more sets of variables. If only one variable is used, known_y’s and known_x’s can be ranges of any shape as long as they have equal dimensions. If more than one variable is used, known_y’s must be a vector (a range consisting of a single row or column).
If known_x’s is not specified, it is assumed to be the array {1,2,3,...} containing the same number of elements as known_y’s.
The known_y’s and known_x’s arguments must have the same number of rows or columns. If the number of rows (columns) is different, you get the
#REF!error. If one of the y-values is 0 or negative, you get the#NUM!error.
new_x’s (optional). The new x-values for which you want to return the corresponding y-values
Like known_x’s, the new_x’s argument must include a column (or row) for each independent variable. The known_x’s and new_x’s arguments must have the same number of columns if known_y’s is in a single column. If known_y’s is in a single row, known_x’s and new_x’s must have the same number of rows.
If new_x’s is not specified, it is assumed to be the same as known_x’s.
If both known_x’s and new_x’s are omitted, they are assumed to be the array {1,2,3,...} that contains the same number of elements as known_y’s.
const (optional). A logical value specifying whether to force the constant b to equal 1
If const is TRUE or omitted, b is calculated normally.
If const is FALSE, b is set equal to 1 and the m-values are adjusted so that y = mx.
Note
Formulas that return arrays must be entered as array formulas after you have selected the correct number of cells. When entering an array constant instead of an argument (such as known_x’s), use commas to separate values in the same row and colons to separate rows.
Background. Whereas the TREND() function calculates the linear trend—future values—from existing values, you can also calculate the exponential trend because not all models follow a linear trend.
An exponential trend exists if a value always changes by the same factor or percentage. The exponential trend fits an exponential curve to existing data. Use the GROWTH() function to calculate an exponential trend model.
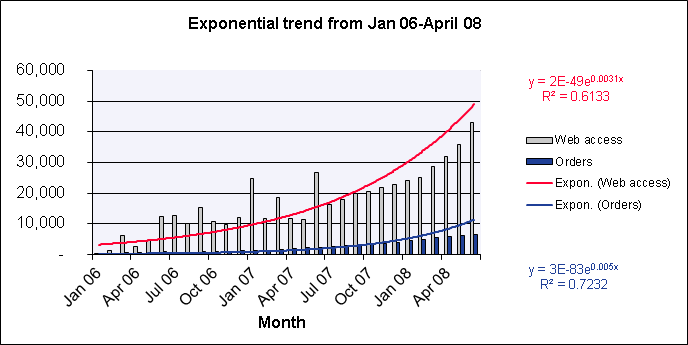
Example. Let’s use the same example as for TREND(). You are the marketing manager of a software company and analyze the website. Recently the website visits as well as the online orders have increased significantly. Figure 12-69 shows the exponential increase in website visits and online orders.
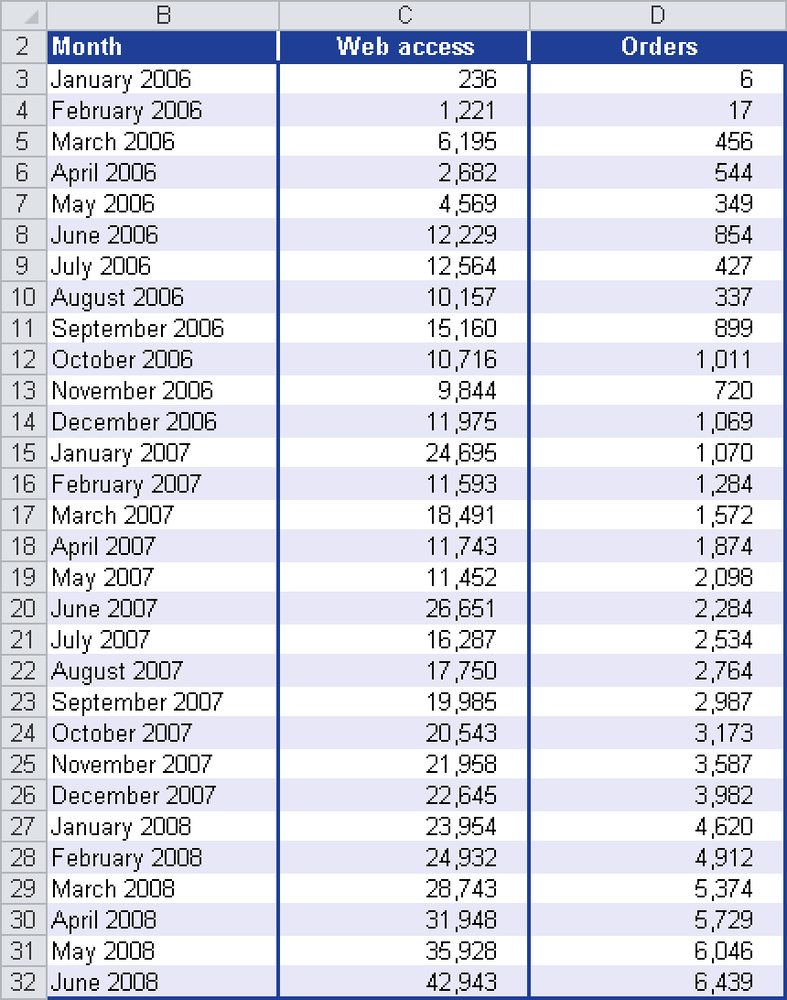
You know the number of website visits and online orders between January 2006 and June 2008. Now you want to create a prognosis for both components. You use the GROWTH() function to calculate the exponential trend. The website visits and orders through June 2008 are shown in Figure 12-70.
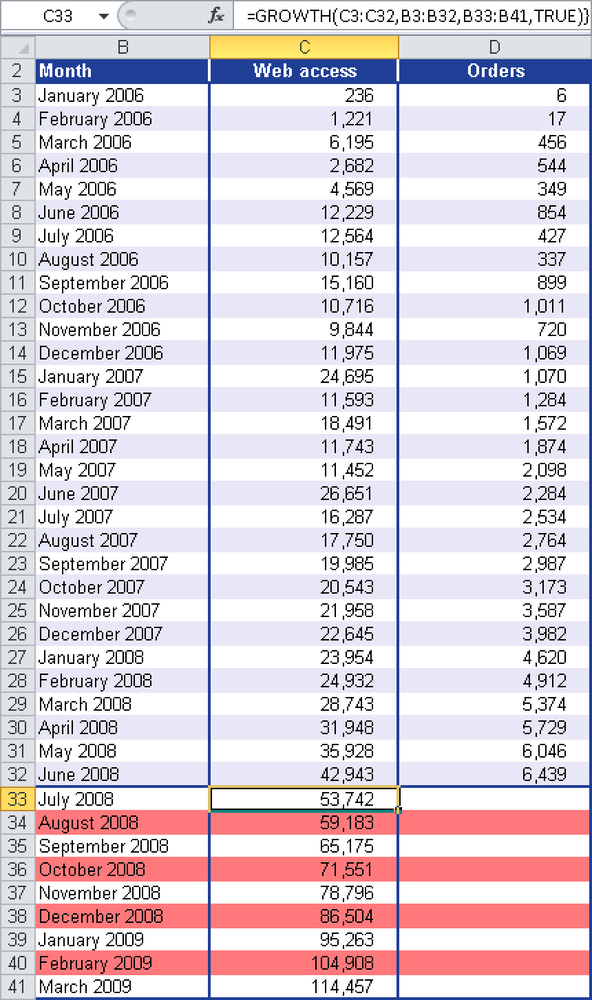
Now you want to know the trend of the website visits and online orders from July 2008 through March 2009. The GROWTH() function provides the following arguments to calculate the website visits in the next nine months:
known_y’s = website visits between January 2006 and June 2008
known_x’s = months (January 2006 to June 2008)
new_x’s = months from July 2008 to March 2009
const = TRUE (the constant b of the equation y = mx + b is calculated normally)
Figure 12-71 shows the result.
Note
Remember, the GROWTH() function is an array function when calculating the values for cell range C33:C41. This means that the function immediately returns the result for all months. Therefore, you have the select cell range C33:C41, enter the formula, and press Ctrl+Shift+Enter. You can recognize array functions by the braces in the formula bar.
Using the same procedure, you calculate the values for the online orders based on the calculated trend values for website visits. Figure 12-72 shows the result and the arguments of the GROWTH() function.
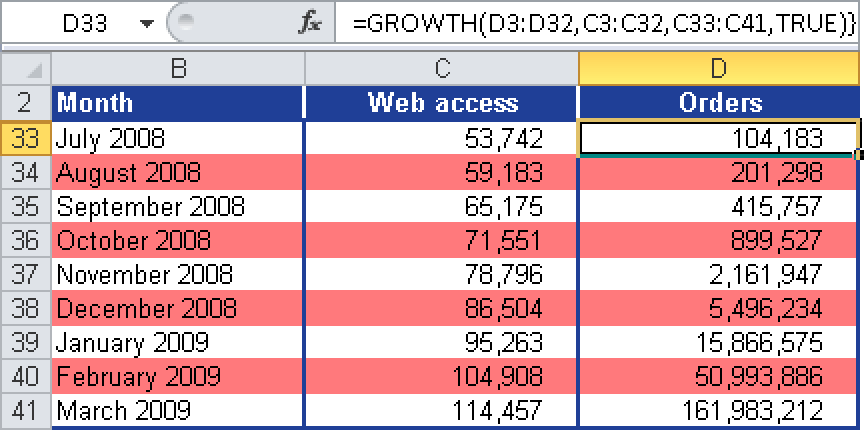
With the GROWTH() function, Excel allows for a good prognosis of the website visits and online orders as long as the previous exponential trend continues.