
Syntax. LOGEST(known_y’s,known_x’s,const,stats)
Definition. This function calculates the exponential curve in regression analyses and returns a value array describing this curve. Because this function returns an array of values, it must be entered as an array formula.
Arguments
known_y’s (required). The y-values you already know from the relationship y = b * mx
If the known_y’s array consists of a single column, then each column in the known_x’s array is interpreted as a separate variable.
If the known_y’s array consists of a single row, then each row in the known_x’s array is interpreted as a separate variable.
known_x’s (optional). The x-values you already know from the relationship y = b * mx
The known_x’s array can include one or more sets of variables. If only one variable is used, known_y’s and known_x’s can be ranges of any shape as long as they have equal dimensions. If more than one variable is used, known_y’s must be a range of cells consisting of a single row or column (which is also known as a vector).
If known_x’s is not specified, it is assumed to be the array {1,2,3,...} containing the same number of elements as known_y’s.
const (optional). A logical value specifying whether to force the constant b to equal 1
If const is TRUE or omitted, b is calculated normally.
If const is FALSE, b is set equal to 1 and the m-values are adjusted so that y = mx.
stats (optional). A logical value specifying whether to return additional regression statistics
Background. Unlike the LINEST() function, the LOGEST() function describes the dependent y-values and the independent x-values by calculating a exponential curve with the following common formula:
y = b × mx
where y and x can be vectors:
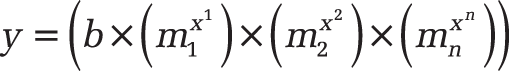
Each basis has an associated exponent x. This means that the references or values must have the same number of elements.
Like the LINEST() function, LOGEST() returns an array that describes the relation between the values. The difference is that the LOGEST() function adjusts the data to an exponential curve whereas LINEST() uses a straight line.
If only one independent x-variable exists, you can calculate the slope m and the y-intercept with the following formulas:
Slope m: =INDEX(LOGEST(known_y’s;known_x’s);1)
y-intercept b: =INDEX(LOGEST(known_y’s;known_x’s);2)
Use the equation y = b*mx to estimate future y-values. To estimate the values, you can also use the GROWTH() function.
If you specify an array constant (such as values_x) as an argument, you have to divide the values in a row with colons, and the rows with commas.
Tip
Note that if you use a regression equation, the predicted y-values may be invalid because they reside outside of the y-value range you used for the equation.
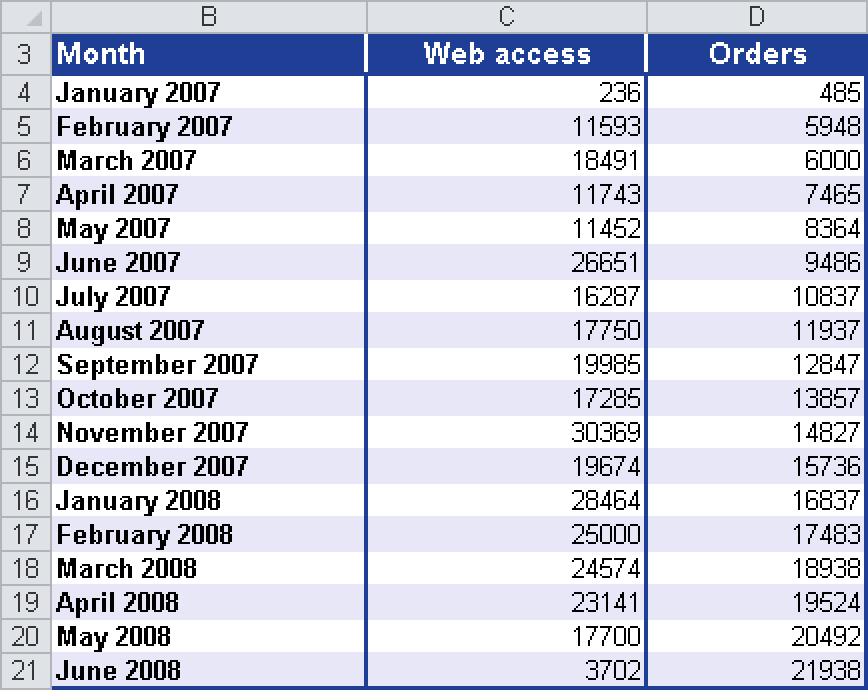
Example. To explain how the regression values are calculated, use the example for the LINEST() function. Last year the orders through the company website significantly increased. The management wants to know the reason. Is the increase in sales attributable to marketing or advertising? Did the increased website visits cause the increase in sales? This means that the company wants to know the correlation between the website visits and the online orders.
The marketing department is asked to perform an analysis and creates an Excel list to compare the website visits and the online orders of the past 18 months. The marketing department performs a regression analysis using the LOGEST() function (see Figure 12-88).
A chart illustrates the orders compared to the website visits, as shown in Figure 12-89.
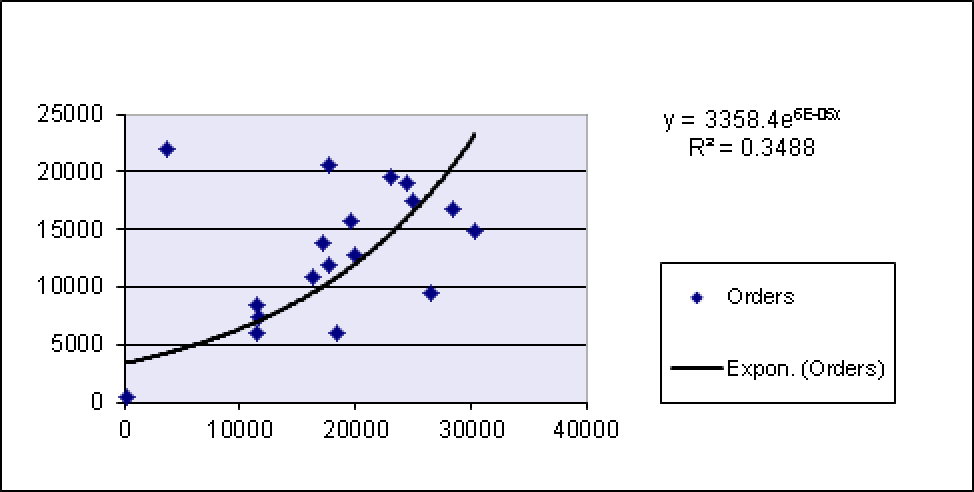
As you can see in Figure 12-89, the online orders show an exponential growth depending on the website visits. Therefore, it can be assumed that the orders increase depending on the website visits.
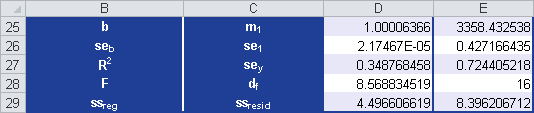
In this case, use the LOGEST() function to calculate the regression values. This function returns the results shown in Figure 12-90.
Caution
Formulas that return an array as a result have to be entered as array formulas. Because LOGEST() can calculate all 10 regression values simultaneously and returns an array, the formula or the arguments have to be entered in a certain way.
Select the cell range D31:E43 and then enter the arguments for LOGEST() in cell D31. After you are finished, press Ctrl+Shift+Enter.