
Note
In Excel 2010, the PERCENTILE() function was replaced with the PERCENTILE.EXC() and the PERCENTILE.INC() functions to increase the accuracy of the results. To ensure the backward compatibility of PERCENTILE.EXC() and PERCENTILE.INC(), the PERCENTILE() function is still available.
Syntax. PERCENTILE(array,alpha)
Definition. This function returns the alpha quantile of a data set. You can use this function to establish a threshold of acceptance. For example, you can decide to invite only the customers with sales above the 80th percentile to a festivity.
In statistics, the p percent quantile for a probability function is the value of the event range with the value p percent of the density function. p percent of the observations or the population are smaller than the p percent quantile.
Arguments
array (required). The array or range of data that defines the relative standing of the data
alpha (required). A value between 0 and 1 inclusive
Note
If array is empty or contains more than 8,191 data points, PERCENTILE() returns the #NUM! error. If alpha isn’t a numeric expression, the PERCENTILE() function returns the #VALUE! error. If alpha is less than 0 or greater than 1, the PERCENTILE() function returns the #NUM! error. If alpha isn’t a multiple of 1/(n – 1), PERCENTILE() interpolates to determine the value at the alpha quantile.
Background. A quantile is a defined part of a data set sorted by size. Quantiles (except the median) are values that define the variance of a data set. Some of the most important quantiles are the decile, the quartile, and the median. The median matches the 50 percent quantile.
In other words, the p quantile of a distribution indicates what value separates the lower p*100 percent of the data values from the upper 100–p*100 percent. If you specify the 0.65 quantile of a distribution, then 65 percent of the data are less than or equal to the data value, and 35 percent of the data are greater than or equal to this value.
Sometimes no value in the data set matches the corresponding value. A rule for quantile calculations is (n = number of data values): If n*p isn’t an integer, the next integer is used as the ordinal number for the quantile value. If n*p is an integer, the quantile is a value between n*p and n*p+1.
When 16 data values exist, the 0.25 quantile (the first quartile) has the ordinal number 4 (16*0.25). The 0.25 quantile or the first quartile should be located between the lower 25 and the upper 75 percent. Therefore, it makes sense to define a value between the fourth and the fifth value of the sorted data set. The first decile can be defined by the ordinal number for n*p = 1.6. In this example, this is the second value in the data set. At least 10 percent of the data is less than or equal to this value, and 90 percent of the data is greater than or equal to this value.
Example. Let’s use the example of the software company again. You are the manager of the controlling department and generate the sales numbers for the different business units for an entire year. Now you want to separate the data to further analyze it. The goal is to generate the sales values that exceed the 0.6 quantile (60th percentile).
With Excel you can calculate any p percent quantile. For the alpha argument, you have to enter the percentage as a decimal number. You calculate the results in 10-percent increments.
As you can see in Figure 12-111, the results are sorted in ascending order. Now you can analyze all sales that are greater than or equal to the 0.6 quantile.
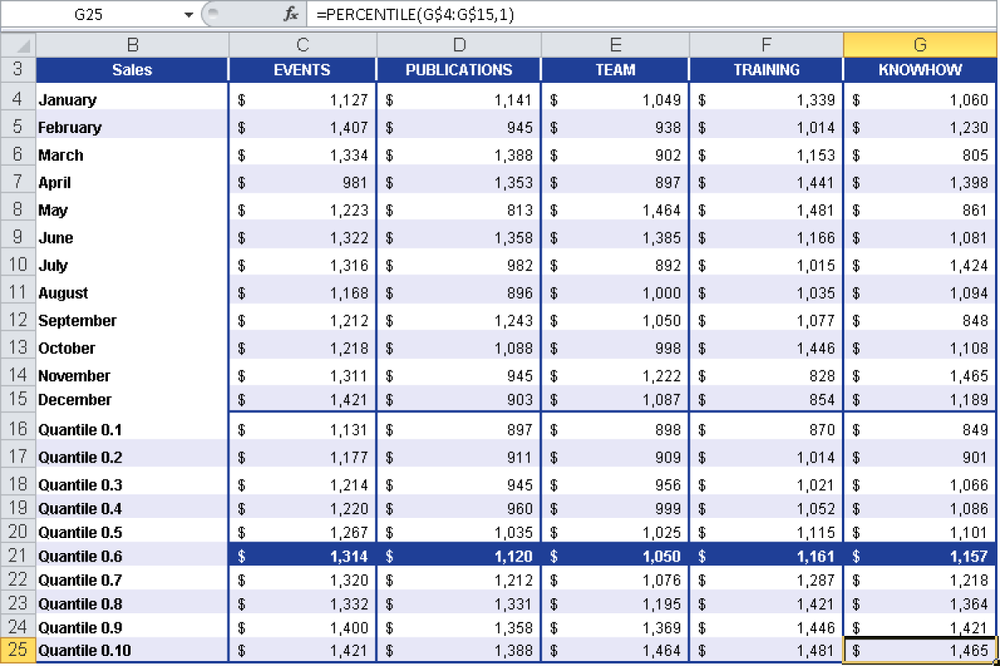
The 0.6 quantile indicates that 60 percent of the values in the original data are less than the value, and 40 percent are greater than or equal to this value.