Note
In Excel 2010, the PERCENTRANK() function was replaced with the PERCENTRANK.EXC() and PERCENTRANK.INC() functions to increase the accuracy of the results. To ensure the backward compatibility of PERCENTRANK.EXC() and PERCENTRANK.INC(), the PERCENTRANK() function is still available.
Syntax. PERCENTRANK(array,x,significance)
Definition. This function returns the rank of a value (alpha) as a percentage.
This function can be used to evaluate the relative position of a value within a data set. For example, you can use PERCENTRANK() to evaluate the position of an aptitude test score among all scores for the test.
Arguments
array (required). The array or range of data with numeric values that defines the relative position of the data.
x (required). The value for which you want to know the rank.
significance (optional). A value that identifies the number of decimal places for the returned percentage value. If significance is not specified, PERCENTRANK() uses three decimal places (0.xxx).
Note
If array is empty, PERCENTRANK() returns the #NUM! error. If significance is less than 1, PERCENTRANK() returns the #NUM! error. If x does not match one of the values in the array, PERCENTRANK() interpolates to return the correct percentage rank.
Background. PERCENTRANK() is the inverse function of PERCENTILE(). This function calculates the relative position a of value x in a value set. You will find more information about quantiles in the description of PERCENTILE().
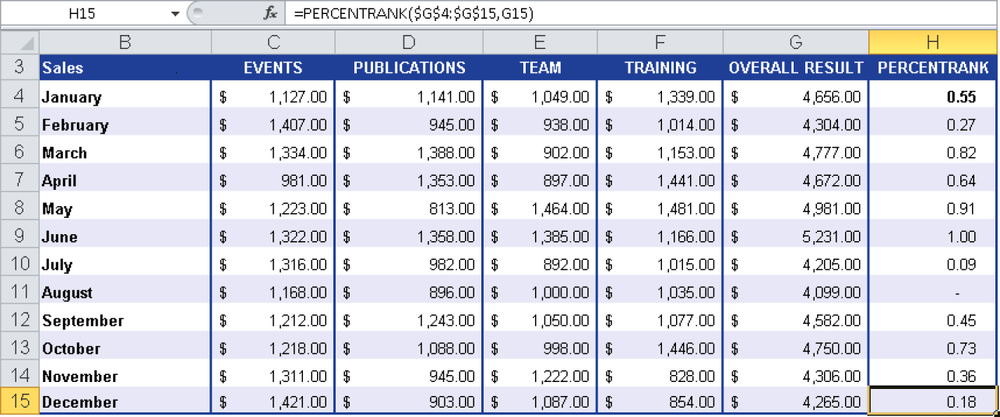
Example. You are the manager of the controlling department and want to analyze the total sales of all business units for the past year. The goal is to find the position of a sale in a given month within all sales on a scale from 1 to 100 to calculate the variance of the monthly sales compared to all sales. Therefore, you use the PERCENTRANK() function.
Based on the sales of $4,656.00 in January and the calculated quantile rank of 0.55, you can draw the following conclusion: The sales of $4,656.00 in January calculated from the total sales is ranked 55 on a scale from 1 to 100. This means that 55 percent of the values are less than or equal to the value, and 45 percent of the values are greater than or equal to $4,656.00 (see Figure 12-112).