

Troubleshooting
There can be instances where problems occur on an IBM Spectrum Accelerate system. Prompt action can help to address these types of issues and prevent interruption of system operations.
This chapter describes various methods that are available to monitor and troubleshoot IBM Spectrum Accelerate systems, including monitoring and collecting diagnostic data and explanations of how to gather information from the system in real time. In addition, IBM Spectrum Accelerate systems self-monitoring, self-healing, and automatic alert features are described.
This chapter includes the following topics:
10.1 Troubleshooting deployment failures
When an error occurs during deployment, an error window is displayed by the IBM XIV Management GUI with an option to display the error log, as shown in Figure 10-1.
Select Show Log to display the deployment log, which can help determine the cause of the error.
Select Show Log to display the deployment log, which can help determine the cause of the error.

Figure 10-1 IBM XIV Management GUI deployment error
The following errors are described in this chapter:
•Common issues with CLI deployment and XML file
•Could not find a suitable xiv_local_storage.vmdk (path not found)
•Creating direct attach disk paths failed
•VM already exists failure
•ESXi server cannot be added to cluster
•Disks not providing SMART status
•Spectrum Accelerate system in Maintenance Mode because of wrong ESXi version
10.1.1 Common issues with CLI deployment and XML file
The following more common issues can cause the deployment to fail:
•Windows deployment: The directory path is too long
Follow the general guidelines for the operating system. For Windows, ensure that the path length does not exceed 255 characters.
•Windows deployment: Spaces in the directory path:
Although Windows allows spaces in file and directory structure, the deployment kit can have problems parsing them during the installation process.
•Order of options that are used in the command. The -c or --config= must always precede the XML file.
•Errors in the .xml file:
– Password field is left blank in the deployment configuration XML file. By default, exported configuration XML files from the IBM XIV Management GUI do not contain passwords.
– Incorrect network settings, such as, subnet masks and port group names.
– Incorrect data store names that do not match the configuration of the ESXi server.
Each command-line deployment generates console output. The amount of information that is present in this output depends on what verbosity was set when the deployment process was started.
Deployment failures often list the reason for the failure in the command-line output. This list can greatly help in troubleshooting the problem and provide guidance about how to correct it.
10.1.2 Could not find a suitable xiv_local_storage.vmdk (path not found)
The deployment kit can have problems with paths that exceed 255 characters. In these cases, the log file contains the error that the deployment failed because of missing files. These log files can look similar to the output that is shown in Example 10-1.
Example 10-1 Path to long error
File "C:UsersIBM_ADMINDocuments�1 - ActivitiesXiVaaS Residencycodexiv_sds_deployment_kit-latestSDS_Deploy_Windeploydeploy_sds.py", line 1106, in main
raise Exception("Could not find a suitable xiv_local_storage.vmdk, or supplied file not found.")
Exception: Could not find a suitable xiv_local_storage.vmdk, or supplied file not found.
The missing xiv_local_storage.vmdk file is used as the IBM Spectrum Accelerate system software that is needed to deploy the virtual machine to the ESXi servers. In the case of this error, the xiv_local_storage.vmdk file is in the correct location, but the deployment kit did not find it because the path exceeded the limit. To work around this issue, extract the deployment .zip file to a folder nearer the root level of the file system. This folder can be a folder directly on the drive, such as C:Deploy_SDS. It is also possible that the path was not found because of spaces in the path name.
10.1.3 Creating direct attach disk paths failed
The hardware components in the ESXi server must be operational. If there is a problem detected during deployment, a “DIRECT ATTACH SCRIPT ERROR” is emitted and the deployment halted, as shown on Example 10-2 on page 356.
Example 10-2 Deployment process unable to create RDM disk devices
2015-09-19 18:44:50: [9.xx.yy9.28] DIRECT ATTACH SCRIPT ERROR :ERROR: 7 data disks were requested, but only 6 available found!
2015-09-19 18:44:50: Error: [9.xx.yy9.28] Creating direct attach disk paths failed - Exiting! error code was 1
Review the ESXi server that is associated with the TCP/IP address in the error message and verify that the correct number of disk devices are available as resources and not allocated to another virtual machine. A disk can also be marked failed by ESXi and need replacement or dropped from the hardware inventory entirely. Figure 10-2 shows an example in which a disk is missing from the hardware inventory, which causes the deployment to fail.

Figure 10-2 One server missing one disk
Physically inspect the server and replace any disk drives that are not operating correctly. If a disk is disconnected from the server, reinsert the disk and allow the disk indicator light to turn on before checking the ESXi server hardware inventory.
10.1.4 VM already exists failure
By default, the deployment process does not automatically remove and redeploy an IBM Spectrum Accelerate system when a virtual machine is detected with the same name. This safeguard prevents accidental deletion of an IBM Spectrum Accelerate system.
If there are cases where the deployment failed because of another issue and the virtual machines were copied but not started, they must be removed before another deployment can be successful. These cases show errors similar to the error that is shown in Example 10-3.
Example 10-3 Deployment failure due to identically named virtual machine present
VM itso_sds1_module_1 already exists - delete it? (deployment script will terminate otherwise)
Running with --batch. Assuming "N" on all queries.
Although there is a command-line argument that instructs the deployment process to remove the virtual machines and continue, there is no equivalent option within the IBM XIV Management GUI.
Removing the identically named virtual machines is done by using the ESXi vSphere client or vCenter web interface after which the deployment can be attempted again. Complete the following steps:
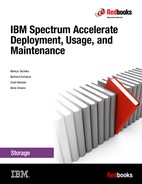
1. If the virtual machine is not powered off, start the Power off process by right-clicking the virtual machine and selecting Power → Power Off, as shown in Figure 10-3.
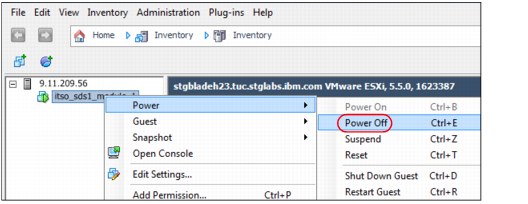
Figure 10-3 Powering off IBM Spectrum Accelerate virtual machine
2. Remove IBM Spectrum Accelerate virtual machine from ESXi server inventory by right-clicking the virtual machine and selecting Delete from Disk, as shown in Figure 10-4.

Figure 10-4 Deleting IBM Spectrum Accelerate virtual machine from VMware disk and inventory
10.1.5 ESXi server cannot be added to cluster
If vCenter is used during deployment, a folder with “name” as specified by parameter name="UNIQUE_NAME_FOR_THE_MACHINE" is created. This folder holds all the ESXi servers that are defined for the Spectrum Accelerate system.
If the ESXi servers (hosts) are added to a data center object by using vCenter (see Figure 10-5), the deployment might fail with an error, as shown in Example 10-4.

Figure 10-5 ESXi servers pre-defined in vCenter before deployment
Example 10-4 Deployment Error: Adding ESXi server to a cluster
2015-10-14T09:58:15+2:00 [25565]: SDS ESXi Nodes Verifications Completed Successfully
2015-10-14T09:58:15+2:00 [25565]: Trying to create folder mz_sds2
2015-10-14T09:58:17+2:00 [25565]: Located ESXi server at PURPLE_PFE2/host/9.155.51.40
2015-10-14T09:58:17+2:00 [25565]: Error: ESXi server 9.155.51.40 cannot be added to cluster mz_sds2 since it's already a member of a different cluster
2015-10-14T09:58:17+2:00 [25565]:
2015-10-14T09:58:17+2:00 [25565]: The Spectrum Accelerate deployment has failed.
2015-10-14T09:58:17+2:00 [25565]: Deploy finished with an error.
The resulting inventory structure in vCenter after the failing deployment is shown in Figure 10-6. The four Spectrum Accelerate servers (hosts) are at the same logical level as the mz_sds2 folder, which is incorrect. Instead, the servers should be at the next lower level, as are the servers from Spectrum Accelerate system mz_sds1.

Figure 10-6 Comparison between good (mz_sds1) and bad (mz_sds2) inventory structure
A workaround to fix this deployment failure is to remove the ESXi servers from the vCenter inventory tree by using the Remove (Host) function of the Edit command or menu and then attempting the deployment again. Upon successful redeployment, the hosts are on the correct level in the vCenter tree, as shown in Figure 10-7.
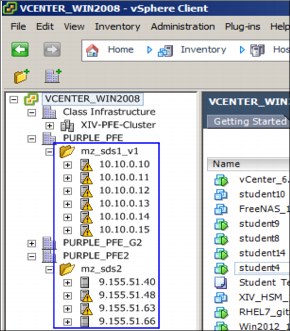
Figure 10-7 Hosts are correctly placed in mz_sds2 folder after redeployment
10.1.6 Disks not providing SMART status
Self-Monitoring, Analysis, and Reporting Technology (SMART) is a monitoring system that is included in hard disk drives (HDDs) and solid-state drives (SSDs) that detects and reports on various indicators of disk drive reliability parameters with the intent of predicting a drive failure because of mechanical or electronic components wear.
Spectrum Accelerate system code relies on SMART data to verify a disk’s health and precautionary fail the disk, if necessary.
Although all of today’s HDDs support SMART technology, there are disk controllers that default to preventing SMART data from passing it to the next software layer and hiding this information from Spectrum Accelerate system code. Therefore, such HDD controllers are often not suitable for usage within a Spectrum Accelerate system. In such cases, the controller’s technical documentation must be searched for possible ways to overcome this hurdle.
An example for a deployment failure because of inaccessible SMART data is shown in Example 10-5.
Example 10-5 Deployment failure because of inaccessible SMART data
2015-10-25 13:11:45,157 ERROR 2015-10-25 13:11:45: Error: module-2(10.10.0.2): 10-25 11:40:30 Disk_Bandwidth [ERROR ] 8 Disks of 8 didn't provide SMART status
2015-10-25 13:11:45,157 ERROR 2015-10-25 13:11:45: Error: module-3(10.10.0.3): 10-25 11:40:31 Disk_Bandwidth [ERROR ] 8 Disks of 8 didn't provide SMART status
2015-10-25 13:11:45,157 ERROR 2015-10-25 13:11:45: Error: module-1(10.10.0.1): 10-25 11:40:01 Disk_Bandwidth [ERROR ] 8 Disks of 8 didn't provide SMART status
To check whether SMART data can be read from the disks, connect to one of the ESXi servers in root mode and list the available disks by running the esxcfg-mpath -b command, as shown in Example 10-6.
Example 10-6 esxcfg-mpath -b command
The ESXi Shell can be disabled by an administrative user. See the
vSphere Security documentation for more information.
~ # esxcfg-mpath -b
naa.5000c50083341677 : Local IBM-ESXS Disk (naa.5000c50083341677)
vmhba0:C0:T7:L0 LUN:0 state:active Local HBA vmhba0 channel 0 target 7
naa.500a07510c1f7918 : Local ATA Disk (naa.500a07510c1f7918)
vmhba0:C0:T10:L0 LUN:0 state:active Local HBA vmhba0 channel 0 target 10
naa.5000c50083344b7b : Local IBM-ESXS Disk (naa.5000c50083344b7b)
vmhba0:C0:T4:L0 LUN:0 state:active Local HBA vmhba0 channel 0 target 4
mpx.vmhba32:C0:T0:L0 : Local IBM SATA CD-ROM (mpx.vmhba32:C0:T0:L0)
vmhba32:C0:T0:L0 LUN:0 state:active Local HBA vmhba32 channel 0 target 0
naa.5000c5008334355f : Local IBM-ESXS Disk (naa.5000c5008334355f)
vmhba0:C0:T8:L0 LUN:0 state:active Local HBA vmhba0 channel 0 target 8
....
Thereafter, pick one of the data disks that is used for Spectrum Accelerate and run the command to retrieve the SMART data, as shown in Example 10-7. In this example, some meaningful SMART data was returned.
Example 10-7 Retrieving SMART data from a disk
~ # esxcli storage core device smart get -d=naa.5000c50083341677
Parameter Value Threshold Worst
---------------------------- ---------- --------- -----
Health Status N/A N/A N/A
Media Wearout Indicator N/A N/A N/A
Write Error Count 0 N/A N/A
Read Error Count 1896371872 N/A N/A
Power-on Hours N/A N/A N/A
Power Cycle Count N/A N/A N/A
Reallocated Sector Count N/A N/A N/A
Raw Read Error Rate N/A N/A N/A
Drive Temperature 36 N/A N/A
Driver Rated Max Temperature N/A N/A N/A
Write Sectors TOT Count N/A N/A N/A
Read Sectors TOT Count N/A N/A N/A
Initial Bad Block Count N/A N/A N/A
~ #
Example 10-8 shows a case in which no SMART data is returned from a disk.
Example 10-8 Disk controller not returning any SMART data
~ # esxcli storage core device smart get -d=eui.be1d5189313840bc00247107dc75a0fa
Parameter Value Threshold Worst
---------------------------- ---------- --------- -----
Health Status N/A N/A N/A
Media Wearout Indicator N/A N/A N/A
Write Error Count N/A N/A N/A
Read Error Count N/A N/A N/A
Power-on Hours N/A N/A N/A
Power Cycle Count N/A N/A N/A
Reallocated Sector Count N/A N/A N/A
Raw Read Error Rate N/A N/A N/A
Drive Temperature N/A N/A N/A
Driver Rated Max Temperature N/A N/A N/A
Write Sectors TOT Count N/A N/A N/A
Read Sectors TOT Count N/A N/A N/A
Initial Bad Block Count N/A N/A N/A
In the case in which a disk controller does not provide SMART data to the next software layer and there is no way to enable it, the only workaround to get a system deployed is to set enable_diagnostic_mode="no" in the XML file in the GUI. However, follow-on issues can occur when failed disks or SSDs are tested; therefore, IBM support should be contacted to modify certain variables in the Spectrum Accelerate software.
10.1.7 System in Maintenance Mode because of incorrect ESXi version
Deployment was achieved successfully by using enable_diagnostic_mode="NO". However, Spectrum Accelerate system came up in Maintenance Mode, as shown in Figure 10-8. In that mode, the system is safe guarded and does not accept any command until the reason for the Maintenance mode is determined and resolved.

Figure 10-8 Spectrum Accelerate system in Maintenance Mode after deployment
There can be several reasons for a system entering Maintenance Mode. In this example, it happened because an incorrect version was used for the underlying ESXi server. Although the ESXi version was not listed in the deployment log, it can be seen in Example 10-9 that OpenSSH_6.6.1 client was used. However, this SSH version points to ESXi version 6, which is not supported by Spectrum Accelerate.
Example 10-9 deploy_sds_log showing OpenSSH_6.6.1 client
2015-09-10 13:59:27,835 INFO Connected (version 2.0, client OpenSSH_6.6.1)
|
Important: Setting enable_diagnostic_mode to "No" should be used only for testing purposes, never for deploying a production system.
|
To fix this issue, install ESXi version 5.5 Update 2 or higher on the servers that are used for Spectrum Accelerate and then deploy Spectrum Accelerate again.
10.2 Collecting system logs from an IBM Spectrum Accelerate system
IBM Spectrum Accelerate system support logs can help diagnose problems that can arise. There are several processes in place that allow many events to be cataloged and stored for reference, which greatly helps in problem determination. These logs must be retrieved from the IBM Spectrum Accelerate system and uploaded for analysis by IBM Technical support personnel. The log collection and upload process can be accomplished by using the IBM XIV Management GUI or IBM XIV Management XCLI utilities.
The following prerequisites must be met to successfully collect and send IBM Spectrum Accelerate system logs:
•A user is assigned to the Operation Administrator or Storage Administrator user categories on the IBM Spectrum Accelerate system.
•Access is available to the IBM Spectrum Accelerate system by using the IBM XIV Management GUI or IBM XIV Management XCLI utilities.
10.2.1 Generating and collecting system support logs by using the IBM XIV Management GUI
Complete the following steps to collect support logs from an IBM Spectrum Accelerate system by using the IBM XIV Management GUI:
1. Connect to the IBM Spectrum Accelerate system and open the Collect and Send Support Logs tool. Complete the following steps:
a. Connect to the IBM Spectrum Accelerate system by using the IBM XIV Management GUI with a user who is a member of the Operations Administrator or Storage Administrator user category.
b. Browse to the IBM Spectrum Accelerate system where the logs are collected.

Figure 10-9 IBM XIV Management GUI collect support logs tool
2. Begin collecting the IBM Spectrum Accelerate system support logs by using the Collect and Send Support Logs tool. Complete the following steps:
a. Select Start to begin the system support log collection process, as shown in Figure 10-10 on page 364.

Figure 10-10 Collect and Send Support Logs tool initial options window
b. If log collection is not needed or the extra load collecting logs is not acceptable, click Close to return to the System view.
3. Enter a problem management record (PMR) number in the Collect and Send Support Logs tool. Complete the following steps:
a. In the Set PMR Prefix window, enter a PMR number that is associated with the support case with which the logs are associated.
|
Note: If a PMR number is unavailable, contact IBM Technical support to open a support case. When the case is opened, a PMR number is provided.
|

Figure 10-11 Problem Management Record number assignment for the collected system logs
|
Note: The system log collection process is divided into two phases: collecting the system support logs on the IBM Spectrum Accelerate system and uploading to IBM support personnel.
This process can take time. Selecting Hide moves this window to the background in case the IBM XIV Management GUI must be used for other functions during the collection and uploading of the logs.
|
c. Allow the log collection and upload to complete, as shown in Figure 10-12.
Figure 10-12 Collect and Send support logs tool retrieving the system logs
4. Complete the following steps to close the tool if the logs were successfully retrieved and uploaded:
a. Verify that the collection and upload of the system logs completed successfully, as shown in Figure 10-13.

Figure 10-13 Completed collection and upload to IBM support systems
b. If the collection and upload was successful, select Close to exit the log collection process.
|
Note: If the support logs were successfully collected and transmitted to IBM Technical support, no further action is needed to collect the logs.
|
c. If the upload to IBM support servers was unsuccessful, select Advanced to manually retrieve the logs to the workstation that is running the IBM XIV Management GUI.
5. Complete the following steps to manually download the system support logs to the workstation by running the IBM XIV Management GUI:
a. If the IBM Spectrum Accelerate system support logs were successfully retrieved but there was no network connectivity to the IBM Proactive Support servers, access the system log download utility inside the Advanced view of the tool.
The main panel within the Advanced view displays system logs that were collected.
b. Highlight the most recent system log file and select Get, as shown in Figure 10-14. The IBM XIV Management GUI downloads the system support logs to the local workstation.

Figure 10-14 Advanced log collection window showing collected logs
6. Manually upload the system support log files to the location per the instructions from IBM Technical support personnel.
10.2.2 Generating system support logs with IBM XIV Management XCLI utility
To generate system support logs for an IBM Spectrum Accelerate system by using the IBM XIV Management XCLI utility, complete the following steps:
1. Connect to the IBM Spectrum Accelerate system by using the IBM XIV Management XCLI utility with a user who is a member of the Operations Administrator or Storage Administrator user categories.
2. Run the system_logs_collect command to start collecting the system support logs on the IBM Spectrum Accelerate system.
|
Note: Collection status can be found by running the system_logs_get_status command and checking the progress_0 value. An example of this command is shown in Example 10-10. This example indicates that the system log collection is 20% completed.
|
Example 10-10 System log collection and status
XIV itso_sds1>>system_logs_collect
Command executed successfully.
XIV itso_sds1>>system_logs_get_status
Name Value
--------------- --------------------------------------------------------------------------------------------------------------------------------
end_time_0 n/a
end_time_1 2015-10-21-07:36:55
end_time_2 n/a
end_time_3 n/a
end_time_4 n/a
file_0 n/a
file_1 system_xray_28109999007477_2015-10-21-0733.tar.bz2
file_2 n/a
file_3 n/a
file_4 n/a
message_0 system logs collection started at [2015-10-21-09:59:22]
message_1 system logs collection completed, ended at [2015-10-21-07:36:55], file is [system_xray_28109999007477_2015-10-21-0733.tar.bz2]
message_2 idle
message_3 idle
message_4 idle
module_name_0 1:Module:1
module_name_1 1:Module:1
module_name_2 1:Module:1
module_name_3 1:Module:1
module_name_4 1:Module:1
progress_0 20
progress_1 100
progress_2 0
progress_3 0
progress_4 0
start_time_0 2015-10-21-09:59:22
start_time_1 n/a
start_time_2 n/a
start_time_3 n/a
start_time_4 n/a
status_0 executing
status_1 idle
status_2 idle
status_3 idle
status_4 idle
3. Complete the following steps to verify that the system support log collection process completed and that the logs were retrieved from the system by using the IBM XIV Management System GUI:
a. Connect to the IBM Spectrum Accelerate system by using the IBM XIV Management GUI with a user that is a member of the Operations Administrator or Storage Administrator user category.
b. Select the Tools option and select Collect Support Logs to open the Collect and Send Support Logs tool.
|
Note: This tool is the same tool that is used in the IBM XIV Management GUI to start collecting IBM Spectrum Accelerate system support logs.
|
c. Select Advanced to show existing support logs that were created. Proceed with download of the support logs as described in step 5 on page 366.
10.3 Collecting VMware support logs
Because IBM Spectrum Accelerate depends on the VMware server infrastructure, problem determination can be expedited by collecting the VMware ESXi server logs from each VMware ESXi server that is running an IBM Spectrum Accelerate virtual machine. The log collection process is completed by using the VMware vSphere Client or VMware vSphere Web Client if a VMware vCenter is being used.
If a VMware vCenter is used, system logs can be collected for each server within the same VMware vSphere client or VMware vSphere Web client session. If a VMware vCenter is not used, each ESXi server must be connected to independently with the VMware vSphere client and support logs collected for each.
To successfully collect and transmit VMware ESXi support logs, Administrative access to the VMware ESXi servers that are running the IBM Spectrum Accelerate virtual machines is needed.
10.3.1 Collecting VMware ESXi server support logs
Complete the following steps to collect the VMware ESXi server support logs:
1. Open the VMware vSphere Client Export System Logs wizard. Complete the following steps:
a. Connect to the VMware ESXi server as an administrative user.
b. Select File → Export → Export System Logs to open the Export System Logs wizard, as shown in Figure 10-15 on page 369.

Figure 10-15 Selecting Export System Logs option
2. Select logs that were requested by IBM Technical support. The Export System Logs window includes commonly requested logs selected by default, as shown in Figure 10-16. Complete the following steps:
|
Note: Performance data can be gathered by selecting Gather performance data if requested by IBM Technical support.
|
a. If IBM Technical support requests any other system logs, select them in the System Logs panel.
b. Select Next to collect the VMware ESXi support logs.

Figure 10-16 VMware System Logs selection window
3. Select a download location on the workstation. Complete the following steps:
a. Specify a download location workstation where logs are placed by selecting Browse and browsing to a local folder on the workstation, as shown in Figure 10-17.

Figure 10-17 Example of a directory for logs to be stored when collected
b. When a suitable location is chosen, select Next to proceed to the support log collection summary.
4. Review the VMware ESXi support log collection summary and start collecting the logs. Complete the following steps:
a. Verify that the correct logs are being collected as instructed by IBM Technical support.
b. Select Finish to begin the collection process for the VMware ESXi support logs, as shown in Figure 10-18 on page 371.

Figure 10-18 VMware system log collection summary window
5. Download the VMware ESXi support logs to the local workstation and upload to IBM Technical support. Complete the following steps:
a. Allow the VMware ESXi system log collection process to complete.
|
Note: This process can take some time, depending on the amount of information that must be collected. If performance data was included, this process can take much longer than normal system log collection.
|
b. When the VMware ESXi support log bundle is collected and downloaded, select Close, as shown in Figure 10-19.

Figure 10-19 VMware System Logs collection progress indicator
c. Upload VMware ESXi support logs to the location per the instructions from IBM Technical support.
10.4 Collecting network switch and router logs
IBM Spectrum Accelerate systems rely on data center network infrastructure for internal connectivity and host access. Therefore, problems in the network can affect an IBM Spectrum Accelerate system. If a problem occurs, network switch and router logs might be necessary for problem determination when requested by IBM Technical support.
The collection method that is used for these logs varies by manufacturer and the type of switch and routers that are used. Common manufacturers switches and router log collection methods are listed in Table 10-1.
Table 10-1 Examples of common network device log collection methods
|
Manufacturer
|
Log collection method
|
|
Cisco
|
show tech-support command
|
|
HP
|
show interfaces counters command
|
|
Dell
|
Utilization menu within web interface
|
|
Note: For devices that are not included in Table 10-1, contact the device manufacturer or consult the device documentation to learn about the specific log collection processes for those devices.
|
10.5 Proactive and remote support
Proactive support allows an IBM Spectrum Accelerate system to send event notifications to the IBM XIV Remote Support Center. This capability enables events to be proactively analyzed by IBM to help identify problems quickly.
Enabling proactive support can be completed during or after the deployment of an IBM Spectrum Accelerate system. Proactive support relies upon SMTP relay gateways to send events to IBM and needs an SMTP server configured for this purpose.
Remote support allows IBM support personnel to remotely connect to an IBM Spectrum Accelerate system and perform support actions. Enabling remote support greatly improves problem determination and time to problem resolution. Remote support can be selectively enabled and disabled as needed by a user account that is a member of the IBM Spectrum Accelerate Operations Administrator or Storage Administrator user category.
The following prerequisites must be met to successfully configure Proactive and Remote Support features:
•A user account is available on the IBM Spectrum Accelerate system who is a member of the Operations Administrator or Storage Administrator user category.
•An SMTP gateway is configured as an SMTP relay server for the IBM Spectrum Accelerate system.
•Outbound port 22 TCP/IP connections are available from the IBM Spectrum Accelerate to the IBM XIV Remote Support Center.
10.5.1 Configuring IBM Spectrum Accelerate proactive support by using the IBM XIV Management GUI
Complete the following steps to configure proactive support:
1. Connect to the IBM Spectrum Accelerate system by using the IBM XIV Management GUI and access the Support menu. Complete the following steps:
a. Connect to an IBM Spectrum Accelerate system with a user account that is a member of the Operations Administrator or Storage Administrator user category.
b. Select the IBM Spectrum Accelerate system where Proactive support is being configured to enter the System view.

Figure 10-20 Proactive support and support options are available
d. If the Proactive Support option is not on the menu bar, the proactive support settings can be configured by selecting the Systems → System Settings → Support.
2. Configure the primary contact Customer Information tab. Complete the following steps:
a. Select the Customer Information tab and enter the contact information for the primary customer contact or local support team, as shown in Figure 10-21.

Figure 10-21 Configuration for the primary customer contact information
|
Tip: Configuring the contact information for a person or team that has administrative access to the system is best so that IBM Technical support can quickly work with the correct contact if problems are detected.
|
There is no requirement that each field in the Customer Information configuration tab is completed. The following fields are available:
• Name: Primary contact person or group name
• Site Name: Name of the physical location of the IBM Spectrum Accelerate system
• Telephone Number: Contact number for the primary contact person or group
• Street Address: Street address of the IBM Spectrum Accelerate system
• Building Location: Physical building of the IBM Spectrum Accelerate system
• City: City location of the IBM Spectrum Accelerate system
• State: State in which the IBM Spectrum Accelerate system is physically located
• Postal Code: Postal code for the physical location where the IBM Spectrum Accelerate system
• Country: Country in which the IBM Spectrum Accelerate system is physically located
3. Enter the configuration information for the Proactive Support Tab. Complete the following steps:
a. Select the Proactive Support tab and enter the SMTP configuration and primary contact or contact group information, as shown in Figure 10-22 on page 375.
|
Tip: Configuring the contact information for a person or team that has administrative access to the system is best so that IBM Technical support can quickly work with the correct contact if problems are detected.
|
There is no requirement that each field in the Proactive Support tab contain is completed. The following fields are available:
• Proactive Support Enabled: Enables or disables Proactive Support.
• Proactive Support SMTP Gateway: The SMTP server gateway TCP/IP address or host name. The SMTP server must be configured to act as an SMTP relay for events being that are sent by the IBM Spectrum Accelerate system.
• Name: The primary contact person or group name who is responsible for the IBM Spectrum Accelerate system.
• Email: The primary contact person or group email who is responsible for the IBM Spectrum Accelerate system.
• Office Phone: The primary contact person or group office phone number who is responsible for the IBM Spectrum Accelerate system.
• Mobile Phone: The mobile phone number for the contact or group that is responsible for the IBM Spectrum Accelerate system.
• Calling Hours: The calling hours that are used to contact the primary customer.
• Time Zone: The time zone for the primary contact so that they are not disturbed outside of their calling hours.

Figure 10-22 Example of proactive support settings
4. Select Update at the bottom of the Support window to apply the Proactive Support configuration settings.
|
Note: The IBM Spectrum Accelerate system sends a test event to IBM. The email address of the primary contact that was defined in the Proactive Support tab is copied on this email.
If the Proactive Support confirmation email is not received, verify that the IBM Spectrum Accelerate system has network access to the SMTP gateway and that the SMTP server is configured as a relay for the IBM Spectrum Accelerate system.
|
10.5.2 Configuring remote support by using the IBM XIV Management GUI
Complete the following steps to configure Remote Support by using the IBM XIV Management GUI:
1. Connect to the IBM Spectrum Accelerate system by using the IBM XIV Management GUI and access the Support menu. Complete the following steps:
a. Connect to an IBM Spectrum Accelerate system with a user account that is a member of the Operations Administrator or Storage Administrator user category.
b. Select the IBM Spectrum Accelerate system where Remote Support is being configured to enter the System view.
c. Select Systems → System Settings → Support to open the Support configuration window, as shown in Figure 10-23.

Figure 10-23 IBM Spectrum Accelerate support menu
2. Complete the following steps to enter the configuration information in the Remote Support tab:
a. Select the Remote Support tab and enter the IBM Remote Support TCP/IP address and other information, as shown in Figure 10-24.

Figure 10-24 Remote support tab configuration example
|
Important: The following Primary and Secondary IBM Remote Support TCP/IP addresses must be used:
•Primary IBM Remote Support IP Address: 195.110.41.141
•Secondary IBM Remote Support IP Address: 195.110.41.142
|
• Primary IBM IP: The primary IBM Remote Support TCP/IP address that the IBM Spectrum Accelerate system uses to connect to the XIV Remote Support Center.
• Secondary IBM IP: The secondary IBM Remote Support TCP/IP address that the IBM Spectrum Accelerate system uses to connect to the XIV Remote Support Center.
• Modem Phone Number: This number is not used by IBM Spectrum Accelerate systems.
• Special Instructions: Any special instructions, including site-specific instructions, which IBM Technical support must know before starting a Remote Support session with the IBM Spectrum Accelerate system.
b. Select the Remote Support Contact tab and enter the following contact information for the primary customer contact person or group for remote support, as shown in Figure 10-25:
• Name: Primary contact person or group name who is responsible for the IBM Spectrum Accelerate system.
• Email: Primary contact person or group email who is responsible for the IBM Spectrum Accelerate system.
• Office Phone: Primary contact person or group office phone number who is responsible for the IBM Spectrum Accelerate system.
• Calling Hours: The calling hours that are used to contact the primary customer contact.
• Time Zone: The time zone for the primary contact so that they are not disturbed outside of their calling hours.

Figure 10-25 Remote support contact information
3. After all of the necessary fields are complete, select Update to apply the Remote Support configuration.
For more information about remote support, see IBM XIV Storage System Architecture and Implementation, SG24-7659.
10.5.3 Configuring remote support by using the IBM XIV Management XCLI utility
Complete the following steps to configure Remote Support by using the IBM XIV Management XCLI utility:
1. Define IBM support centers so that the IBM Spectrum Accelerate system can start a remote support session with IBM support. Complete the following steps:
a. Connect to the IBM Spectrum Accelerate system by using the IBM XIV Management XCLI utility with a user that is a member of the Operations Administrator or Storage Administrator user category.
b. Find support centers that are defined by running the support_center_list command, as shown in Example 10-11.
Example 10-11 Support centers list
XIV ISA_SDS1>>support_center_list
No support centers defined
XIV ISA_SDS1>>
c. Add the two IBM support centers to the IBM Spectrum Accelerate system by running the support_center_define command, as shown in Example 10-12 on page 379. The command requires that the support_center, address, port, and priority arguments be provided.
|
Important: The following Primary and Secondary IBM Remote Support TCP/IP addresses must be used:
•Primary IBM Remote Support IP Address: 195.110.41.141
•Secondary IBM Remote Support IP Address: 195.110.41.142
Note: The support_center_define command requires the following arguments be used:
•support_center=
Defines a local name the IBM Spectrum Accelerate system that is used when displaying the support centers.
•address=
Defines the TCP/IP address of the IBM XIV Remote Support Center server that is being connected.
•port=
Defines the TCP/IP outgoing port that is used to connect to the IBM XIV Remote Support Center.
•priority=
Defines a priority level for the support_center. Higher priority support_center definitions are used before lower priority centers.
Tip: Ensure that the TCP/IP addresses are entered correctly to prevent connectivity issues when attempting to enable a remote support session.
|
Example 10-12 Define support centers
XIV ISA_SDS1>> support_center_define support_center=front2 address=195.110.41.141 port=22 priority=10
Command executed successfully.
XIV ISA_SDS1>>support_center_define support_center=front1 address=195.110.41.142 port=22 priority=10
Command executed successfully.
XIV ISA_SDS1>>support_center_list
Name Address Port Priority
front2 195.110.41.141 22 10
front1 195.110.41.142 22 10
2. Enable remote support to verify connectivity with IBM XIV Remote Support Center servers. Complete the following steps:
a. Run the support_center_connect command to start a remote support session, as shown in Example 10-13.
Example 10-13 Connect to support center
XIV ISA_SDS1>>support_center_connect
Command executed successfully.
XIV ISA_SDS1>>support_center_status
State Connected sessions Timeout (min) Module Connected since
idle 0 no timeout 1:Module:1 2015-03-1219:55:22
b. Verify that the connection is active by running the support_center_status command to find connectivity status.
|
Tip: The remote support session can be set to always remain active so that IBM Technical support can more quickly address issues.
This option can be set by running the support_center_connect command with the always_on=yes argument, as shown in Example 10-14.
When the IBM Spectrum Accelerate system is connected to the IBM XIV Remote Support Center in this manner, it automatically reconnects in case the connection is interrupted.
|
Example 10-14 Set remote support center session
XIV ISA_SDS1>>support_center_connect always_on=yes
Command executed successfully.
XIV ISA_SDS1>>support_center_status
State Connected sessions Timeout (min) Module Connected since
idle 0 no timeout 1:Module:1 2015-03-1220:00:15
3. Close the remote support session when it is no longer wanted by running the support_center_disconnect command, as shown in Example 10-15.
Example 10-15 Close remote support center connection
XIV ISA_SDS1>>support_center_disconnect
Command executed successfully.
XIV ISA_SDS1>>support_center_status
State Connected sessions Timeout (min) Module Connected since
no connection 0 no timeout
For more information about remote support, see IBM XIV Storage System Architecture and Implementation, SG24-7659.
10.6 Emergency shutdown by power monitoring system
IBM Spectrum Accelerate systems rely on the memory that is allocated to it by the VMware ESXi server for caching read and write data. Because of the volatile nature of this memory, the servers that are running the IBM Spectrum Accelerate virtual machines must not lose electrical power because the contents of cache cannot survive sudden power off.
To prevent this situation, the IBM Spectrum Accelerate system includes an emergency shutdown mechanism that must be started by using an XCLI command from a system that monitors the concurrent power systems. The emergency shutdown process needs 60 seconds to complete the process of de-staging data from cache to the HDDs.
Appropriate timing must be implemented to facilitate proper submission of the shutdown command to the IBM Spectrum Accelerate system.
The following prerequisites are necessary to successfully configure an automated transmission of the emergency shutdown command:
•An IBM Spectrum Accelerate user account is available that is a member of the Storage Administrator user category.
•A concurrent power monitoring system is available that has the IBM XIV Management System XCLI utility installed.
•Personnel who can automate the transmission of the emergency shutdown command upon detection of degraded concurrent power.
10.6.1 Creating methods for detecting failing power situations and sending the emergency shutdown command to an IBM Spectrum Accelerate System
Many concurrent power solutions allow you to monitor the systems for loss of utility power input and can provide current charge levels and estimations of how long the systems can continue providing power.
To better manage emergency shutdown situations, develop a method that identifies bad power situations and send an IBM XIV Management XCLI command to the IBM Spectrum Accelerate system that instructs it to quickly destage cache to disk and power off the virtual machines. This process requires that the IBM XIV Management XCLI utility be present on the system that is monitoring the concurrent power system.
Develop an automated script or utility that issues the IBM XIV Management XCLI command to the IBM Spectrum Accelerate system when degraded power conditions are detected. To transmit the emergency shutdown command, the automated process must explicitly contain the path to the XCLI executable file or the XCLI executable file must be in the system path.
The command and proper syntax to run the xcli command is [PATH] xcli.exe -m [Management IP Address] -u [Storage Administrator User] -p [Storage Administrator Password] shutdown emergency=yes -y.
Example 10-16 shows issuing the emergency shutdown command to the system.
Example 10-16 Example of emergency shutdown command
C:> C:Program FilesIBMStorageXIVXIV GUIxcli.exe -m 192.168.121.140 -u admin -p adminadmin shutdown emergency=yes -y
Command executed successfully.
10.7 Handling IBM Spectrum Accelerate events
IBM Spectrum Accelerate events and alerts are an important means of monitoring the status and sanity of a system. IBM Spectrum Accelerate is based on proven IBM XIV technology. For more information about the monitoring capabilities, see IBM XIV Storage System Architecture and Implementation, SG24-7659.
|
Note: For more information about IBM Spectrum Accelerate events, see Appendix A, “IBM Spectrum Accelerate events list” on page 389.
|
10.7.1 IBM Spectrum Accelerate events and alerts
This section summarizes some basic information about events and alerts.
Events and alerts
Events are used by the system to report user actions, such as creating pools, volumes, snapshots, host connectivity, and target connectivity. Events also are used for reporting failures or stating changes of hardware or software components. They can be set up in such a way that notifications are sent through email, SMS messages, or SNMP traps that are based on the severity and the event code.
Alerting events or alerts are important events that are repeatedly reported after a snooze period until they are cleared by using the GUI or by XCLI commands. Alerting events can also be escalated if they are not cleared within a predefined time period to another recipient or distribution list.
Event severity
Events are classified into a level of severity depending on their effect on the system. Figure 10-26 shows an overview of the criteria and meaning of the various severity levels.

Figure 10-26 Event severity
Sample case for demonstrating alerts and events by using the IBM XIV Management GUI
To describe alerting events, this example assumes that a module failed because of a power loss. The System view shows the module as failed and in phasing out state, as shown in Figure 10-27. In addition, the module is marked with a red triangle and a Hardware Alert notification is displayed.

Figure 10-27 Hardware alert because of module failure
Switching to the Alerts view, several component and disk-related alerts are shown with a severity of Major because of the importance of this failure, as shown in Figure 10-28. The When column lists the time that passed since the alert was raised, which provides an indication of how long the failure condition existed.

Figure 10-28 Alerts generated for a module failure
Switching to the Events view, similar messages are listed that report the module failure, as shown in Figure 10-29. In addition to critical events, such as the module failure, other events were created that are associated with the failure. These events include recovery actions as data rebuild and redistribution events are Informational in nature.
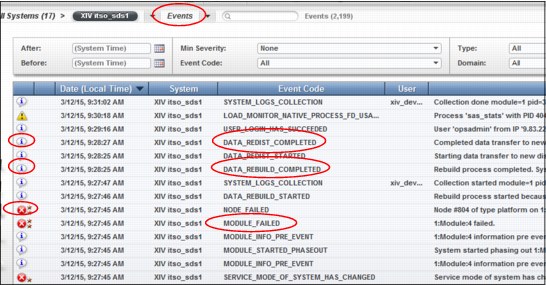
Figure 10-29 Events generated for a module failure
After repairing the failed module and starting a component test, the system reduces the importance of the alerts and marks them with a yellow warning triangle, as shown in Figure 10-30.

Figure 10-30 Alerts after module test started
Switching to the Events view shows the start of the module component test and the initial actions, as shown in Figure 10-31.

Figure 10-31 Module component test started
After the component test is successful, a phase in of the module is conducted, which brings the module back to an OK state and clears the alerts. The Alert no longer contains any entries that are related to the module failure, as shown in Figure 10-32.

Figure 10-32 Alerts view is empty after resolving the module failure condition
Although the alerts last only for the duration of a problem, the corresponding events remain visible in the Events log until the reserved space on the IBM Spectrum Accelerate system wraps around. Figure 10-33 shows how you can filter the log for events with “module:4” in the description field.

Figure 10-33 Module-4 events that use Events search field
Using the IBM XIV Management XCLI event_list command to view events
You can view events with by running the event_list command when managing an IBM Spectrum Accelerate system with the IBM XIV Management XCLI utility. A short description of the command, its parameters, and a few examples are shown in the following examples.
Example 10-17 shows the description of the event_list command help information.
Example 10-17 Help command applied to event_list command
XIV itso_sds1>>help command=event_list -t all
Category Name Description Access Control Syntax Fields Example
events event_list Lists system events.
storageadmin,applicationadmin,readonly,technician,xiv_hostprofiler,xiv_maintenance,xiv_development,securityadmin,storageintegrationadmin,opsadmin
event_list [ max_events=MaxEventsToList ] [ after=TimeStamp ] [ before=TimeStamp ] [ min_severity=<INFORMATIONAL|WARNING|MINOR|MAJOR|CRITICAL> ] [ alerting=<yes|no|all> ] [ cleared=<yes|no|all> ] [ code=EventCode ] [
object_type=<cons_group|destgroup|dest|dm|host|map| mirror|pool|rule|smsgw|smtpgw|target|volume| cluster|ip_interface|ldap_conf|meta_data_object| sync_schedule|user|user_group|ldap_server|modules_status| elicense|ipsec_connection|ipsec_tunnel|cross_cons_group,...> ]
[ internal=<yes|no|all> ] [ beg=BeginIndex ] [ end=EndIndex ] [ count_all=<yes|no> ] [ domain=DomainName ]
timestamp severity code user_name description index alerting cleared tshooting
event_list max_events=10
XIV itso_sds1>>
Example 10-18, Example 10-19, Example 10-20 on page 387, Example 10-21 on page 387, and Example 10-22 on page 387 show the uses of the event_list command.
Example 10-18 List last 10 events occurred
XIV itso_sds1>>event_list max_events=10
Timestamp Severity Code User Description
2015-03-20 12:22:29 Informational MIRROR_SYNC_STARTED Synchronization of remote mirror of volume 'ITSO_XIV_Vol_002' on Target 'XIV 1310091' has started.
2015-03-20 12:22:29 Informational MIRROR_SYNC_STARTED Synchronization of remote mirror of volume 'ITSO_XIV_Vol_003' on Target 'XIV 1310091' has started.
2015-03-20 12:22:30 Informational MIRROR_SYNC_ENDED Synchronization of remote mirror of peer 'ITSO CG SDS1' on target 'XIV 1310091' has ended.
2015-03-20 12:42:24 Informational TRACES_SNAPSHOT_CREATE Traces snapshot created. ID 14
2015-03-21 04:49:05 Informational TOO_MANY_SYSLOG_MSGS Syslog messages got updated more than once today on module 1:Module:2.
2015-03-22 02:47:08 Informational USER_LOGIN_HAS_SUCCEEDED User 'team10' from IP '9.79.55.86' successfully logged into the system.
2015-03-22 04:00:04 Informational HOST_CONNECTED Host 'xivcx302' has connected to the system.
2015-03-22 04:00:10 Warning HOST_NO_MULTIPATH_ONLY_ONE_PORT Host 'xivcx302' is connected to the system through only one of its ports. #paths=1
2015-03-22 04:00:27 Warning HOST_NO_MULTIPATH_ONLY_ONE_PORT Host 'xivcx302' is connected to the system through only one of its ports. #paths=1
2015-03-22 04:01:17 Informational HOST_PROFILE_SET Host profile value has been set for host xivcx302.
XIV itso_sds1>>
Example 10-19 List last 5 events of object type mirror
itso_sds1>>event_list max_events=5 object_type=mirror
Timestamp Severity Code User Description
2015-03-20 12:12:44 Informational MIRROR_SYNC_ENDED Synchronization of remote mirror of peer 'ITSO CG SDS1' on target 'XIV 1310091' has ended.
2015-03-20 12:22:29 Informational MIRROR_SYNC_STARTED Synchronization of remote mirror of volume 'ITSO_XIV_Vol_001' on Target 'XIV 1310091' has started.
2015-03-20 12:22:29 Informational MIRROR_SYNC_STARTED Synchronization of remote mirror of volume 'ITSO_XIV_Vol_002' on Target 'XIV 1310091' has started.
2015-03-20 12:22:29 Informational MIRROR_SYNC_STARTED Synchronization of remote mirror of volume 'ITSO_XIV_Vol_003' on Target 'XIV 1310091' has started.
2015-03-20 12:22:30 Informational MIRROR_SYNC_ENDED Synchronization of remote mirror of peer 'ITSO CG SDS1' on target 'XIV 1310091' has ended.
XIV itso_sds1>>
Example 10-20 List 5 events before timestamp of type host
XIV itso_sds1>>event_list max_events=5 before=2015-03-22.04:01:00 object_type=host
Timestamp Severity Code User Description
2015-03-18 06:07:12 Warning HOST_NO_MULTIPATH_ONLY_ONE_PORT Host 'xivcx302' is connected to the system through only one of its ports. #paths=4
2015-03-18 10:15:55 Warning HOST_DISCONNECTED Host 'xivcx302' has disconnected from the system.
2015-03-22 04:00:04 Informational HOST_CONNECTED Host 'xivcx302' has connected to the system.
2015-03-22 04:00:10 Warning HOST_NO_MULTIPATH_ONLY_ONE_PORT Host 'xivcx302' is connected to the system through only one of its ports. #paths=1
2015-03-22 04:00:27 Warning HOST_NO_MULTIPATH_ONLY_ONE_PORT Host 'xivcx302' is connected to the system through only one of its ports. #paths=1
XIV itso_sds1>>
Example 10-21 List last five module failures before specified date
XIV itso_sds1>>event_list max_events=5 before=2015-03-22.04:01:00 code=module_failed
Timestamp Severity Code User Description
2015-03-12 09:27:45 Critical MODULE_FAILED 1:Module:4 failed.
2015-03-13 13:05:05 Critical MODULE_FAILED 1:Module:1 failed.
2015-03-18 10:55:39 Critical MODULE_FAILED 1:Module:1 failed.
2015-03-18 11:02:07 Critical MODULE_FAILED 1:Module:3 failed.
2015-03-20 12:12:22 Critical MODULE_FAILED 1:Module:4 failed.
Example 10-22 List last five failures of severity critical
XIV itso_sds1>>event_list max_events=5 min_severity=critical
Timestamp Severity Code User Description
2015-03-13 13:05:05 Critical MODULE_FAILED 1:Module:1 failed.
2015-03-18 10:55:39 Critical MODULE_FAILED 1:Module:1 failed.
2015-03-18 11:02:07 Critical MODULE_FAILED 1:Module:3 failed.
2015-03-18 11:03:25 Critical SYSTEM_NO_SPARES System has no spare disks
2015-03-20 → Critical MODULE_FAILED 1:Module:4 failed.
XIV itso_sds1>>
..................Content has been hidden....................
You can't read the all page of ebook, please click here login for view all page.