
You might be wondering what the chapter about optimization is doing way at the back of the book. Its placement here reflects our philosophy that optimization does not belong at the forefront of your mind when building your applications. This chapter describes the role of optimization, including when and how to apply it, and demonstrates some very practical techniques to get great performance improvements in the software you build. You'll be encouraged to keep your design clean and clear as the first order of business, and use hard facts to drive the optimization process. Armed with this knowledge, you will be able to measure your progress and identify when the optimization effort has stopped adding value.
In this chapter, you learn the following:
How optimization fits into the development process
What profiling is and how it works
How to profile an application using the standard Java virtual machine mechanism
How to profile an application using the free Java Memory Profiler tool
How to identify performance issues related to both the CPU and memory usage
How to achieve huge performance increases with small and strategic alterations to code
Optimization is an important part of software development, but not as important as you might think. We recommend that you take time to accumulate an awareness of the types of issues that affect performance in your particular programming environment, and keep them in mind as you code. For example, using a StringBuffer to build a long character sequence is preferable to multiple concatenations of String objects in Java, so you should do that as a matter of course.
However, you will stray into dangerous territory if you let this awareness cause you to change your design. This is called premature optimization, and we strongly encourage you to resist the temptation to build an implementation that is faster but harder to understand. In our experience, we are always surprised at the performance bottlenecks in our applications. It is only by measuring the behavior of your system and locating the real issue that you can make changes that will have the greatest benefit. It is simply not necessary to have optimized code throughout your system. You only need to worry about the code that is on the critical path, and you might be surprised to find out which code that is, even when you've written it yourself! This is where profiling comes in, which is the topic of the next section.
The key thing to remember is that a clean and simple design is much, much easier to optimize than one that the original developers thoughtfully optimized while writing it. It is also very important to choose the right algorithm initially. You should always be aware of the performance profile of your chosen implementation before trying to optimize it—that is, be conscious of whether your algorithm is O(N), O(log N), and so on. Choosing the wrong class of algorithm for the problem at hand will put a hard limit on the benefits that optimization is able to provide. That's another reason why this chapter is at the back of the book!
Experience shows that the first cut of a program is very unlikely to be the best performing. Unfortunately, experience also shows that it is unlikely that you can guess the exact reason why performance is suffering in any nontrivial application. When first writing a given program, you should make it work before making it fast. In fact, it is a good idea to separate these two activities very clearly in your development projects. By now, you know that we suggest using test-driven development to ensure the correct functioning of your programs. This is the "make it work" part. We then recommend the approach outlined in this chapter to "make it fast." The tests will keep your code on track while you alter its implementation to get better performance out of it. Just as unit tests remove the guesswork out of the functional success of your program, the techniques you learn in this chapter take the guesswork out of the performance success of your program.
The good news is that most programs have a very small number of significant bottlenecks that can be identified and addressed. The areas of your code you need to change are typically not large in number. The techniques described here enable you to quickly find them, fix them, and prove that you have achieved the benefits you want. We recommend that you avoid guessing how to make your code faster and relying on subjective opinions about the code's performance. In the same way that you should avoid refactoring without first creating automated unit tests, you should avoid optimizing without automated performance measurements.
Every program that takes a nontrivial amount of time to run has a bottleneck constraining its performance. You need to remember that this will still be true even when the program is running acceptably fast. You should begin the optimization process with a goal to meet some objective performance criteria, not to remove all performance bottlenecks. Be careful to avoid setting yourself impossible performance targets, of course. Nothing you do will enable a 2MB photo to squeeze down a 56K modem line in 3 seconds! Think of optimization as part of your performance toolkit, but not the only skill you'll need to make your applications really fast. Good design skills and a knowledge of the trade-offs you make when choosing particular data structures and algorithms are much more important skills to have at your disposal.
Profiling is the process of measuring the behavior of a program. Java lends itself to profiling because support for it is built right into the virtual machine, as you'll see later in this chapter. Profiling other languages varies in its difficulty but is still a very popular technique. Three major areas are measured when profiling a program: CPU usage, memory usage, and concurrency, or threading behavior.
Concurrency issues are beyond the scope of this chapter, so be sure to check Appendix A for further reading if you need more information on the topic.
A profiler measures CPU usage by determining how long the program spends in each method while the program is running. It is important to be aware that this information is typically gathered by sampling the execution stack of each thread in the virtual machine at regular intervals to determine which methods are active at any given moment. Better results are obtained from longer-running programs. If your program is very fast, then the results you get might not be accurate. Then again, if your program is already that fast, you probably don't need to optimize it too much!
A profiler will report statistics such as the following:
How many times a method was called
How much CPU time was consumed in a given method
How much CPU time was consumed by a method and all methods called by it
What proportion of the running time was spent in a particular method
These statistics enable you to identify which parts of your code will benefit from some optimization. Similarly for memory usage, a profiler will gather statistics on overall memory usage, object creation, and garbage collection, and provide you with information such as the following:
How many objects of each class were instantiated
How many instances of each class were garbage collected
How much memory was allocated to the virtual machine by the operating system at any given time (the heap size)
How much of the heap was free and how much was in use at a given time
This kind of information will give you a deeper insight into the runtime behavior of your code, and is often the source of many informative surprises, as you'll see later in this chapter when we optimize an example program. Again, the profiler gives you a lot of evidence on which to base your optimization efforts.
The following section shows you how to profile a Java program using two different techniques. The first uses the profiling features built into the Java virtual machine itself. These features are simple in nature, but readily available for you to try. The second technique involves an open-source tool known as the Java Memory Profiler (JMP). This provides much more helpful information in a nice graphical interface, but requires you to download and install the software before you can get started. The next section explains the sample program used in the profiling exercises.
You will use a contrived example program for the purposes of profiling and optimization. This program will be a simple Unix-style filter that takes input from standard input, assuming each line contains a word, and then sorts the words and prints them out again to standard output in sorted order. To put a twist on things, the comparator used to sort the words will sort words according to their alphabetical order were the words printed backwards. For example, the word "ant" would sort before the word "pie" because when printed backwards, "tna" ("ant" backwards) sorts after "eip" ("pie" backwards). This is simply to make the program work a little harder and make the profiling more interesting, so don't worry if it seems pointless—it probably is!
If you used this sample program to sort the following list of words:
test
driven
development
is
one
small
step
for
programmers
but
one
giant
leap
for
programming
then you'd get the following output:
one
one
programming
small
driven
leap
step
for
for
is
programmers
giant
development
test
but
Here is the code for the comparator:
package com.wrox.algorithms.sorting;

public final class ReverseStringComparator implements Comparator {
    public static final ReverseStringComparator INSTANCE = new
                        ReverseStringComparator();

    private ReverseStringComparator() {
    }

    public int compare(Object left, Object right) throws ClassCastException {
        assert left != null : "left can't be null";
assert right != null : "right can't be null";
return reverse((String) left).compareTo(reverse((String) right));
}
private String reverse(String s) {
StringBuffer result = new StringBuffer();
for (int i = 0; i < s.length(); i++) {
result.append(s.charAt(s.length() − 1 - i));
}
return result.toString();
}
}There's no need to go into great detail about how this code works, as you won't be using it in any of your programs. It implements the standard Comparator interface, assumes both its arguments are String objects, and compares them after first creating a reversed version of each.
As you can see, this class has a private constructor to prevent instantiation by other code, and a main() method that delegates most of the work to two other methods, loadWords() and sort(). It then does an apparently strange thing—it prints a message advising you to kill the program and puts itself to sleep for a while using the Thread.sleep() call. This is simply to give you more time to look at the results of the profiling in JMP when the program finishes, so don't worry about it.
Following is the code for the sort() method. It accepts a list of words, using the comparator just defined, and a shell sort implementation to sort them. Finally, it simply prints out the sorted list of words one by one:
private static void sort(List wordList) {
        assert wordList != null : "tree can't be null";

        System.out.println("Starting sort...");

        Comparator comparator = ReverseStringComparator.INSTANCE;
        ListSorter sorter = new ShellsortListSorter(comparator);

        List sorted = sorter.sort(wordList);

        Iterator i = sorted.iterator();
        i.first();
        while (!i.isDone()) {
            System.out.println(i.current());
            i.next();
        }
    }
The final method in our sample program is loadWords(), which simply drains standard input, adding each line to a List that is returned to the caller when no more input is available. The only issue here is that you need to catch any IOException that may arise:
private static List loadWords() throws IOException {
        List result = new LinkedList();

        BufferedReader reader = new BufferedReader(new InputStreamReader(System.in));

        try {
            String word;

            while ((word = reader.readLine()) != null) {
                result.add(word);
            }
        } finally {
            reader.close();
        }

        return result;
    }
If you compile and run the program, then you will need to direct it to read its input from a file, as shown by the following command line:
java com.wrox.algorithms.sorting.FileSortingHelper <words.txt
To run this command, you need to be in the directory that contains the compiled Java class files for the sample program. You also need to create or obtain a file called words.txt with a large number of lines of text in it. A quick Internet search for dictionary files will lead you to files with many thousands of words in them for this purpose. Appendix B contains the URL of the one we used when developing this book.
On our Pentium 4 laptop, running this program with a file containing 10,000 words took about a minute, with the CPU running at 100 percent. This is much longer than we are prepared to wait, so some optimization is in order. Let's take a look at what's going on by profiling this program.
The standard Sun Java virtual machine supports basic profiling out of the box. To determine whether your Java environment has this support, try the following command:
java -Xrunhprof:help
The -Xrun command-line option loads extra modules into the virtual machine when it starts. In this case, you're running the hprof module. You're also passing that module a command—in this case, help—to get some instructions on how to use it. The following listing shows the output from this command:
Hprof usage: -Xrunhprof[:help]|[:<option>=<value>, ...]

Option Name and Value  Description                Default
---------------------  ----------------------     -------
heap=dump|sites|all    heap profiling             all
cpu=samples|times|old  CPU usage                  off
monitor=y|n            monitor contention         n
format=a|b             ascii or binary output     a
file=<file>            write data to file         java.hprof(.txt for ascii)
net=<host>:<port>      send data over a socket    write to file
depth=<size>           stack trace depth          4
cutoff=<value>         output cutoff point        0.0001
lineno=y|n             line number in traces?     y
thread=y|n             thread in traces?          n
doe=y|n                dump on exit?              y
gc_okay=y|n            GC okay during sampling    y

Example: java -Xrunhprof:cpu=samples,file=log.txt,depth=3 FooClass

Note: format=b cannot be used with cpu=old|times
The preceding output shows that several different parameters can be passed to hprof to tailor its behavior. The parameter for this example is cpu=samples, which provides you with sample-based profiling of your application. The following command uses this profiling option on our sample application, and redirects both input and output to files in the current directory:
java -Xrunhprof:cpu=samples com.wrox.algorithms.sorting.FileSortingHelper <words.txt >sorted.txt
When you run the program with profiling turned on, it will run noticeably slower than before, but that is understandable because quite a bit of work is required to collect the statistics. All profilers have a big impact on performance, but the idea is that the relative measures of time spent in various parts of the program will be quite accurate.
After the program finishes, you will see the following message:
Dumping CPU usage by sampling running threads ... done.
Although it doesn't tell you, this has created a file in the working directory called java.hprof.txt that contains the information gathered during profiling. If you open this file in a text editor, then you will see contents like the following (after some boilerplate text at the top of the file):
THREAD START (obj=2b76bc0, id = 1, name="Finalizer", group="system")
THREAD START (obj=2b76cc8, id = 2, name="Reference Handler", group="system")
THREAD START (obj=2b76da8, id = 3, name="main", group="main")
THREAD START (obj=2b79bc0, id = 4, name="HPROF CPU profiler", group="system")
...
This gives you information about the threads that were running in the virtual machine. As you can see, hprof creates a thread of its own to do its work. After the thread information, you will see a series of small Java stack traces like the following:
TRACE 23:
 java.lang.StringBuffer.<init>(<Unknown>:Unknown line)
 java.lang.StringBuffer.<init>(<Unknown>:Unknown line)
 com.wrox.algorithms.sorting.ReverseStringComparator.reverse
            (ReverseStringComparator.java:48)
 com.wrox.algorithms.sorting.ReverseStringComparator.compare
            (ReverseStringComparator.java:44)

TRACE 21:
 com.wrox.algorithms.sorting.ReverseStringComparator.reverse
            (ReverseStringComparator.java:51)
 com.wrox.algorithms.sorting.ReverseStringComparator.compare
            (ReverseStringComparator.java:44)
 com.wrox.algorithms.sorting.ShellsortListSorter.sortSublist
            (ShellsortListSorter.java:79)
 com.wrox.algorithms.sorting.ShellsortListSorter.hSort
            (ShellsortListSorter.java:69)
You will see many of these stack traces occupying the bulk of the contents of the output file. They are simply all the different stack contents encountered during the sampling effort. The idea is that each time a sample is taken, hprof looks at the top of the stack to determine whether that combination of method calls has been encountered before. If so, the statistics are updated, but another TRACE record is not created. The number after TRACE (for example, TRACE 21 above) is simply an identifier that is used farther down in the profiling output, as you will see shortly.
The final section of the output is the most interesting because it indicates where the program is spending most of its time. Here are the first few lines of the final section:
CPU SAMPLES BEGIN (total = 1100) Wed Jun 22 21:54:20 2005
rank   self  accum   count trace method
   1 29.55% 29.55%     325    16 ReverseStringComparator.reverse
   2 17.18% 46.73%     189    15 LinkedList.getElementBackwards
   3 16.00% 62.73%     176    18 LinkedList.getElementForwards
   4 13.09% 75.82%     144    17 LinkedList.getElementBackwards
   5 11.55% 87.36%     127    14 LinkedList.getElementForwards
   6  2.55% 89.91%      28    19 LinkedList.getElementBackwards
   7  2.09% 92.00%      23    29 LinkedList.getElementBackwards
   8  1.91% 93.91%      21    24 LinkedList.getElementForwards
...
The most important columns here are the self and accum columns, as well as the final column that identifies which method is being described by each row. The self column indicates the percentage of execution time spent in the method itself, while the accum column defines the percentage of time spent in that method and all methods called by it. As you can see, this list is ordered by the self column in descending order, on the assumption that you are most interested in finding out which individual method is consuming the most time. The trace column is the identifying number that enables you to refer back to the trace section of the file to see more detail about the execution stack for the method in question.
Before trying to improve this situation, you'll first try profiling the same program with the Java Memory Profiler.
The Java Memory Profiler is a free tool that you can download from the following URL:
http://www.khelekore.org/jmp/
The JMP comes with great documentation to get you started, so you'll need to follow the instructions carefully. Bear in mind that the JMP is not itself a Java program, so the installation may not be familiar to you if Java is your main programming environment. For example, on a Windows system, you need to copy a DLL into your Windows system directory to get it going.
To determine whether you have the JMP installed correctly, the test is very similar to the hprof example in the preceding section. Type the following at the command line:
java -Xrunjmp:help
This will ask the JMP to give you some instructions on its use, as shown here:
jmp/jmp/0.47-win initializing: (help):...
help wanted..
java -Xrunjmp[:[options]] package.Class
options is a comma separated list and may include:
help      - to show this text.
nomethods - to disable method profiling.
noobjects - to disable object profiling.
nomonitors - to disable monitor profiling.
allocfollowsfilter - to group object allocations into filtered methods.
nogui     - to run jmp without the user interface.
dodump    - to allow to be called with signals.
dumpdir=<directoryr> - to specify where the dump-/heapdumpfiles go.
dumptimer=<n> - to specify automatic dump every n:th second.
filter=<somefilter> - to specify an initial recursive filter.
threadtime - to specify that timing of methods and monitors
           should use thread cpu time instead of absolute time.
simulator - to specify that jmp should not perform any jni tricks.
           probably only useful if you debug jmp.

An example may look like this:
java -Xrunjmp:nomethods,dumpdir=/tmp/jmpdump/ rabbit.proxy.Proxy
As you can see, the JMP has many options that you can use to tailor its behavior. For our purposes, we'll simply use the default configuration and run it against our sample program with the following command line:
java -Xrunjmp com.wrox.algorithms.sorting.FileSortingHelper <words.txt >sorted.txt
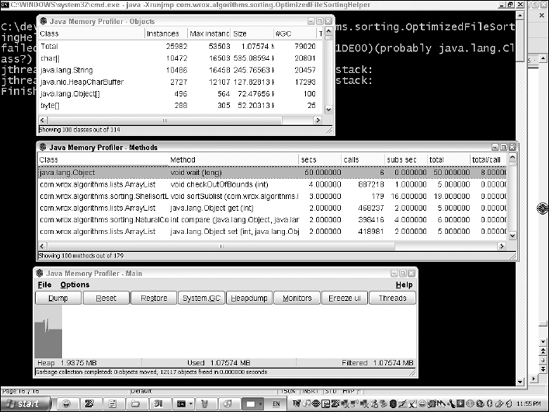
Three windows will appear with statistics, as shown in Figure 19-1.
The main JMP window (shown at the bottom of Figure 19-1) provides a graphical view of the memory being used by the running application. This shows two values changing over time: the total heap size allocated to the virtual machine, and the amount that is currently allocated for object use. You can see from the fluctuating shape of the graph that the amount of memory being used changes constantly as objects are created and garbage is collected. If the amount of memory needed exceeds the current total heap size allocated to the virtual machine, more will be requested from the operating system and the extra space will be used to store more objects.
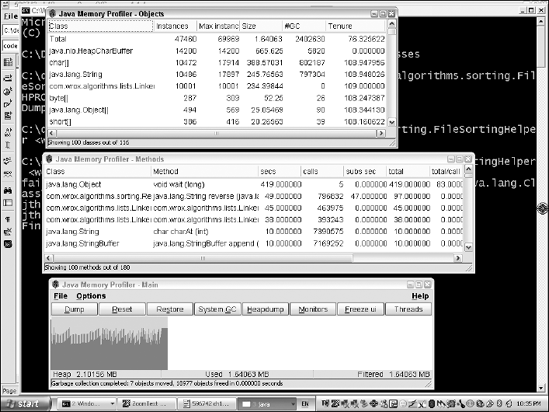
The JMP Objects window, shown at the top of Figure 19-1, lists many interesting statistics about the instances in the virtual machine. The first column shows the class name, followed by the current number of instances of the class, the maximum number of instances that have been active at any point during the running of the program, the amount of memory used by the current instances, and the number of instances that have been garbage collected during the execution. This is a column you'll have some interest in when you optimize this program shortly.
The JMP Methods window, shown in the middle of Figure 19-1, contains statistics about the methods called during the program's execution, such as the class and method name, the number of calls, how long those calls took (in seconds), and how long the methods called by the method took (in seconds). This information will also prove extremely useful when you attempt to speed up the sample program.
Before you attempt to optimize a program, be aware that if you have chosen the wrong algorithm, you will be absolutely wasting your time attempting to optimize it. For example, if you are wondering why a sorting program is slow when sorting a million records using a bubble sort, don't turn to optimization for the answer. No amount of tweaking will change the fact that an O(N2) algorithm on a large data set is going to give you plenty of time to go for a coffee while it's running. You could probably have lunch as well. This is why optimization is not the first chapter of this book; it really is not as important as you might think. We'll assume for the rest of this chapter that you have chosen the most appropriate algorithm for your purposes and that you just need to get the most out of it with your optimization efforts.
Another good way to waste time is to optimize a part of your program that is not a bottleneck on its performance. That may sound obvious, but it is extremely common for developers to twist themselves into knots to create a faster version of some code that is rarely called, or is called only at application startup, for example. These efforts inevitably result in code that is harder to understand and harder to maintain, and contributes nothing to the overall performance of the application, even though it runs faster than it previously did.
If you only remember one thing from this chapter, remember this: Don't guess why your program is slow. Find out the facts about its performance via profiling or some other means, so that you can take a targeted approach to improving it. Our recommended approach to program optimization is as follows:
Measure the performance of your program with a profiler.
Identify the significant contributors to the performance problem.
Fix one of the problems, preferably the most significant, but go for an easier one if it is also significant.
Measure the performance again.
Ensure that the change effected the desired result. If not, undo the change.
Repeat these steps until the benefits are no longer worth the effort or the performance is acceptable.
There is really no mystery to this method. It is simply a targeted approach based on some hard facts, ensuring that each change you make has a measurable benefit. The next section uses this technique to optimize our sample program.
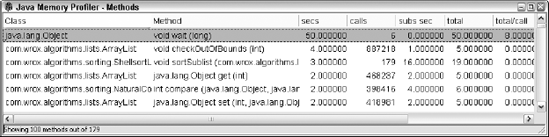
You've already profiled the sample application using the JMP, and now you're interested in why it is so slow. Take a closer look at the JMP Methods window shown in Figure 19-2 to see where all the time is going.
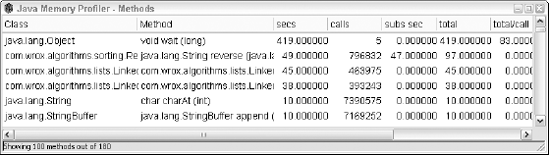
You'll notice that you're spending a lot of time reversing String objects, and you're spending a lot of time doing LinkedList manipulations as well. (You can ignore the top item in this list because that's just the time you spent looking at the screen before you pressed Ctrl+C to kill the application.)
So what do you do? You could try to figure out a more efficient way of reversing String objects, but it seems easier to deal with the LinkedList issue for now. You initially used a LinkedList, as you didn't know how many words were going to be coming in as input, but you knew it would be a lot, so you thought adding them to the back of a LinkedList would be the way to go. However, now you recall that the sorting needs a lot of index-based access to items in the list, and that's where you seem to be losing out according to the profiler. If you look at the calls column in Figure 19-2, you'll see that the two LinkedList operations are being called several hundred thousand times, with only ten thousand words to sort. This leads to the conclusion that you made the wrong choice of data structure here; building the initial list will only involve ten thousand calls to add(), so you should choose the data structure that supports the operations you need most. In this case, that's index-based access to items after the list has been built, so you need to use an ArrayList instead.
The next step is to recompile the program and profile it again with the following command:
java -Xrunjmp com.wrox.algorithms.sorting.FileSortingHelper <words.txt >sorted.txt
This time, the JMP profiler produces the results shown in Figure 19-3.
Take a closer look at the JMP Methods window again, as shown in Figure 19-4.
There's no sign of the LinkedList anymore, and, just as important, there's no sign of the ArrayList you just added. Although it often happens that a change you make will just move the problem, or even make it worse, that isn't the case here. However, this is why it is so important to measure after each change you make to ensure that your optimization efforts are moving you forward.
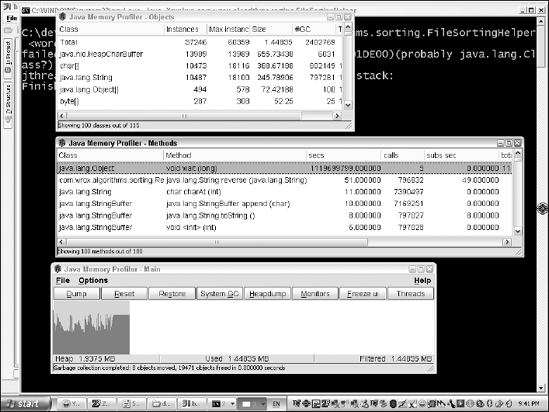
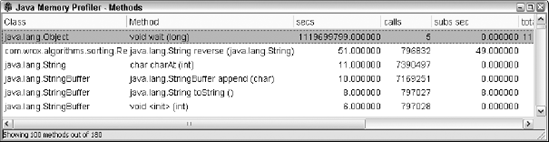
Notice in Figure 19-4 that the reverse() method in the ReverseStringComparator is taking 51 seconds, while the next largest method only takes 11 seconds. It's time to think about all this String reversing business if you're going to make the next big step forward. Take a look at how many times the reverse() method is called—almost 800,000 times! This is important information. If it took 51 seconds and was only called once, that would mean it was a fairly poorly written method indeed. As it is, it's more of an issue that it's being called so often. The situation is made even clearer by the JMP Objects window, shown in Figure 19-5.
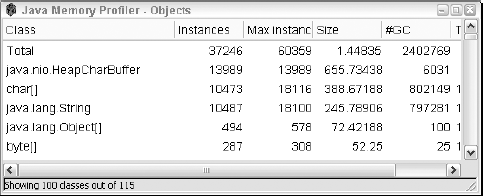
Look at the #GC column, which indicates how many objects of the given class were garbage collected during the program execution. The total shows almost 2.5 million objects were garbage collected. Surely that's ridiculous given that you only created one list with ten thousand words in it, wouldn't you think?
The clue is the number of String objects that are garbage collected. It's also around 800,000, about the same number of calls to the reverse() method in the Methods window. You can now feel confident that the issue is caused by the fact that you are reversing the String objects you are comparing every time pairs of String objects are evaluated during the sorting process. Given that each String will be involved in multiple pairwise comparisons, you're reversing the same String objects repeatedly, creating new String objects each time and spinning off thousands of objects for garbage collection. There must be a better way to do this.
If you have 10,000 input words, you could reduce the amount of work the program is doing by only reversing each String once. If you reversed them before putting them into the list for sorting, you would not even need our ReverseStringComparator at all! You could just use a natural comparator on the reversed String objects. This would eliminate all the tedious work being done during the current sorting routine, and drastically reduce the number of temporary objects you create. At least we think so; you'll have to try it and measure it, of course.
There will be the problem of printing out the sorted list at the end of the sorting process; you'll have to reverse all the String objects again to put them back into their original correct character sequences; otherwise, the output won't be what the user expects. That will be another 10,000 reverse operations, but even so, it should be a lot more effective than what you have now. Again, you won't know until you make the change and measure its effect.
Like the FileSortingHelper, this optimized version has a private constructor to prevent it from being inadvertently instantiated by other programs. The main() method is shown below:
public static void main(String[] args) throws Exception {
List words = loadWords();
reverseAll(words);
System.out.println("Starting sort...");
Comparator comparator = NaturalComparator.INSTANCE;
ListSorter sorter = new ShellsortListSorter(comparator);
List sorted = sorter.sort(words);
reverseAll(sorted);
printAll(sorted);
System.err.println("Finished...press CTRL-C to exit");
Thread.sleep(100000);
}The main() method delegates much of the work to methods that will be shown later. Note that after the words are loaded from the input stream, the reverseAll() method is called to—you guessed it— reverse all the words. The list of reversed words is then sorted using a NaturalComparator that treats them like normal strings. The strings in the resulting sorted list are then reversed again and printed out.
Next is the loadWords() method. It is unchanged from the FileSortingHelper class shown previously:
private static List loadWords() throws IOException {
        List result = new ArrayList();

        BufferedReader reader = new BufferedReader(new InputStreamReader
                                (System.in));

        try {
            String word;

            while ((word = reader.readLine()) != null) {
                result.add(word);
            }
} finally {
            reader.close();
        }

        return result;
    }
The reverse() method, shown here, was all that was salvaged out of the now redundant ReverseStringComparator that you created earlier in the chapter:
private static String reverse(String s) {
        StringBuffer result = new StringBuffer();

        for (int i = 0; i < s.length(); i++) {
            result.append(s.charAt(s.length() − 1 - i));
        }

        return result.toString();
    }
The reverseAll() method simply iterates over the List provided to it, treating each element as a String that is reversed and placed back into the List:
private static void reverseAll(List words) {
        for (int i = 0; i < words.size(); ++i) {
            words.set(i, reverse((String) words.get(i)));
        }
    }
The printAll() method is also a simple list iteration routine to print out the elements in the List supplied to it:
private static void printAll(List stringList) {
        Iterator iterator = stringList.iterator();
        iterator.first();
        while (!iterator.isDone()) {
            String word = (String) iterator.current();
            System.out.println(word);
            iterator.next();
        }
}It's now time to try running our optimized version of the sample application. The following command will use the JMP to profile our OptimizedFileSortingHelper:
java -Xrunjmp com.wrox.algorithms.sorting.OptimizedFileSortingHelper <words.txt >sorted.txt
The JMP output for this run is shown in Figure 19-6.
Take a closer look at the JMP Methods window, shown in Figure 19-7, to determine whether you have eliminated the 50 seconds of effort you spent doing all that string reversing.
You can see that there is no sign of the reverse() method in this list of bottleneck methods. Note also that the biggest contributor is only taking four seconds anyway! This is looking like a huge improvement.
Now take a closer look at the JMP Objects window, shown in Figure 19-8, to determine whether your prediction of reduced garbage collection panned out as you hoped.
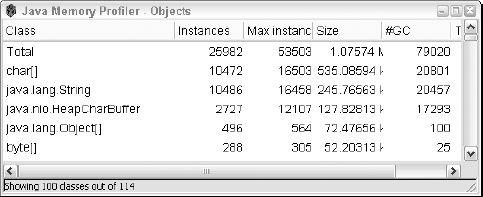
There is also a dramatic change here. Look at the #GC column for the top line, which is the total number of objects of all classes that were garbage collected during the program execution. It is less than 80,000, whereas previously it was over 2 million! Also note that the number of String objects that were garbage collected was around 20,000, which fits with our expectation of twice reversing each of the 10,000 input words. It is very important to verify that the numbers make sense to you in the context of the change you have made, so make sure you check each time you make a change and re-profile your application.
You have done two rounds of optimization for our sample application, dramatically reducing the time taken by the bottleneck execution methods. The final thing you need to do is leave the profiling and go back to normal execution to see how well it runs. Recall that this program originally took over a minute to run on our machine. Run without the JMP command-line switch:
java com.wrox.algorithms.sorting.OptimizedFileSortingHelper <words.txt >sorted.txt
The program now runs in under two seconds! That's around 50 times faster than our first version. This is quite typical of the real-world experience we have had optimizing Java code. The important thing is that we didn't have to give any thought to performance while writing the code, other than to carefully select an algorithm with the right characteristics for our needs. Well-designed code that is clear and simple lends itself to later optimization very well. For example, the fact that you were able to unplug implementations of the List and Comparator interfaces in the example program was key to achieving the performance you wanted.
In this chapter, you learned that . . .
Optimization is an important aspect of software development, but not as important as a good understanding of algorithms.
Profiling is a technique to gather hard facts about the runtime behavior of your Java code.
The Java Virtual Machine supports profiling with a simple command-line argument syntax.
The free Java Memory Profiler provides a graphical view of the memory usage of your application, allowing you to quickly find the problem areas that you need to address.
You can make an example of a slow-running program run 50 times faster with a targeted and methodical approach to optimization.