Chapter 12. Monitoring Dynamics CRM Using System Center Operations Manager
System Center Operations Manager (SCOM) is a crucial component in a Microsoft Dynamics CRM deployment. SCOM helps in optimizing and maintaining the Microsoft Dynamics CRM implementation. Microsoft Dynamics CRM consists of three tiers, and failure to maintain them (a common occurrence) can result in a poor end-user - experience.
This chapter shows you how to manage all the tiers using SCOM, and explains how to use Microsoft Operations Manager 2005 (MOM) or SCOM to maintain and optimize Microsoft Dynamics CRM performance.
SCOM Overview
SCOM enables system administrators to manage the network and servers end to end. This product integrates with Windows seamlessly, helping increase efficiency and stability in a Microsoft Dynamics CRM environment. Figure 12.1 shows the SCOM home screen.
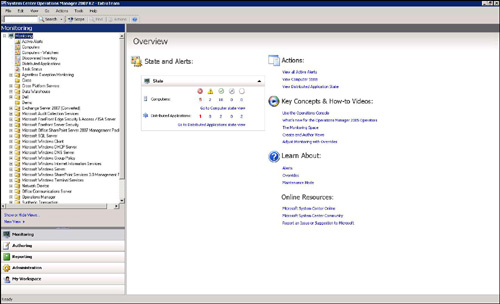
Microsoft System Center Operations Manager 2007 (SCOM) is the successor to Microsoft Operations Manager 2005 (MOM). The “MOM Versus SCOM” section of this chapter describes the differences between them in detail.
Because SCOM supports high-availability features such as clustering and failover, you can use this application to manage IT environments. SCOM can also collect Simple Network Management Protocol (SNMP) and other partner-solution data within the application. SCOM provides a unified monitoring solution, enabling administrators to view the health of all dependent and nondependent systems in a single application.
Built-in role-based security allows administrators responsible for different areas to manage their own applications and infrastructure.
SCOM 2007 can also run routine tasks, and it provides aggregated reporting to help decrease analysis and troubleshooting time. In addition, it includes management packs for more than 50 different applications that can contribute toward a systemwide solution.
Management Packs
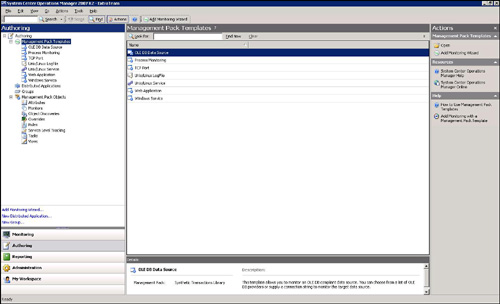
Management-pack predefined monitoring settings enable agents to monitor specific services or applications in SCOM 2007. The Microsoft Dynamics CRM Management Pack provides administrators with basic performance counters (as shown in Figure 12.2). To learn more about this management pack, see the “Installing the Microsoft Dynamics CRM 4.0 Management Pack” section later in this chapter. SCOM also allows other applications to be integrated into the unified monitoring system. You can download the installation files from Microsoft.com.
Figure 12.2 SCOM Management Pack screen.
MOM Versus SCOM
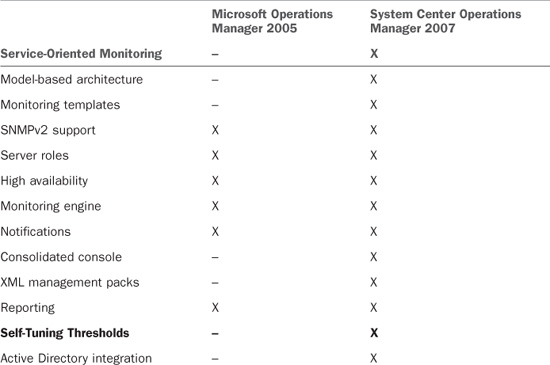
SCOM is the new version of MOM. The initial version of MOM provided administrators with a consolidated view of server health. The new version of SCOM enables administrators to view the different layers of the solution being provided to the end user (client computer health, server health, and data-tier health). SCOM provides both service-oriented monitoring and self-tuning thresholds. Table 12.1 contrasts MOM and SCOM.
Service-Oriented Monitoring
To increase the value of the monitoring systems, service-oriented monitoring is vital. Until now, IT could manage only the conventional computer components (for example CPU, memory use, disk use, and network use). With the new service-oriented monitoring options, IT can provide true “application uptime.” Service-oriented monitoring enables IT to manage all the individual dependencies of the CRM system (Windows, Internet Information Services [IIS], Microsoft CRM services, SQL Server, and reporting services) to preserve true end-user experience.
Self-Tuning Thresholds
All systems need to be tuned depending on the task that is being performed at that moment. For example, when a backup task is initiated, more CPU and memory are typically required. Therefore, the thresholds need to vary to allow faster backups. Self-tuning can provide additional memory and CPU during the time that service is running, to maintain the user experience. The self-tuning threshold monitors a set of predefined performance counters and sets an upper and lower threshold based on system usage. The system generates alerts automatically if system performance exceeds normal thresholds.
Client Monitoring
Client monitoring is a new feature in SCOM 2007. This allows organizations to manage client computers without installing a monitoring agent on the individual computers. The Agentless Exception Monitoring (AEM) feature gathers and stores the Dr. Watson application crash logs so that they can be reviewed and analyzed by operators or developers for debugging purposes.
Microsoft Dynamics CRM Architecture
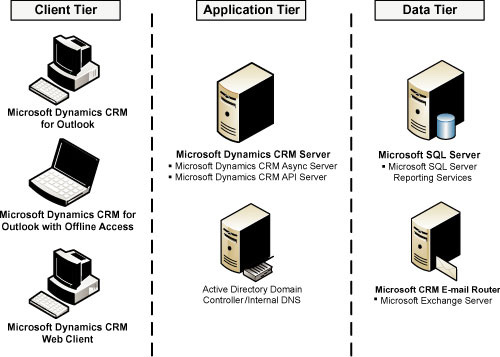
Before we begin managing the infrastructure, we need to understand the different tiers of the Microsoft Dynamics CRM landscape (see Figure 12.3). The three crucial tiers that comprise the CRM environment are the client, application, and data tiers. It is important that each individual tier be healthy and that the communications between the tiers be stable.
Figure 12.3 The different tiers of Microsoft Dynamics CRM.
Note
The tiers in Figure 12.3 represent a standard deployment. For organizations that use clustering or load balancing, the same tiers would exist, but across multiple servers.
In addition, the application tier can be deployed across multiple servers if application server roles are used.
Client Tier
The client tier is used by the end users accessing the Microsoft CRM system. If the company doesn’t have a standard for client machines, this can be a little challenging. Typically, users have a poor Microsoft Dynamics CRM experience when the following components are not performing at or above acceptable thresholds in this tier:
• Ping time to Microsoft Dynamics CRM (latency)
• Cache expiration times
• Compression technology
In addition to these possible causes of a poor client experience, offline access might create problems, too (for example, if you use the Microsoft Dynamics CRM client for Outlook). If your organization is using this feature, make sure to add additional health-monitoring performance counters for the Microsoft SQL 2005 Express. Common counters for SQL Express include the following:
• Processor
• Memory
• Offline database size
Note
System Center Configuration Manager provides a way to deploy and maintain the client configuration settings. Medium to large organizations can deploy a standard configuration and policy for all clients.
Application Tier
The application tier is responsible for retrieving the data from the data tier, processing the necessary business logic (workflows), and serving web pages to the client tier. If your organization has several users using Microsoft Dynamics CRM, you may want to consider load balancing the application or using the application role servers. (See Chapter 2, “Infrastructure Design Considerations,” for more information.)
Performance problems generally occur in the following areas:
• System resource bottlenecks
• Processor
• Memory
• Plug-ins
• SDK code
• ASPX customization
• Asynchronous server process
Data Tier
The data tier stores the data and returns any results for the query made by the application tier. The database tier of Microsoft Dynamics CRM 4.0 includes both Microsoft SQL Server and the physical databases that contain the data related to the organization.
The data tier usually has only a few limitations:
• System resource bottlenecks
• Processor
• Memory
• Disk layout
• Disk RAID
• SQL indexes
To optimize SQL Server, SQL administrators must analyze and perform various tasks to optimize Microsoft Dynamics CRM. The most common cause of performance bottlenecks is sparsely populated columns. SQL administrators need to weigh the pros and cons for the environment. Here is a list of different optimizations that can be performed on SQL Server, with some recommendations:
• Use SQL Server 2008 compression.
• Analysis: Most columns in Dynamics CRM tables are sparsely populated (except for system columns and required columns such as Account ID, Name, Phone Number, and Email Address). SQL Server 2008 has new compression features that improve the performance of a Microsoft Dynamics CRM 4.0 implementation.
• Recommendation: Identify the largest tables in the Dynamics CRM database (usually the activity tables). Estimate savings for each table by using the sp_estimate_data_compression_savings stored procedure. When the estimates are returned, enable page compression on tables with mostly static data, and enable row compression on entity tables.
• Use SQL Server 2008 filtered indexes.
• Analysis: Filtered views are used to generate the grids within the Microsoft Dynamics CRM application. This action usually loads anywhere from 25 to 200 records (based on the user’s setting). The Dynamics CRM application automatically creates some indexes on the SQL Server tables to optimize the user experience. However, filtered indexes allow Dynamics CRM administrators to map these indexes better to the views.
• Recommendation: Only create filtered indexes on most frequently executed queries or longest running queries.
• Use SQL Server 2008 sparse columns.
• Analysis: The sparse columns feature in SQL 2008 is a great feature enhancement, which reduces the space required to store data in user-specified columns. Also, by setting these columns as sparse, Dynamics CRM administrators optimize the access to columns that contain mostly null values.
• Recommendations: Designating a column as sparse is useful only when the column contains mostly null values. Consider using sparse columns when the space saved is at least 20 percent to 40 percent, to strike a balance between saving disk space and any CPU overhead.
• Use filtered indexes and sparse columns.
• Recommendation: Use only this combination of filtered indexes and sparse columns if the table has a large number of sparse columns and contains a lot of data.
• Use filtered indexes and row compression.
• Recommendation: Using filtered indexes in conjunction with row compression yields both performance improvements and space savings.
• Perform and maintain backups more efficiently by Using SQL Server 2008 backup compression.
• Recommendation: Enable backup compression to increase the efficiency of performing and maintaining backups.
Installing the Microsoft Dynamics CRM 4.0 Management Pack
The Microsoft Dynamics CRM 4.0 Management Pack has built-in metrics for a healthy CRM environment. The management pack collects performance-analysis and capacity-planning data by tracking various system metrics. This management pack has predefined thresholds for the monitoring and alerting engine to warn administrators of potential problems.
By managing these Microsoft Dynamics CRM components in SCOM, administrators can quickly and accurately react to critical events or key performance bottlenecks, and take appropriate action to prevent Microsoft Dynamics CRM system outages.
The SCOM Management Pack monitors the following components:
• Microsoft Dynamics CRM asynchronous processing service
• Microsoft Dynamics CRM deletion service
• Operability of ISV plug-ins
• IIS - World Wide Web Publishing
• Web application requests processing
• Simple Object Access Protocol (SOAP) exceptions, and unexpected failures
• Detects brute-force attacks and denial-of-service attacks
• Microsoft Dynamics CRM database indexes
• Database query processing
Installation of the Management Pack
In this section, we install the appropriate management packs for the Microsoft Dynamics CRM platform:
1. Search for and download the Microsoft Dynamics CRM Management Pack from http://www.microsoft.com/downloads/.
2. Launch Setup.
3. Read and agree to the license agreement, and then click Next
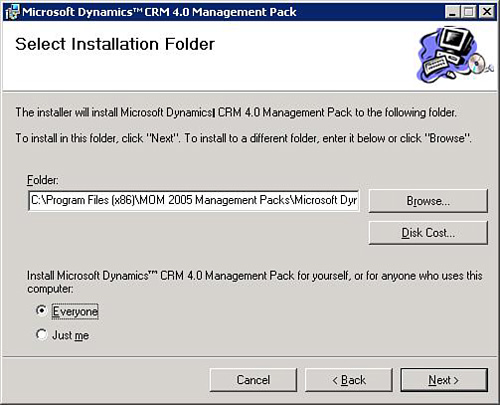
4. Select Everyone to ensure that the management packs are available for everyone who is allowed to administer the SCOM system (see Figure 12.4).
Figure 12.4 Setup location for the management pack.
5. Click Next and then Finish to complete setup.
Note
The Microsoft Dynamics CRM Management Pack works with both MOM and SCOM 2007.
SCOM is a great tool for monitoring the system as a whole and can produce a consolidated view of the health of the system.
SCOM stores all the historical data, but aggregating and viewing the data in a single view can be time-consuming. Figure 12.5 shows a consolidated view with the uptime of the servers. The figure shows a hierarchical view of servers, grouped by the various services running on different servers.
Figure 12.5 SCOM data in a pivot table.
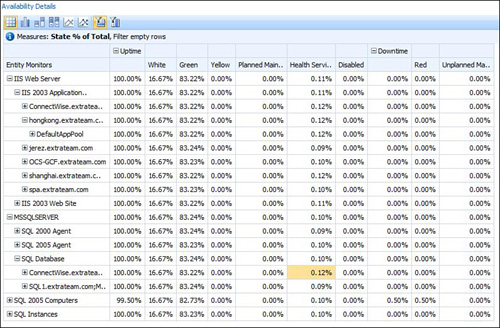
Figure 12.6 shows server uptime. In this example, the service is not performing at the optimal level because of server (one server) unavailability.
Figure 12.6 SCOM data in a graphical format.

You can use Microsoft toolkits to build some of the dashboards and thus leverage the following systems:
• SCOM 2007 R2: Monitor server health (via performance counters, event logs, and service status).
• Microsoft SQL Server Database Server: Store data collected by SCOM.
• Microsoft SQL Server Integration Services: Transform transactional databases into data warehouses.
• Microsoft SQL Server Analysis Services: Organize SCOM data in an analytical format (dimensions, fact table, measures, and key performance indicators).
• Microsoft Office SharePoint Server 2007: Provide the foundation layer to view aggregated data from many sources.
• Microsoft Performance Point Services 2007: Create a presentation layer for a high-level view of the entire system.
Summary
This chapter explained the monitoring system for the Microsoft Dynamics CRM system from end to end (data tier, application tier, client tier). SCOM has management packs specifically designed for Microsoft Dynamics CRM and provides a service-oriented monitoring solution for organizations. Using this feature, organizations can identify and maintain the appropriate dependencies and can provide higher uptime for end users.
SCOM provides a complete solution in a unified view for all dependent applications and systems. SCOM can be extended, and system integrators can deploy a system-health dashboard.

