Chapter 6. Business Intelligence
Customer relationship management (CRM) is an essential profitability and growth vehicle. It provides effective management of marketing initiatives, sales execution, and service portfolios. It also enables cross-departmental collaboration, such as the marketing department handing over campaign leads directly to sales, customer services passing on a customer satisfaction index to sales before the next sales call, or customer services providing feedback to the product managers for the most requested features that they hear about in a support call.
Seeing the Big Picture
Although the CRM system creates and maintains the activity record for sales, marketing, and service departments, and facilitates the collaboration between them through workflows, the secret sauce that brings about the ultimate profit impact is analytics, also known as business intelligence (BI). BI provides an all-around view of customer interaction activities and records as managed or experienced by the marketing, sales, and customer services teams. Architecturally speaking, BI can also be considered an abstraction layer above the deployed CRM system, while also integrating into the CRM system at the grassroots level (see Figure 6.1).
Figure 6.1 Microsoft Dynamics CRM and business intelligence.
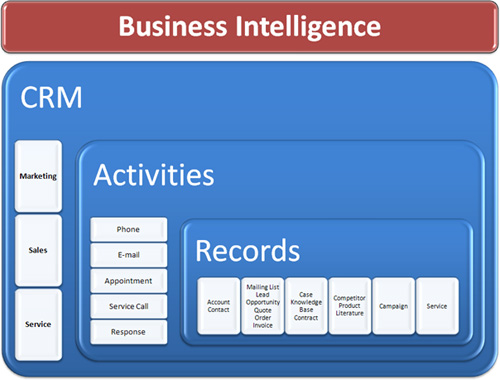
Microsoft Dynamics CRM manages and exposes this interdepartmental information in multiple ways, such as, through standard stock reports from the CRM user interface, and through the Microsoft BI tool stack, which provides online analytical processing (OLAP) capability using SQL Server Analysis Services (SSAS) cubes, dashboard capability using PerformancePoint Server, and ad hoc analytical capability through Excel. This chapter provides a brief overview of the value of using BI tools with the CRM data, along with a click-through example of building a sample BI application.
What Is BI?
BI is a set of technologies used to gain insight into past, present, and future possibilities in business activities, to assist better business decisions. These technologies typically extract useful data from various back-office systems—such as enterprise resource planning (ERP), supply-chain management (SCM), general ledger (GL), and customer relationship management (CRM), and so on—and then transform and load it into a data warehouse or data marts. This data is then aggregated, enriched with business calculations in an OLAP cube, and finally presented to an information worker through a corporate performance dashboard that provides a visual summary of the key indicators or through flexible ad hoc analysis tools for in-depth slicing and dicing of the data.
The Secret Sauce in Your CRM Success
Many standard metrics related to customer trends and demographic information are available in the CRM system out of the box. Here are some examples of the analysis that the standard reports can provide:
• Opportunities and sales cycle reports
• Pipeline and sales forecast reports
• Campaign response reports
• Customer satisfaction reports
• Case resolution reports
These stock reports, although useful for viewing basic information, generally do not align well with the corporate goals and key performance metrics unique to individual companies. Every company can have CRM strategies, directions, or initiatives peculiar to its market situation. These reports also do not take the surrounding information into account, which can be critical in understanding the market situations or influencers. This “custom” requirement for every company demands cognizance and requires a tailored response that includes integrating a BI initiative with the CRM strategy according to the atypical needs.
Regardless of the industry, companies that have integrated their CRM and BI strategy have experienced significant competitive advantage. The premise is that analysis of relationships between the surrounding information and the direct customer interaction information can predict customer behaviors more effectively than possible with just the standard reports. To arrive at such results, however, significant time has to be spent in formulating business questions and then aligning the BI implementation with the direction in which the company wants to go or with any particular process that a company wants to improve (see Figure 6.2).
Figure 6.2 Business data required for BI.
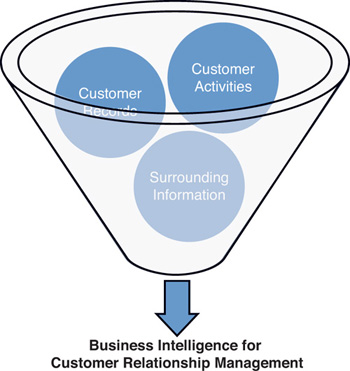
Here are some scenarios for using BI for CRM in cross-departmental settings. BI can enable a salesperson to have an insight into the history of customer issues logged by support staff before proposing a new deal. Similarly, field marketing can use the sales data of lead conversion to better target customers at an industry or product vertical event. Another example is that BI can reduce cost by calculating the efficiency of the case resolution process (for example, to determine whether service staff should be onsite or offsite). In many other cases, standard reports won’t suffice, and an integrated BI application will results in insights much closer to corporate goals and strategies.
Implementation Guidelines
Success of a CRM project depends on how well it serves the profitability and growth of a company. As mentioned earlier, the key secret sauce in making this happen is BI. Success of a BI project for a CRM system, in turn, depends on how well the methodology of aligning the business goals and business processes with the implementation efforts is followed. The challenges in implementing a BI application for CRM can vary from company to company. These challenges will depend on various factors, such as the maturity level of IT organizations, the type of industry, and even the selected technologies. But there is still a base guideline that all successful BI projects can follow.
• Consolidated, centralized data warehouse: It is preferable that a centralized repository is created to store and maintain data from CRM and from all other source systems. This will enable the enterprise to do cross-subject area analysis by correlating data from disparate data sources.
• External data: Adding as much richness as possible by integrating ancillary and surrounding data will enhance the competitive edge of the enterprise by allowing the discovery of latent influencers of customer behaviors.
• Data cleansing: There is a chance that the data imported from the CRM systems contains duplicate, incomplete, or wrong entries. Also, the external data imported can contain similar problems and may not merge with the CRM data very well. This data can be cleaned and referenced for better data integrity and stewardship. See Chapter 8, “Master Data Management (MDM),” for a discussion about this related topic.
• Strategy alignment: Aligning key BI metrics with the corporate goals and strategies puts the BI effort in the desired direction and provides a baseline to measure the progress against. As the company direction changes, the CRM scorecards can be tweaked to reflect the same.
• Business process identification: Core business processes that can either provide the input for the BI project or that can consume the key metrics need to be identified. Occasionally, some key data elements may not be captured in CRM records. This finding can lead to a separate initiative to generate the missing strategic data.
• Process change management or refinement: The final guideline in an integrated BI and CRM project is to go through a CRM process change management or refinement, as per the understanding gained from the data, and then to evaluate the effects of the change over time as a feedback mechanism.
Most companies have notably varied business goals, processes, and systems. They can also have very different challenges in terms of their sales, marketing, and service functional groups. When implementing BI systems, remember that there is no “one size fits all” solution. BI systems, by definition, have to be tailored to business needs, even though the products underneath can be the standard BI tools.
Embedded BI
BI provides powerful insights into the customer data, which is typically not possible through standard reports. However, managing the actions taken on those insights is not a traditional aspect of BI. BI, when “embedded” into a transactional system like CRM, with actionable information is called embedded BI. This type of integration is done by placing the BI dashboards or ad hoc capabilities inside the transactional tools that users can use conveniently. Embedded BI can also go as far as suggesting actions to the information workers based on the computed data analysis. Embedded BI is different from an operational report because an operational report would have simply taken the stored data from the local repository, whereas, these embedded BI tools behind the scenes go back into centralized data repositories and provide rich supplementary information.
Caution: BI Is Not CRM
Many companies claim that if they have a BI system they don’t need a CRM system because of the powerful insights about customers that their BI provides. Although it might seem obvious that BI by itself is not a complete CRM system, such confusion still prevails. One way to distinguish the two is to note that while a BI system can enable companies to integrate external data and gain insights into the actions taken, it does not have an inherent ability to take actions on them. To take the action in a systematic way, one still has to go back into a system that is meant for taking them, such as a CRM system. Although both BI and CRM systems can benefit each other through integration, they are not meant to replace each other. BI provides the insight into past, present, and even future possibilities of business transactions, and CRM completes the business cycle by integrating actions into the analytics offered by BI.
Microsoft Business Intelligence Roadmap
Microsoft has progressively invested in its BI product offerings since the SQL Server 7.0 days. Its most current offering and the near-future release updates are discussed in this section. Simply speaking, the Microsoft BI tools are covered within the three product suites: Microsoft Office SharePoint Server 2007, Microsoft Office 2007, and Microsoft SQL Server 2008. All three product suites have more granular-level components and features that when used in permutation and combination enable capabilities ranging from data integration, aggregation, reporting, and all the way up to ad hoc analysis, self-service reporting, dashboards, and collaborative decision making (see Figure 6.3). The tight integration between the three product suites, especially for the purposes of BI, is a unique value proposition Microsoft brings to the table. This enables lower cost of operation and faster development time by leveraging existing investments and skills. The following diagram depicts how the products stack up to provide the mentioned BI capabilities.
Figure 6.3 Interface layers from data to presentation layer.
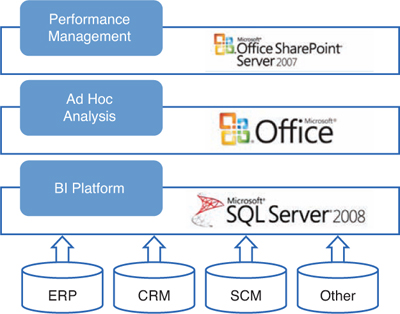
SQL Server 2008 consists of four essential BI components: the core SQL Server Database engine (SSDB), SQL Server Analysis Services (SSAS), SQL Server Integration Services (SSIS), and SQL Server Reporting Services (SSRS). Consider what you can accomplish with these individual components. For instance, SSDB enables users to create and manage a data warehouse for a CRM system with filtered views as a logical data abstraction layer in a relational database. SSAS enables users to create powerful calculation in a multidimensional data cube. SSIS enables users to process the data from all possible data sources in a powerful ETL (extract, transform, and load) tool. And finally, SSRS enables users to create standard and scheduled reports.
Microsoft Office 2007, with the classic and most common BI tool in the world, Excel, is an indispensable part of the BI tool stack. It enables users to connect to SSAS and to the relational database to perform spreadsheet-type analysis. End users can make use of the Excel functions in an already familiar environment. Excel has also been improved and extended to provide ease of use.
Microsoft Office SharePoint 2007 can be used as a display mechanism for the key performance indicators (KPIs), scorecards, and strategy maps built using the PerformancePoint Server 2007. Together, these enable users to create performance management dashboards. At the time of this writing, SQL Server 2008 R2 (Kilimanjaro) and Microsoft Office SharePoint 2010 (Office 14) have already been announced and are going to contain several important BI updates. The top ones that stand out for this discussion are master data services, self-service reporting, and fast search. Master data services will help in creating a common reference lookup repository for further semantic integration between CRM, BI, and other enterprise resource management systems.
Microsoft BI Tool Stack: In Pictures
Figure 6.4 shows a typical deployment architecture for a BI project (this one involving the Microsoft BI tool stack). Going from left to right, the data moves from the source system and is processed in an SSIS ETL pipeline for cleansing (and other transformations). The data is then loaded and stored in a data warehouse, which becomes the central repository for all analytical needs. Depending on the subject areas and analytical needs, multidimensional cubes are created with all the calculations, attributes, and hierarchies familiar and useful to users. Finally, the well-organized and well-integrated rich data is consumed by users through reports, dashboards, and ad hoc analysis tools.
Figure 6.4 Microsoft Dynamics data flow process.
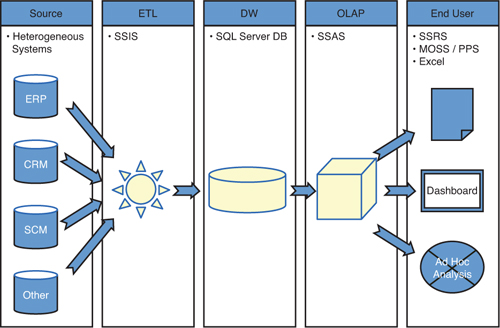
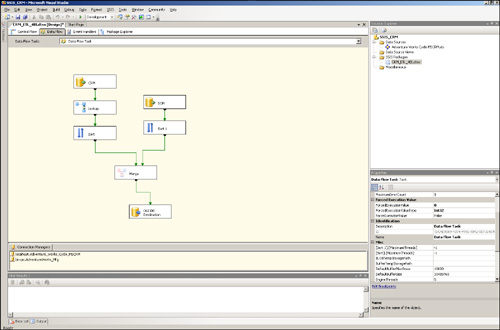
Figure 6.5 shows the SSIS package for ETL purposes, as a project type in the familiar interface of Visual Studio. SSIS is a powerful data integration engine that can assist in extracting data from databases, text files, and from web services. With SQL Server 2008, the SSIS pipeline has been optimized for faster operations, such as reference lookups, sorting, aggregating, and loading data into tables.
Figure 6.5 SSIS showing the data flow.
Note
In Microsoft Dynamics CRM, the data integration and data warehouse part is pre-assembled and ready to use in the form of filtered views. SSIS can be used to extend this by pulling data from different sources and consolidating it with other subject areas, such as SCM or ERP. If only the CRM data is of interest at this point, the filtered views can be used to build a cube or data mining structure to put together reports, ad hoc analysis, and dashboards.
Figure 6.6 shows the filtered views available for analytical needs, pre-created as part of the Microsoft Dynamics CRM standard installation.
Figure 6.6 Microsoft Dynamics CRM filtered views.

Figure 6.7 shows the analytical capabilities of Excel 2007. Excel not only has nice charting and color-coding capabilities, it also has an easy parameter-selection interface that includes the new pivot table selection pane on the right.
Figure 6.7 Analyzing Microsoft Dynamics CRM data in Excel.
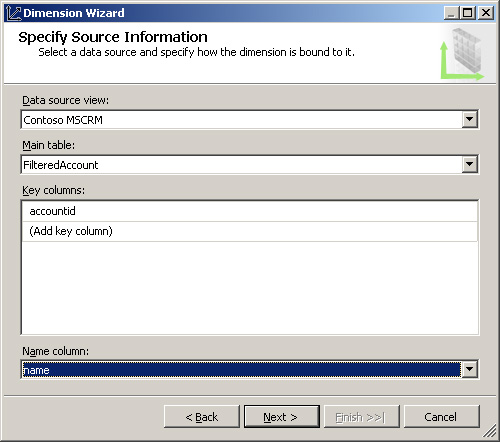
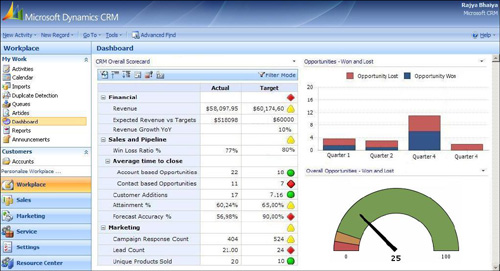
Figure 6.8 shows a dashboard created using PerformancePoint Server. It has a scorecard on the left and embedded charts and spreadsheets on the right. The best part is that these dashboards can be deployed to hundreds of users and still can be entirely personalized using hidden and user-operable parameters.
Figure 6.8 PerformancePoint dashboards embedded into Microsoft Dynamics CRM.
Going Forward: Predictive Analytics
While multidimensional analysis (or OLAP) can present the data for deep exploration with power slice-and-dice capability, predictive analytics or data mining can provide the futuristic outlook or possibilities using machine-learning algorithms to predict sales, marketing effectiveness, and service efficiency.
Such predictions can help in reprioritizing resource utilization, both human and facilities, help in preparing a better marketing list, and even forecast the sales pipeline. Algorithms can detect the relationships between, say, the products and the sales teams, and determine the likelihood of the success of a sales call. The algorithms can also predict things such as which products are good to sell together, which attributes influence the likelihood of a certain outcome, or can categorize customers into small pockets based on their profiles. Some of these algorithms are even sophisticated enough to predict the next likely event in a sequence of occurrences, or in a series of time.
Microsoft provides the following data mining algorithms out of the box:
• Microsoft Decision Tree
• Microsoft Linear Regression
• Microsoft Naïve Bayes
• Microsoft Clustering
• Microsoft Association Rules
• Microsoft Sequence Clustering
• Microsoft Time Series
• Microsoft Neural Networks
Demo Clickthrough
This section contains a short clickthrough demo of a sample BI application that starts with defining a cube and ends with using that cube with a business dashboard. The intent of this clickthrough is not to provide in-depth knowledge of the cube building and dashboard building process but to provide a jump start for BI for CRM based on the pre-created filtered views. The BI application, as mentioned earlier in this chapter, can be enriched by first going through the exercise of defining the corporate goals and then aligning the implementation with the corporate strategies. In this example we will build dashboards for opportunity and support analysis, showing a business flow from selling the opportunity to supporting it over time.
Cube Building
The tool for building OLAP cubes in the Microsoft world is SSAS. In the SQL Server 2005 release, the development tool for the cubes is Visual Studio. A Visual Studio shell ships with SQL Server Business Intelligence Development Studio (BIDS). There is also a special project type for the BI projects, in which SSAS, SSRS, and SSIS projects can be created.
Create an Analysis Services Project
1. In BIDS, select File, New, Project (see Figure 6.9).
Figure 6.9 Create a new project.
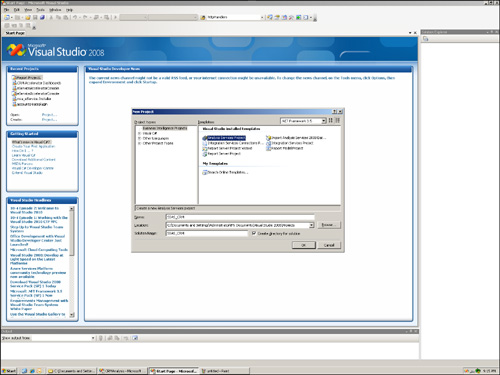
2. Select Business Intelligence Projects from Project Types, and then click Analysis Services Project.
3. Name the new project SSAS_MSCRM. Leave the location for the project as default.
Note
After the new project is created, right-click the SSAS_CRM database icon in Solutions Explorer and select Properties. In the Properties window, click Deployment and make sure the server name is appropriate.
4. If an Analysis Services instance is installed on the local computer, then localhost should do the job. If not, select the Analysis Services server available for testing the sample click-through.
Create a Data Source
1. Right-click the Data Sources folder in Solutions Explorer and select New Data Source to open the Data Source Wizard.
2. In the Data Source Wizard, click Next, and then select New to create a new data connection string.
3. In the Connection Manager dialog, to create a new connection string, type in the server name (for example, localhost) and select the Contoso_MSCRM database from the drop-down.
4. Click OK to close the dialog box, and click Next to reach Impersonation Information screen.
5. Select Use the Service Account as the Impersonation Method, especially if the SSAS server is localhost (see Figure 6.11).
6. Click Next and Finish to create the data source with the name Microsoft CRM MSCRM
Create a Data Source View
1. Right-click the Data Source View folder to start creating a data source view using the data source just created.
2. Click Next on the Welcome screen and Next on the Data Source screen.
3. On the Select Tables and Views screen, type Filtered in the Filter text box and apply the filter.
Figure 6.10 Connection Manager settings.
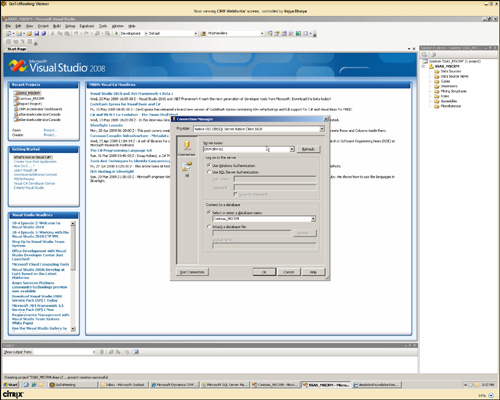
4. Select the following views from the Available objects and move them in the Included objects:
dbo.FilteredAccount
dbo.FilteredContact
dbo.FilteredInscident
dbo.FilteredOpportunity
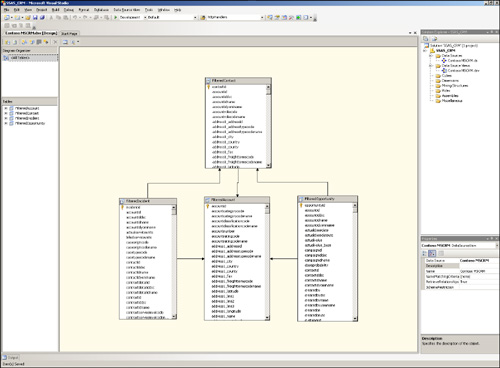
5. Click Next and Finish to create the data source view (see Figure 6.12).
6. In the data source view, right-click anywhere on the background and select New Relationship.
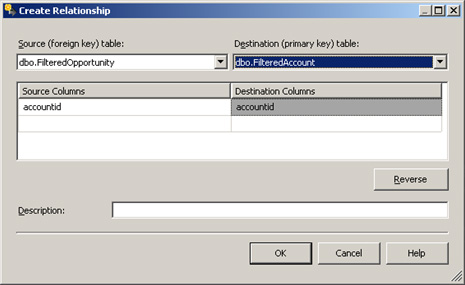
7. Create a new relationship as shown in Figure 6.13, relating accountid from dbo.FilteredAccount to the accountid column in dbo.FilteredOpportunity. Ensure that the accountid column from the Filtered Account table is selected as the primary key.
8. Click OK. When prompted to create a logical primary key on the destination table, click Yes.
Repeat steps 6–8 for the following relationships (see Figure 6.14):
• accountid from dbo.FilteredAccount to accountid column in dbo.FilteredIncident
• accountid from dbo.FilteredAccount to accountid column in dbo.FilteredContact
• contactid from dbo.FilteredContact to contacttid column in dbo.FilteredIncident
• contactid from dbo.FilteredContact to contactid column in dbo.FilteredOpportunity
Figure 6.11 Data Source Wizard: Authentication.
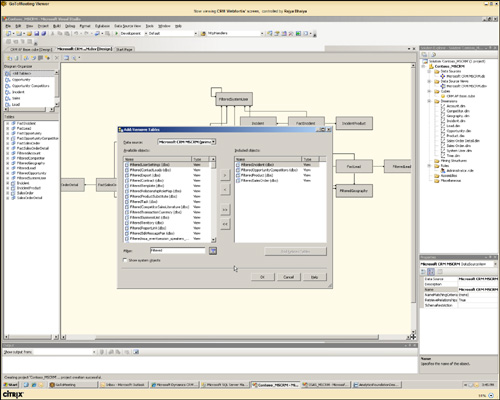
Figure 6.12 Data Source Wizard: Select Tables and Views
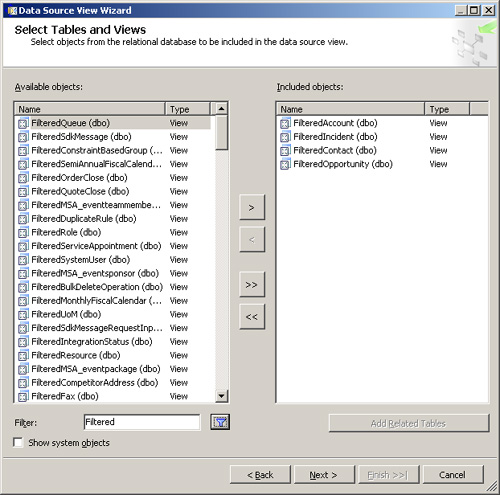
Figure 6.13 Create relationships.
Create Dimensions: DimAccount
1. Right-click the Dimensions folder in Solution Explorer, and select New Dimension; then click Next on the Welcome screen.
2. On the Select Creation Method screen, choose Use an Existing Table.
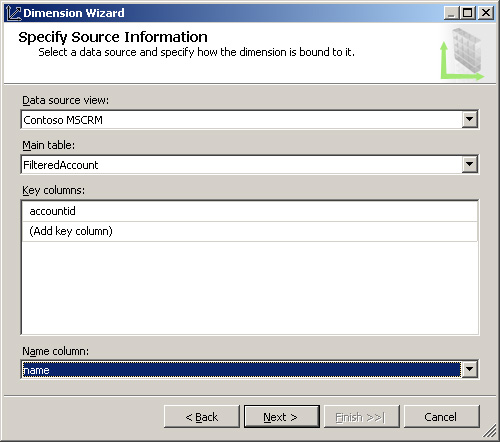
3. To specify the source information, select the FilteredAccount as the main table and Name Column as the name (see Figure 6.15). Then click Next.
Figure 6.15 Specify source information.
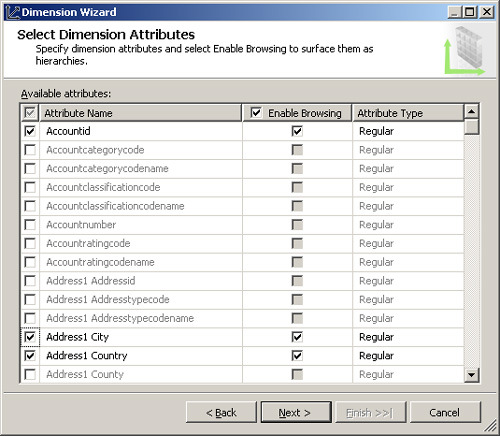
4. Select the appropriate dimension attributes. In this example, we will select the following (see Figure 6.16):
AccountId
Address1_Country
Address1_City
Figure 6.16 Specify dimension attributes.
5. Then click Next, enter DimAccount as the name for dimension, and click Finish.
Create Relationships
1. Right-click DimAccount under Dimensions in Solution Explorer, and click View Design.
2. Click Attribute Relationship, and drag and drop the City over the Country attribute to create the relationships, as shown in Figure 6.17.
Figure 6.17 Specify dimension attributes.
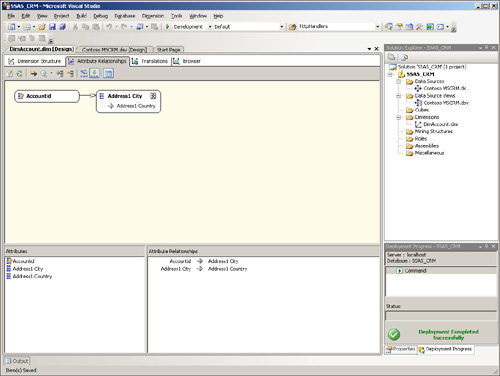
3. Click the relationship between City and Country, and change the relationship to Rigid.
4. On the Dimension Structure tab, drag and drop Country, City, and AccountId in the Hierarchies screen (see Figure 6.18). Also change the name of the hierarchy to AccountGeography.
Figure 6.18 Dimension hierarchies.
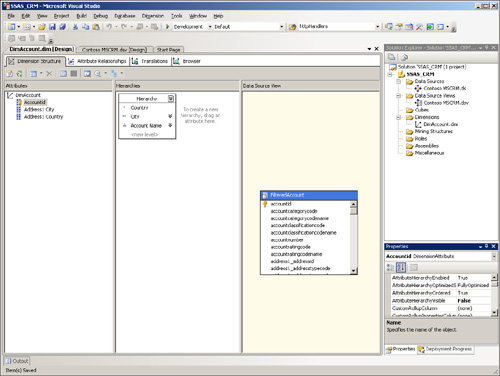
5. Change the hierarchy name in the Properties window as follows:
Address1_City to City
Address1_Country to Country
AccountId to Account Name
6. Change the AttributeHierarchyVisible property to False for the following:
Address1_City
Address1_Country
AccountId
Note
To enable Microsoft Office Communications Server (OCS) integration, you can add the telephone attribute with the callto: prefix.
Create Dimensions: DimIncident
1. Right-click the Dimensions folder in Solution Explorer, and select New Dimension; then click Next on the Welcome screen.
2. On the Select Creation Method screen, choose Use an Existing Table.
3. Specify the source information, select the main table as FilteredIncident, and title for the name column. Then click Next.
4. Uncheck all check boxes on Select Related Tables screen.
5. Select the appropriate dimension attributes. In this example, we will select the following:
IncidentId
Casetypecode
Contractservicelevelcode
CustomerSatisfaction
Statuscode
Subjectid
6. Then click Next, enter DimIncident as the name for dimension, and click Finish.
7. Right-click DimIncident under Dimensions in Solution Explorer, and click View Design.
8. Click Properties and change the Attribute Name and NameColumn to the following:
IncidentId
Name: Incident
NameColumn: FilteredIncident.Title
Casetypecode
Name: Case Type
NameColumn: FilteredIncident.Casetypename
Contractservicelevelcode
Name: Contract Service Level
NameColumn: FilteredIncident.Contractservicelevelname
CustomerSatisfactioncode
Name: Customer Satisfaction
NameColumn: FilteredIncident.Customersatisfactionname
Statuscode
Name: Status
NameColumn: FilteredIncident.Statuscodename
Subjectid
Name: Subject
NameColumn: FilteredIncident.Subjectidname
Create Dimensions: DimOpportunity
1. Right-click the Dimensions folder in Solution Explorer, and select New Dimension; then click Next on the Welcome screen.
2. On the Select Creation Method screen, choose Use an Existing Table.
3. Specify the source information, select the main table as FilteredOpportunity, and name as the column name. Then click Next.
4. Uncheck all check boxes on the Select Related Tables screen.
5. Select the appropriate dimension attributes. In this example, we will select the following:
OpportunityId
Customeridtype
Opportunityratingcode
Owningbusinessunit
stepname
Statuscode
6. Then click Next, enter DimOpportunity as the name for dimension, and click Finish.
Create Relationships
1. Right-click DimOpportunity under Dimensions in Solution Explorer, and click View Design.
2. Click Attribute Relationship, and drag and drop the Ownerid over the owningbusinessunit attribute to create the relationships.
3. On the Dimension Structure tab, drag and drop Owningbusinessunit, OwnerId, and OpportunityId in the Hierarchies screen. Also change the name of the hierarchy to OpportunityOwner.
4. Change the hierarchy name in the Properties window as follows:
OpportunityId
Name: Opportunity
NameColumn: FilteredOpportunity.name
Customeridtype
Name: Customer Type
Opportunityratingcode
Name: Opportunity Rating
NameColumn: FilteredOpportunity.Opportunityratingcodename
Ownerid
Name: Owner
NameColumn: FilteredOpportunity.Owneridname
Owningbusinessunit
Name: Owning BU
stepname
Name: Sales Stage
NameColumn: FilteredOpportunity.Stepname
Statuscode
Name: Status
NameColumn: FilteredOpportunity.Statuscodename
5. Change the AttributeHierarchyVisible property to False for the following:
Ownerid
Owningbusinessunit
Note
You can also create a time dimension to allow your organization to do time-based analyses.
Create a Cube
1. Right-click Cubes, and then click New Cube.
2. Click Next on the Welcome screen, and select Use Existing Tables on the Select Creation Method screen. Then click Next.
3. Select FilteredAccount, FilteredIncident, and FilteredOpportunity on the Select Measure Groups screen, and then click Next.
4. Select the following for the measures:
FilteredAccount:
Creditlimit
Revenue
Filtered Account Count
FilteredOpportunity:
Actualvalue
Estimatedvalue
Filtered Opportunity Count
FilteredIncident:
Actualserviceunits
Billedserviceunits
Filtered Incident Count
5. Select all the dimensions on the Select Existing Dimensions screen.
6. Uncheck all the values on the Select New Dimensions screen.
7. Then click Next, enter ContosoMSCRM for the name for dimension, and click Finish.
Set Data Types
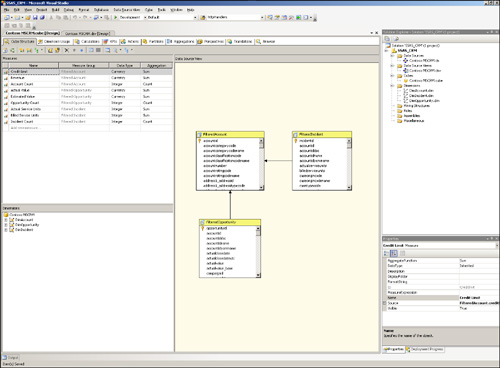
1. Right-click the ContosoMSCRM, and select View Designer.
2. In the Cube Structure tab, Click Show Measures Grid.
3. Change the measures with the appropriate data types (as shown in Figure 6.19).
Create Calculations
1. Display the Calculations tab.
2. Click New Calculated Member.
3. Enter the following values:
Name: [Opportunity Actual vs Estimated]
Expressions: [Measures].[Actual Value] / [Measures].[Estimated Value]
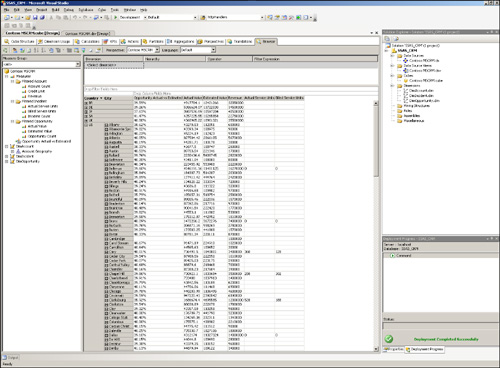
Format string: Percent
4. Process and deploy the cube. Browse the cube for testing (as shown in Figure 6.20).
Creating a New Mining Structure
1. Right-click Mining Structure, and then click New Mining Structure.
2. On the Select the Definition Method screen, select From Existing Relational Database or Data Warehouse.
3. On the Create the Data Mining Structure screen, select Microsoft Association Rules.
4. On the Select Data Source View screen, select contoso_MSCRM.
5. Select FilteredIncident on the Specify Tables Types screen.
6. Select the following on the Specify the Training Data screen (see Figure 6.21):
ticketnumber as Input
productidname as Input and Predictable
subjectidname as Input
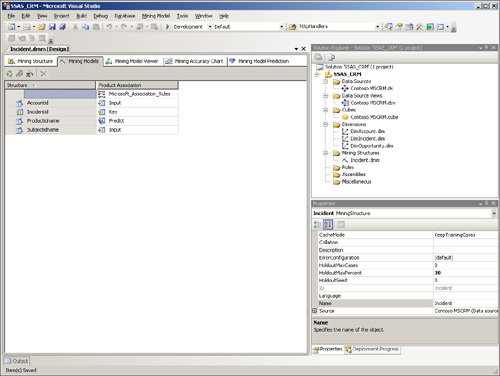
7. Click Next, and then enter the name as Incident and Mining model name as Product Association.
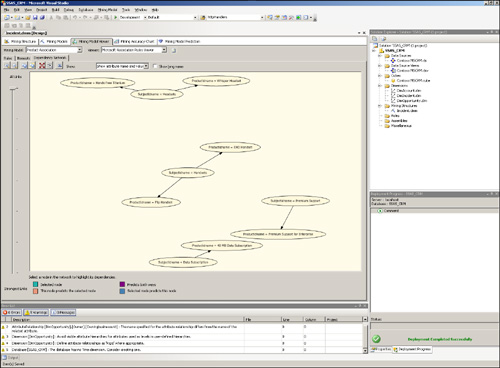
8. Opening the mining model, click the mining model viewer, and click Dependency Network to observe the corelationship of the data (see Figure 6.22).
Figure 6.22 Mining model viewer.
Building a Dashboard
1. From the Start menu, mouse over All Programs, mouse over PerformancePoint Server, and open Dashboard Designer.
2. Right-click Data Sources, and then click New Data Sources.
3. Enter the name as MSCRM, and select the check box to grant read permissions to all authenticated users
4. Under the Standard Connections, use the following values:
Server: localhost
Database: SSAS_CRM
Cube: Contoso_MSCRM
5. Save the project file as MSCRM_Dashboard.
Create a Scorecard
1. Right-click Scorecard and select New Scorecard Using the Analysis Services Template.
2. Use Opportunity Target Fulfillment as the scorecard name, and select the check box to grant read permissions to all authenticated users.
3. On the Data Source screen, select MSCRM, and then click Next.
Note
Select the appropriate data type for the various KPI data.
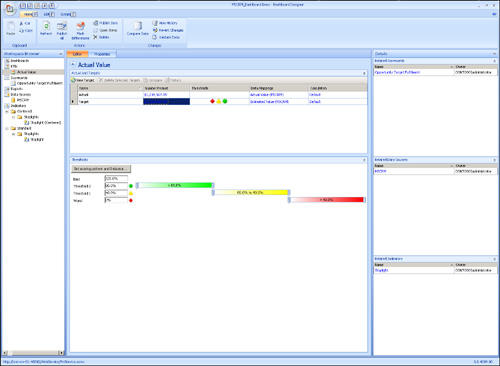
4. On the Select KPIs to Import screen, enter the values shown in Figure 6.23.
Note
Repeat the steps above to add more KPIs to your dashboard.
5. Click Next, and then click Finish.
Create a Report
1. Right-click Reports, and then click New Report.
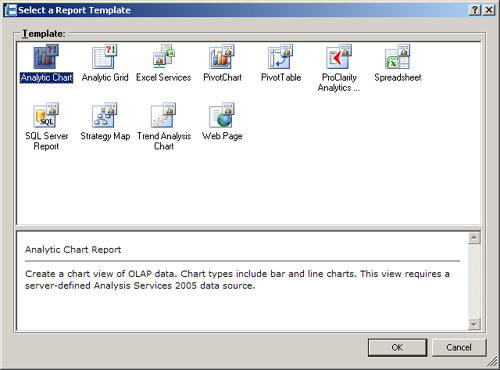
2. Select Analytic Chart (see Figure 6.24).
Figure 6.24 Report selection screen.
3. Enter the following values on the Create an Analytic Chard Report screen:
Name: Revenue Geography
Data Source: MSCRM
4. Click Next, then Finish.
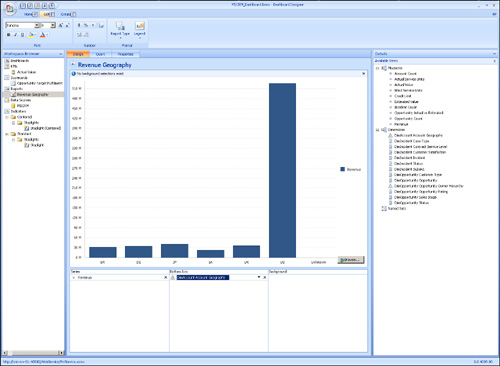
5. On the Reports Designing screen, do the following (as shown in Figure 6.25):
Add Revenue as Series.
Add DimAccount Account Geography as the Bottom Axis.
Creating a Dashboard
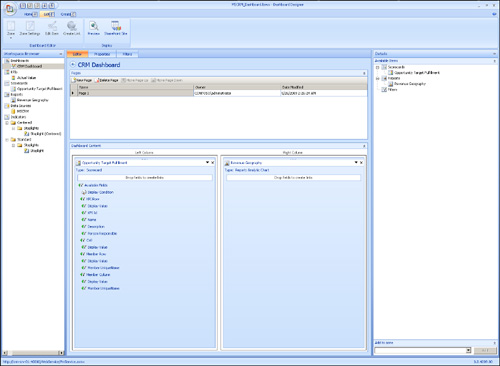
1. Right-click Dashboards, and then click New Dashboards.
2. Enter CRMDashboard as the dashboard name, and select the check box to grant read permissions to all authenticated users.
3. Drag and drop the reports from the Available Items windows into the Dashboard Editor (see Figure 6.26).
Figure 6.26 CRM dashboards, showing multiple reports.
4. Save and publish the dashboards.
Summary
In this chapter, we showed how to create a Microsoft SQL Server Analysis Services cube and how to build Microsoft SharePoint Server dashboards using the PerformancePoint Services engine.
