3 Intelligent Transport Systems and Traffic Management
Pranav Arora and Deepak Kumar Sharma
Contents
3.1.1 Basic Overview of Internal Transport Systems
3.1.2 History and Development of the System
3.2 Brief Introduction to Artificial Intelligence and Computer Vision
3.2.2.1 Supervised Machine Learning Algorithms
3.2.2.2 Unsupervised Machine Learning Algorithms
3.2.2.3 Reinforcement Machine Learning Algorithms
3.2.3 Supervised Machine Learning Algorithms
3.2.3.2 Types of Supervised Learning
3.3 Various Smart Transportation Models
3.3.1 Automated Self-Driving Cars
3.3.3 Automatic Number Plate Recognition
3.3.4.1 Working of the Fastag technology
3.4 An Ideal/Perfect Smart Transportation Model
3.5 Research and Project Ideas
3.5.1 Traffic Light Detection System
3.1 Introduction
3.1.1 Basic Overview of Internal Transport Systems
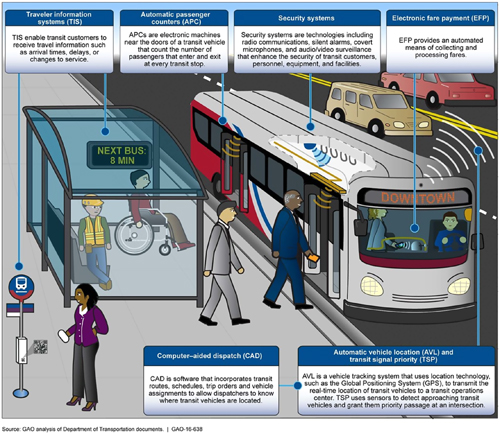
An intelligent transit/transport system (ITS) is a sophisticated system, the major objective of which is to produce innovative services with reference to completely alternative modes of transportation and management of traffic, and placing users higher up in the order of priority, and thus creating a safer, more coordinated, and more efficient use of the existing transport networks. These intelligent or smart transportation systems also differ in the techniques that are used, from a simple organizational system, like basic automotive navigation, to traffic light management systems, instrumental management systems, variable message signs, automatic recognition of number plates, or speed detection cameras to observe vehicles, with a system like security cameras, in the form of various CCTV systems, as well as the use of additional complex techniques that integrate live information and review from a variety of different sources, such as guided parking systems, live weather information, and reports of accidents nearby. One such system is Google Maps which guides us to our destination, showing us the correct route, and the predicted/expected time it will take for us to reach our destination.
Figure 3.1 shows a sample of an intelligent transport system, where all the components, such as the traffic lights and the car, communicate with one another, so as to make driving possible, with less congestion and far greater safety.

3.1.2 History and Development of the System
ITS systems began with the surveillance of the roads, to prevent accidents from happening and to promote a free flow of traffic. Earlier systems were funded by Governments and their agencies but, with the automation/machine learning age on its way, many private firms have stepped into this field in order to compete with each other and to create a sophisticated system. In addition to helping with the regular commute, ITS will also help in the mass evacuation of the population from localities in case of a major disaster, such as floods or a volcanic eruption.
However, one of the major advantages of ITS will still be tackling the problem of traffic. As the population continues to grow, we will see more people wanting to commute for jobs daily, for medical needs, etc. so we must also develop a good and efficient public transport system. The high-density population areas can also benefit from such a multimodal system, where the population commutes via walking, bicycles, motorcycles, buses, and trains, which will also help us to fight in this never-ending battle against pollution.
Figure 3.2 shows a system where the passengers can board the bus using just a quick response (QR) code, and the bus also communicates with other nearby vehicles for them to slow down as there may be pedestrians. Developing such a system could save us precious lives and also reduce human effort.
3.2 Brief Introduction to Artificial Intelligence and Computer Vision
3.2.1 Neural Networks
Neural networks (NN) are computer systems that are similar to and work like the biological neural networks, that constitute the brain of living individuals. Figure 3.3(a) shows a schematic way in which the neurons are present in a human brain. These kinds of system have the ability to learn and do certain tasks by taking examples, without being explicitly or specifically programmed with specific rules for the operation or the task. For example, in image recognition systems, the system will learn to identify and sort images that contain dogs by analyzing and processing the example images that have been manually categorized and segregated as “dog” or “no-dog” and fed in as input. By using the results, it can then be used to identify the presence of dogs in other images. They do this without any prior knowledge of dogs; instead, they automatically generate identifying characteristics from the examples that they process, such as identifying eyes, tails, etc. A neural network consists of multiple nodes that are connected to one other and which process independently but take information from the preceding node and pass it on to the succeeding node in the layer. Such a system, consisting of multiple layers of neural networks, is called a convolutional neural network (CNN). These kinds of neural networks have major applications in image classification, image and video recognition, natural language processing, and recommender systems, as well as in various medical image analysis systems.

Figure 3.3(a) shows a neural network. Figure 3.3(b) represents a three-structure layer neural network, where the input is fed to four initial inputs or starting nodes in the input layer and they process the information, which is then passed to five nodes in the hidden (also sometimes referred as the interior) layer and then finally passed to the layer or the node, in this case, that can be used to obtain the desired result. A simple example of a neural network is one that involves the use of logistic regression, where the input parameters are tuned with the help of an activation function, like RELU or SIGMOID activation functions. We will not go into depth about what and how to use these activation functions. You need only understand the mathematical meaning of the functions, where RELU means y = max (0, x) and SIGMOID means 1/(1+ex), which can be depicted in Figure 3.3, where Figure 3.3(c) represents and Figure 3.3(d) shows the mathematical plot of the respective equations.
3.2.2 Machine Learning
Machine learning is a way of achieving artificial intelligence (AI), which provides the system with the trait to automatically learn, improve, and rectify from past experience without being specifically programmed or instructed for it. The major focus is to let the machine learn automatically without any human help or intervention, and to adjust its actions with the help of the gathered data. Machine learning algorithms create a mathematical model that is based on sample input data, also known as training data, in order to make predictions or decisions without being explicitly programmed for that purpose. These algorithms rely on the patterns in the input data for the prediction or the output. These types of machine learning algorithms are used in a wide variety of applications, such as computer vision or filtering of emails, where it is not feasible or is too difficult to design a straightforward conventional style algorithm to perform the desired task effectively. As in conventional computer science, some algorithms are better at solving certain sets of problems; the same is the case with machine learning algorithms, where one performs better than the others for a set of problems.
Some major or commonly used machine learning (ML) algorithms are:
3.2.2.1 Supervised Machine Learning Algorithms
These types of ML algorithms can be applied from what has been learned in the past to a new, similar dataset, using labeled examples, to predict the outcome. The algorithm starts with the analysis of a known training dataset and then the learning algorithm produces a function that makes predictions about the output values. We will study more about supervised learning in the coming sections.
3.2.2.2 Unsupervised Machine Learning Algorithms
These types of algorithms are often used when the information that is used to train the model is neither classified nor labeled. This type of system does not predict the correct output, but, instead, it explores the datasets and draws inferences, based on the datasets, to find and depict the hidden structures in an unlabeled dataset.
3.2.2.3 Reinforcement Machine Learning Algorithms
This type of algorithm learns by interacting with its environment and, as a result, it performs some actions and obtains the error. This type of algorithm allows the machines to automatically find or obtain the ideal characteristic with respect to a specific context in order to improve the result. We do not need much information about this type of algorithm, hence it will not be discussed it further. For more in-depth details, the reader can refer to Ref. [3].
3.2.3 Supervised Machine Learning Algorithms
The definition of supervised machine learning algorithms has already been given in Section 3.2.2.1.
“Supervised” learning can be defined as a type of learning wherein the model is primarily trained on a predefined and detailed labeled dataset. When the model is provided with both input parameters and the corresponding output parameters, it is called a labeled dataset. In supervised learning, both the training dataset and the validation datasets (a validation dataset is also known as a test dataset) are labeled, as is illustrated in Figure 3.4(a).

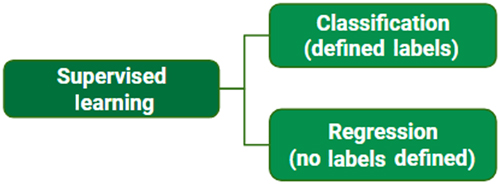
Figure 3.4(a) has a well-labeled dataset:
- i. This shows a dataset from a retail store, that is helpful at estimating and calculating whether a particular customer will buy a certain item that is under consideration, taking into account his/her gender, age, and salary.
- Input: Gender, age, salary of the customer.
- Result: Whether purchased or not is represented by numbers 0 and 1; 1 means the customer will buy the product and 0 means that the customer will not buy the product.
- ii. It is a meteorological dataset from a random location, which will serve the purpose of predicting the speed of the wind, based on other related parameters and indicators.
- Input: Temperature and pressure at the instant, dew point, relative humidity of the air, direction of the wind.
- Result: Speed of the wind.
3.2.3.1 Training the System
When the model is trained, the pre-acquired dataset is divided according to the ratio of 80:20, where 80% is utilized in the training data and the remaining 20% of the dataset is used to test the accuracy of the trained model. In the training data, we provide the model with both input and output. The model created gains perspective and derives logic only from the training data. By training, the model will try to build some kind of logic or thinking by itself and will then predict the output for the 20% which is provided as the test data.
Once the model is prepared and trained, it is then available for testing. When testing the model, the remaining 20% of the dataset is used as the input which the model has never encountered before, and the output is then compared against the actual output from the dataset which can then predict the accuracy of our model.
3.2.3.2 Types of Supervised Learning
Figure 3.4(b) shows the types of supervised learning:
- 1.Classification: A type of supervised learning where the result has a clear and defined value. For example, in Figure 3.4 (b), the result is that “bought” has a defined value i.e. (0 or 1), where 1 means it will be bought and 0 means it will not be bought. The aim or focus here is to estimate that the defined value belongs to a specific group and then the system is graded on the basis of its accuracy. Classification can also be of many types, such as a linear classification (also known as a binary classification) or a multi-class classification. In a linear classification, a model is trained to predict either 0 or 1, i.e., a binary value that is “yes” or “no” but, in the case of a multi-class classification, the model is trained to predict more than one class.
- 2.Regression: A type of supervised learning, where the output has a continuous value, say, a range or an ongoing number type of result. In the example in (Figure 3.5), the result is that the speed of the wind does not have any discrete or fixed value, but is continuous within a particular range. The main focus here is to find and calculate a value that is as close to the actual output value as our model can be and then evaluate the model by calculating the error value of the model. The smaller the error value of the model, the greater the precision of our regression model and thus the better the model. Figure 3.6 tells us, in a concise manner, about the different types of supervised learning [4].

3.2.4 Computer Vision
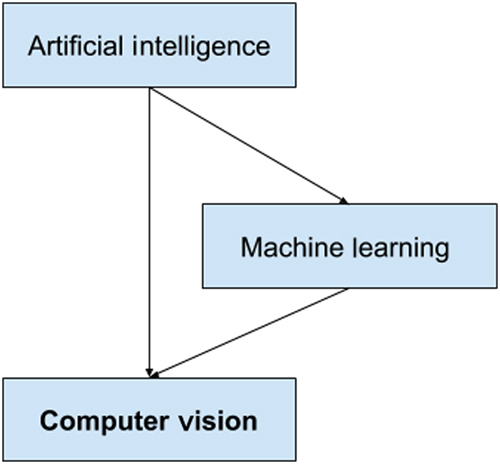
Computer vision is defined as the study that aims to develop ways to help computers with the ability to visualize and understand digital images in the form of photographs and videos. In terms of engineering, computer vision is the ability to automate tasks that a living visualizing system is able to perform. The main aim of a computer vision system is to be able to extract information from images. Computer vision is basically a subset of artificial intelligence, where we apply various kinds of machine learning algorithms to classify images in order to maximize the accuracy of our output in the form of a prediction. We see many examples of computer vision in our daily commuting lives, from the automated cruise control system in cars to automated parking and entry systems. Indeed, the field of computer science has revolutionized our ways to commute and will continue to do so in the future as well. Figure 3.7 shows us how computer vision is related to better-known terms like machine learning and artificial intelligence.

3.3 Various Smart Transportation Models
3.3.1 Automated Self-Driving Cars
A self-driving or autonomous car is a vehicle that is capable of sensing its nearby environment and moving on the road in a safe manner with no or negligible human input. Self-driving cars use various kinds of sensors to see or predict their surroundings, such as radar, GPS, sonar, odometry, speedometry, and various other inertial measuring devices. These vehicles are fitted with powerful computers, along with highly sophisticated AI algorithms, consisting of various ML algorithms and applied use of computer vision. The vehicles feed in the information, with the help of various sensors, and processes, in real time, all the scenarios that could possibly occur. The system calculates the speed of the nearby cars, as well as keeping a look-out for pedestrians, traffic signals, and road markings to create and follow a safe route. All control of the vehicle, from acceleration to braking and lane-keeping to turning is handled by the system. Driving safety experts and statisticians predict that once this self-driving car technology has become fully developed, accidents or collisions caused by human error, such as delayed reaction time caused by distraction or aggressive driving styles, will be significantly reduced. In addition to being safe, it will also allow us to travel at a much faster pace, thus reducing the daily commute times and hence making our lives more efficient. It will also provide access for people with disabilities who cannot themselves drive. Figure 3.8 depicts such a system where cars can communicate with one another.

Various levels of automation can operate in vehicles:
- Level 0: The computer system has zero or almost no control over the vehicle.
- Level 1: The computer system has the ability to maintain the speed of the car, but the driver must be in full control of the steering, braking and other aspects.
- Level 2: The computer system has the ability to steer the vehicle at low speeds and can also accelerate and brake, when required. The driver must pay complete attention in this case also and should be in a position to take over as and when prompted by the system.
- Level 3: The computer system, in this case, is in a semi-autonomous state, which means the system can control all the aspects of the car up to a certain speed that is around 60 kmph or 37 mph and requires almost no attention from the driver until that speed is reached.
- Level 4: The computer system, in this case, is in a highl autonomous state and requires no intervention from the driver other than in the case of any errors or incidents.
- Level 5: This computer system is the most sophisticated type, where there is no need for the driver to intervene in any case. The car, in this case, can exist without any pedals and can perform independently. We might see this system soon, in the driverless taxis of the future.
For more information regarding how autonomous cars came into play in the current scenario and their future, you can refer to “Autonomous Cars: Past, Present, and Future” by Keshav Bimbraw.
3.3.2 Smart Traffic Signals
The modern three-signal traffic light or signal was created in 1920 and the basic principles have remained the same, but the aspect that has changed is the application of AI in these systems, which, with the help of a sophisticated system, has started to revamp the conventional system. But the reality is that we are very far from achieving this goal, as only 3% of all the traffic signals in the USA are “smart”, despite having received heavy funding and research help from the Silicon Valley, with the majority of the traffic lights still working on basic timer-type systems.
Smart or intelligent traffic lights are a traffic system that mixes conventional traffic lights with an associated array of sensors and AI, to show intelligence route vehicles and to direct traffic. An ideal smarter traffic signal system will benefit not only the driver but also pedestrians and cyclists, and will also help to accommodate any changes in the weather that might occur.
One such system is Scalable Urban Traffic Control (SURTRAC) that was developed by researchers from Carnegie Mellon University (CMU). The system dynamically optimizes the traffic signals, hence improving the flow of traffic, leading to shorter waiting times, reduced traffic congestion, and ultimately less pollution.
For more details, the reader should refer to “SURTRAC: Scalable Urban Traffic Control” [4].
3.3.3 Automatic Number Plate Recognition
Automatic number plate recognition (ANPR) is a type of specialized training model that uses computer vision-inspired optical character recognition technology to identify the number plates of automobiles after taking/creating a temporary photographic image of them. This technique is used by federal protection forces around the world to detect individual vehicles and is also used for parking entry in certain localities. These systems use infrared sensors, along with special cameras to take a photograph of the vehicle.
The basic algorithm for such a system works in a way that it first finds the position of the number plate on the vehicle, selects that part, and then enhances the selected portion of that image to which it applies an optical character recognition (OCR) algorithm, keeping in mind the number plate regulations of that area/country. The reading of the number of plates is then used, according to the desired need.
The algorithm can be further defined in a more technical way as:
The 4 prominent steps in automatic recognition of number plates are
- (1) Preprocessing of the data
- (2) Finding the position of the number plate
- (3) Segmentation of individual characters
- (4) Recognition of individual characters [7]
For more details on how the algorithm of the system works, the reader is referred to Ref. [5].
3.3.4 Automated Toll Systems
Automated toll systems is a wireless system that automatically collects the toll fee that is charged to vehicles. The system is equipped with an automatic radio transponder-type device, and, as the vehicle moves past the toll reader device, a radio signal from the reader then triggers the equipped transponder device and transmits back the registration number or unique ID of the vehicle, and an electronic payment system associated with it charges the user the toll fee.
One of the major advantages of the system is that the driver does not need to stop, thus reducing traffic delays. It is also cheaper to maintain or run as it only involves a one-time investment of setting up the sensors, with no human labor being employed, thus reducing costs.
The beginnings of the system date back to 1959 when William Vickrey proposed the idea for a model for electronic tolling of the Washington Metropolitan Area. The testing of the prototypes began in the 1960s and soon more countries also began working on such a system, Italy becoming the first country to deploy the system on a large scale in 1989.
One such system is the FASTag system, an initiative of the Indian Government, to tackle the problem of ever-increasing traffic.
FASTag was introduced by the NHAI (National Highways Authority of India) to ease out and eventually replace the manual toll collection system on the National Highways.
FASTag was designed to enable cashless toll payments by using the RFID (radio frequency identification) technology. The amount for each transaction is directly withdrawn from the prepaid account linked with it.
3.3.4.1 Working of the Fastag technology
The FASTag allows the user to quickly pass through toll plazas and helps the user to avoid congested traffic lanes formed as a result of traditionally slow toll collection systems. The tag is affixed to the windscreen of the vehicle and is issued by a certified bank. They are prepaid in nature and hence need to be recharged by issuing a payment either through cheque or from among a plethora of online options such as Credit Card/Debit Card/NEFT/RTGS. To make the entire transition hassle-free, toll plazas will be equipped with dedicated lanes which will be distinctly marked, and the FASTag logo will be displayed at least 70 m before the toll plaza, so that the driver is able to steer the vehicle to the correct lane. The tag reader placed at every such lane will validate your payment and the required amount will be debited from your account, allowing you rapid and successful passage.
The FASTag has numerous benefits over the existing mechanism, a few of them being:
- Reduces time and fuel consumption: As the transaction is cashless, there is no need to stop at the booth and pay the toll. The tag reader at the plaza will automatically withdraw the funds from your prepaid recharged amount as and when the vehicle passes through the toll plaza.
- Transaction alerts: Whenever the transaction is taken from the account, the FASTag user will receive an SMS, alerting them of the same. This step eliminates the fear of misuse and enhances customer safety in this whole mechanism. This also ensures that the user is aware of his account balance and of corresponding withdrawals.
- Online recharge: Vouching for a complete cashless mode, the recharge for the FASTag account can also be carried out online through e-banking or Debit/Credit card.
- Eliminating the need for cash: Shortage of smaller denomination coins/notes during a toll payment hinders the smooth process and unnecessarily takes up time. With the FASTag system, the user does not have to worry about carrying cash around.
- User-friendly web portal: To regularly check their expenditure at the toll booth, the customers can view their statements by logging on to the customer portal.
3.4 An Ideal/Perfect Smart Transportation Model
The system incorporates aspects of all the other systems that have been mentioned before to create a seamless end- experience for the user. The basic outline of the system that is being proposed is that almost no human control is required. We shall now discuss what the system actually is.
We have to move from point A (starting place of the person, assuming it to be the home) to point B (destination of the person, assuming it to be the office). The car arrives at the starting place (origin). The person then sits in the car and the car confirms where the destination, if it is a regular destination. After an affirmative response, the car begins to move, the gates of the compound/locality open automatically on seeing the recognized vehicle approach and register that a vehicle is leaving. The vehicle proceeds in the desired direction while being aware of other vehicles and following the traffic signs, that dynamically adjust on determining the number of vehicles that approach it. The vehicle reaches the destination, where the gates automatically open to allow the vehicle inside after recognizing it, and then the vehicle drops the person at the office gate and thereafter goes to the parking lot to park itself. The same operations then happen in the reverse order at the end of the day, so as to return the user to point A from point B.
Figure 3.5 summarizes all the functions in a straightforward manner and also provides an idea about how the system is supposed to work.
3.5 Research and Project Ideas
3.5.1 Traffic Light Detection System
One of the most basic tasks one can perform is to let the vehicle identify the traffic signal that is being displayed. The machine will identify the signal and pass on the corresponding instruction regarding that signal, like ‘stop’ for red, and so on (Figure 3.6).
Figure 3.6 shows the different signals with respect to the standard color positioning of the signal. As in diagram 1 the uppermost light is different from the other two, indicating that it is illuminated, so, as per the standard convention, this means that it is the red light, which means ‘stop’. Similarly, in diagram 2, the lowermost light is different, indicating that it is the green light, which means ‘go’, whereas in diagram 3 the middle light is different, indicating that it is the orange light, which means ‘proceed with caution’
We can thus create a system that helps us to identify the traffic light in any given scenario. This problem can be solved using basic computer vision techniques that you might have already learned. The dataset for the given problem can be accessed at https://www.kaggle.com/mbornoe/lisa-traffic-light-dataset/kernels or https://hci.iwr.uni-heidelberg.de/node/6132 can also be used. For more information and details, please refer to the references [7–9].
Bibliography
- 1. Gosavi, Abhijit (2009). Reinforcement Learning: A Tutorial Survey and Recent Advances. INFORMS Journal on Computing 21(2), 178–192. doi:10.1287/ijoc.1080.0305. https://www.researchgate.net/publication/220668953_Reinforcement_Learning_A_Tutorial_Survey_and_Recent_Advances.
- 2. GeeksforGeeks, M.L. Types of Learning – Supervised Learning. https://www.geeksforgeeks.org/ml-types-learning-supervised-learning/.
- 3. Bimbraw, Keshav. Autonomous Cars: Past, Present, and Future - A Review of the Developments in the Last Century, the Present Scenario and the Expected Future of Autonomous Vehicle Technology. In: ICINCO 2015 - 12th International Conference on Informatics in Control, Automation, and Robotics, Proceedings, vol. 1, pp. 191–198. doi:10.5220/0005540501910198.
- 4. Smith, Stephen F., Gregory J. Barlow, Xiao-Feng Xie, Zachary B. Rubinstein . SURTRAC: Scalable Urban Traffic Control. [email protected], https://www.ri.cmu.edu/pub_files/2013/1/13-0315.pdf.
- 5. Automatic Number Plate Recognition System, Amr Badr, Mohamed M. Abdelwahab, Ahmed M. Thabet, Ahmed M. Abdelsadek . http://inf.ucv.ro/~ami/index.php/ami/article/viewFile/388/351.
- 6. FASTag. http://www.fastag.org/.
- 7. Bhardwaj, K.K., A. Khanna, D.K. Sharma, A. Chhabra . (2019). Designing Energy-Efficient IoT-Based Intelligent Transport System: Need, Architecture, Characteristics, Challenges, and Applications. In: Mittal M., Tanwar S., Agarwal B., Goyal L. (eds) Energy Conservation for IoT Devices. Studies in Systems, Decision and Control, vol. 206, Springer, Singapore, 209–233.
- 8. Khanna, A., S. Arora, A. Chhabra, K.K. Bhardwaj, D.K. Sharma . (2019). Iot Architecture for Preventive Energy Conservation of Smart Buildings. In: Mittal M., Tanwar S., Agarwal B., Goyal L. (eds) Energy Conservation for IoT Devices. Studies in Systems, Decision and Control, vol. 206, Springer, Singapore, 179–208.
- 9. Singh, A., U. Sinha, D.K. Sharma, (2020). Cloud-Based IoT Architecture in Green Buildings. In: Green Building Management and Smart Automation, IGI Global, Pennsylvania, 164–183.
- 10. Dandala, T.T., V. Krishnamurthy, R. Alwan . (2017). Internet of Vehicles (Iov) for Traffic Management. In: International Conference on Computer, Communication and Signal Processing (ICCCSP). doi:10.1109/icccsp.2017.7944096.
- 11. Environmentally Beneficial Intelligent Transportation Systems (Apr 2016). https://www.sciencedirect.com/science/article/pii/S1474667016318171.
- 12. Hult, R., G.R. Campos, E. Steinmetz, L. Hammarstrand, P. Falcone, H. Wymeersch, (2016). Coordination of Cooperative Autonomous Vehicles: Toward Safer and More Efficient Road Transportation. IEEE Signal Processing Magazine 33(6), 74–84. doi:10.1109/msp.2016.2602005.
- 13. Moloisane, N.R., R. Malekian, D. Capeska Bogatinoska . (2017). Wireless Machine-to-Machine Communication for Intelligent Transportation Systems: Internet of Vehicles and Vehicle to Grid. In: 2017 40th International Convention on Information and Communication Technology, Electronics and Microelectronics (MIPRO). HYPERLINK "http://example.com?ids=8quot; doi:10.23919/mipro.2017.7973459.