
6 Scenario analysis
Since the global financial crisis of 2008, banks have increasingly used scenario analysis. Certain financial supervisors, such as the Bank of England, have been requiring banks to use this analytical tool to evaluate how specific scenarios would impact the assets in their investment portfolios. Financial supervisors themselves have also used this analytical tool to evaluate banks operating within their jurisdiction. The general purpose of this has been to determine whether a major financial crisis, such as the economic conditions associated with a severe recession, would adversely impact a bank’s ability to satisfy its capital obligations with respect to its lending or face insolvency. Insurers have also been using scenario analysis to evaluate their ability to pay insurance claims made on premiums (Dent, Westwood, and Segoviano 2016).
Scenario analysis is one of the global financial community’s most sophisticated analytical tools for evaluating financial risks. This tool is now being used to identify future carbon risks and green finance opportunities. Scenarios used in analyzing assets for transition risks are directly or indirectly based on energy technology deployments and other activities deemed necessary in order to achieve greenhouse budgets connected with temperature targets. The creation of these scenarios has been made possible through advancements with monitoring greenhouse gases and determining their global warming potential, both with respect to the development of an overall budget and with respect to identifying the emissions associated with different sectors of the economy. Scenarios used in analyzing assets for physical risks tend to be based on emissions trajectories, which efforts to monitor greenhouse gases have made possible. The ability to analyze companies’ investment portfolios and provide guidance on future action is the result of advancement with tracking investments, in particular with linking securities to fossil fuel and sustainable classifications (IEA 2018; Greenpeace n.d.; IREA n.d.; PRI n.d.b).
6.1 Transition risks
As a tool already used in the financial sector for other purposes, the TCFD recommended using scenario analysis to test climate scenarios on assets under management as a principal means for evaluating carbon risks, in particular for transition risks associated with a shift to a low-carbon economy. In addition to having significant credibility because of its already existing application, the use of scenario analysis has garnered much positive attention. This is because it allows for analysis that has not been possible with other analytical tools. In particular, scenario analysis allows for forward-looking analysis, whereas other analytical tools assess currently available information. Conducting forward-looking analysis is crucial because although the climate is currently impacting markets and properties, some of the most significant changes in the global economy and with property are not expected to take place until the future. Researchers further believe that it is important to evaluate these changes in order to plan for them.
Following the TCFD recommendations, companies are increasingly running climate-related scenario analysis tests on the assets in investment portfolios. The most common of these tests help companies determine the exposure of their assets to a transition away from fossil fuel investments toward sustainable investments. According to the TCFD:
Also, according to the TCFD, the International Energy Agency (IEA) energy technology deployments scenarios are the scenarios that are typically used to evaluate transition risks (TCFD 2017a, 12). The IEA has been using a World Energy Model to make energy projections for decades. Updated every year, the model is composed of three primary modules: final energy consumption; energy transformation, including power generation and heat; and energy supply. The IEA has used the World Energy Model to generate sector-by-sector and region-by-region energy technology deployment scenarios (IEA 2018).
Initial energy technology deployment scenarios that were made by the IEA included its 450 Scenario, New Policies Scenario, and Current Policies Scenario. The IEA’s 450 Scenario identifies how the IEA believes energy technologies should be deployed in order to limit global warming to 2 degrees Celsius. The IEA’s New Policies Scenario identifies how the IEA believes energy technologies will be deployed if all new policies set out in Nationally Determined Contributions are implemented to meet countries commitments under the Paris Agreement. The IEA’s Current Policies Scenario identifies how the IEA believes technologies will be deployed with business as usual without new climate policies (IEA 2018; PRI n.d.b; Bolton et al. 2020, 36–41). The initial IEA energy technology deployment scenarios, which continue to be updated over time, are shown in Table 6.1.
As international climate objectives and social preferences have continued to advance, the IEA has also created supplemental energy technology deployment scenarios. This includes the IEA’s Sustainable Development Scenario, which shows the energy technologies that should be deployed by 2050 in order to reach a fifty percent probability of limiting global warming to 2 degrees Celsius, but the scenario also incorporates social responsibility factors when deciding on the appropriate deployment of energy technologies. This also includes the IEA’s Beyond 2 Degrees Scenario, which reflects the interest in below 2 degrees Celsius modeling following the IPCC and United States National Climate Assessment reports that stressed the need to achieve the below 2 degrees goals of the Paris Agreement, rather than simply 2 degrees Celsius targets. It is more difficult for the investment portfolios of companies to be aligned with this scenario, as it requires more aggressive deployment of sustainable energy technologies (IEA 2018; CDI and 2DII 2018, 28–29). With a current emphasis on achieving a 1.5 degrees Celsius target, the use of below 2 degrees Celsius scenarios is likely to increase moving forward. See Table 6.2.
| IEA’s 450 Scenario | The International Energy Agency’s 450 Scenario identifies how the International Energy Agency believes energy technologies should be deployed in order to limit global warming to 2 degrees Celsius. |
| IEA’s New Policies Scenario | The International Energy Agency’s New Policies Scenario identifies how the International Energy Agency believes energy technologies will be deployed if all new policies set out in Nationally Determined Contributions are implemented to meet countries’ commitments under the Paris Agreement. |
| IEA’s Current Policies Scenario | The International Energy Agency’s Current Policies Scenario identifies how the International Energy Agency believes technologies will be deployed with business as usual without new climate policies. |
Additional scenarios exist, too, such as Greenpeace’s Advanced Energy [R]evolution and the International Renewable Energy Agency’s REmap scenarios. Use of these scenarios could be desired for various reasons but predominantly because a user may wish to examine the impact of a scenario that makes different assumptions about how energy technology deployment will develop moving forward. For instance, while the IEA scenarios are the result of significant consultation efforts, they rely on assumptions for energy projections decades into the future, which could be contested. In particular, the IEA has historically assumed a significant amount of nuclear power and carbon capture and storage deployment in their scenarios. However, other scenarios may not have been constructed with the belief that nuclear power will be used in the future because of regulatory practices or consumer interests, especially outside of regions that are not already heavily invested in the technology. Likewise, other scenarios may not have been constructed with the belief that carbon capture and storage will offer promising emissions reductions moving forward. Greenpeace’s Advanced Energy [R]evolution scenario, for instance, does not take into account either nuclear power or carbon capture and storage and shows what needs to be achieved in order to reach a fully decarbonized energy system by 2050 (Greenpeace n.d.; PRI n.d.b). International Renewable Energy Agency’s REmap envisions an energy sector that rapidly transitions to clean technology, with a doubling of the share of energy coming from renewable sources by 2030 (IREA n.d.; PRI n.d.b). It will likely be more difficult for companies to be aligned with Paris Agreement objectives when comparing their investment portfolios to Greenpeace’s Advanced Energy [R]evolution pathways in comparison to IEA pathways. Alignment with International Renewable Energy Agency’s REmap scenario is also likely to be more difficult unless a company is heavily invested in renewable energy. See Table 6.3.
| IEA’s Sustainable Development Scenario | The International Energy Agency’s Sustainable Development Scenario identifies how the International Energy Agency believes energy technologies should be deployed in order to limit global warming to 2 degrees Celsius while taking into account social responsibility factors. |
| IEA’s Beyond 2 Degrees Scenario | The International Energy Agency’s Beyond 2 Degrees Scenario identifies how the International Energy Agency believes that energy technologies should be deployed in order to limit global warming to 1.75 degrees Celsius. |
| Greenpeace’s Advanced Energy [R]evolution | Greenpeace’s Advanced Energy [R]evolution envisions a fully decarbonized energy system. |
| International Renewable Energy Agency’s REmap | International Renewable Energy Agency’s REmap envisions a rapid doubling of the renewable energy share of the world’s energy mix. |
6.1.1 Energy transition
Today, a number of financial supervisors are using scenario analysis to evaluate transition risks, including the Bank of England, the Bank of France, and the Dutch Bank (Bank of England 2019; Bank of France 2020; Vermeulen et al. 2018, 2019; NGFS 2020). Initial widescale application of transition risk scenario analysis on assets in investment portfolios took place in 2017 and 2018. In 2017 and 2018, the Swiss and Californian governments conducted extensive analyses of the investment portfolios of companies operating in their jurisdictions using the Paris Agreement Capital Transition Assessment (PACTA) scenario analysis tool developed by 2 Degrees Investing Initiative with funding from the European Union. The Swiss Ministry of Environment and 2 Degrees Investing Initiative effort offered the tool to all Swiss pension funds and insurers to test the climate alignment of their equity and corporate bond portfolios on a voluntary basis. It was possible to analyze two-thirds of the assets under management (2DII 2017; Thomä and Chenet 2019) and in doing so identify potential transition risks in portfolios. The California Department of Insurance worked with 2 Degrees Investing Initiative to apply the tool to investment portfolios of several hundred of the largest insurers operating in California and identified potential transition risks there. The analysis specifically assessed whether investments were aligned with emissions pathways consistent with holding the increase in global average temperature to 2 degrees Celsius above preindustrial levels (CDI and 2DII 2018, 12–17).
The PACTA tool allows a company or other organization to measure, monitor, and address the alignment of an investment portfolio with climate objectives (2DII n.d.c). This type of tool is an energy transition scenario analysis tool where securities in companies’ investment portfolios are matched against energy technology deployment needed to meet desired temperature targets for specified dates. An energy transition scenario analysis tool uses climate scenarios such as those developed by the IEA. The IEA, for instance, develops energy transition scenarios by making global projections for energy technology deployment through assembling information from national and subnational energy regulatory plans. The scenarios can be further calibrated for global market or regional market designations, such as the countries making up the Organization for Economic Co-operation and Development (OECD) (CDI n.d.).
For the initial analysis that the California Department of Insurance and 2 Degrees Investing Initiative performed with the PACTA tool, the energy technology deployment plans that were used were made by the IEA and included its 450 Scenario, New Policies Scenario, and Current Policies Scenario. The IEA’s 450 Scenario, the most stringent scenario, was used here to show how energy technologies should be deployed by 2050 in order to reach a fifty percent probability of limiting global warming to 2 degrees Celsius. The IEA’s New Policies Scenario, a more moderate scenario identifying how the IEA believes energy technologies will be deployed if all new policies set out in Nationally Determined Contributions are implemented to meet countries commitments under the Paris Agreement, was used here to show how energy technologies should be deployed by 2050 in order to reach a fifty percent probability of limiting global warming in accordance with Nationally Determine Contributions. The IEA’s Current Policies Scenario, the least stringent scenario identifying how the International Energy Agency believes technologies will be deployed with business as usual without new climate policies, was used here to show how energy technologies should be deployed by 2050 in order to reach a fifty percent probability of limiting global warming in accordance with business as usual (CDI and 2DII 2018, 24–25). The scenarios were calibrated for OECD countries, which is where the insurers and most of the companies that they have been invested in are based (CDI n.d.).
Pathways for the IEA scenarios were mapped out on a chart over a five-year span. There is green shading below the IEA’s 450 Scenario pathway that identifies an area where there is likely alignment with 2 degrees Celsius energy technology deployment when analyzing fossil fuel enterprises. There is light yellow shading between the IEA’s 450 Scenario and the IEA’s New Policies Scenario pathways that identifies an area where there is likely some misalignment with 2 degrees Celsius energy technology deployment and instead likely alignment with 2 degrees Celsius energy technology deployment to Nationally Determined Contributions energy technology deployment. There is dark yellow shading between the IEA’s New Policies Scenario and the IEA’s Current Policies Scenario pathways that identifies an area where there is also likely some misalignment with the 2 degrees Celsius energy technology deployment and instead likely alignment with Nationally Determined Contributions energy technology deployment to business-as-usual energy technology deployment. Further, there is red shading above the IEA’s Current Policies Scenario that identifies an area where there is likely significant misalignment with 2 degrees Celsius energy technology deployment and instead likely alignment with beyond business-as-usual energy technology deployment (CDI and 2DII 2018, 14–17).
The PACTA tool takes into account a company’s inputs of both equity and debt investments and uses that information to generate a comprehensive report consisting of several dozen pages. The report evaluates alignment for several industry sectors, such as coal, oil, gas, utilities generating electric power, renewable energy, and transportation. For each sector, there is a line for equity and debt investments that shows the trajectory of those investments over the five-year time horizon against the green, light yellow, dark yellow, and red background. Again, when a line is in a green area, this indicates that a company’s investments are likely aligned with energy technology deployment necessary to limit temperature increases to 2 degrees Celsius. When the line is in a light or dark yellow area, this indicates that a company’s investments are likely somewhat in misalignment with energy technology deployment necessary to limit temperature increases to 2 degrees Celsius, to varying amounts. When a line is in a red area, this indicates that a company’s investments are likely significantly misaligned with energy technology deployment necessary to limit temperature increases to 2 degrees Celsius (CDI and 2DII 2018, 14–17).
Figure 6.1 shows a sample of investment portfolio trajectories transposed on pathway data. Here the solid line represents aggregate capacity for equity within the investment portfolios of insurers operating in California. Figure 6.1 specifically examines the trajectory of investments in utilities operating on the burning of thermal coal.
Because the solid line representing the trajectory of the equity within the investment portfolios falls within the red area, which in the grayscale reproduction here appears as a dark gray area at the top of the figure, this shows that these investments are likely significantly misaligned with the energy technology deployment necessary to limit temperature increases to 2 degrees Celsius. In order for investments in these utilities to be aligned with energy technology deployment necessary to limit temperature increases to 2 degrees Celsius and for the line representing the trajectory of the equity within the investment portfolios to therefore fall in the green area, which in the grayscale reproduction here appears as a lighter gray area at the bottom of the figure, the utilities that are being invested in would need to massively retire coal power plants (CDI and 2DII 2018, 15; Mills et al. 2018, 27–29).

Figure 6.1Utilities Generating Electricity From Coal
Source: 2 Degrees Investing Initiative
While findings varied across companies, published aggregate data indicated that overall, there was concern that too much money was being invested in certain fossil fuel industries such as thermal coal and not enough in renewable energy or other clean energy technologies. On a positive note, insurer equity and debt investments were better aligned with a 2 degrees Celsius scenario than the market as a whole. Moreover, there was not significant misalignment with oil and gas production (CDI and 2DII 2018, 15; Piotrowski 2018).
While aggregate information released by the Swiss and Californian governments did not reveal security information, specific asset risk information was provided confidentially in individual reports that were provided directly to companies. These individual reports showed sectors where companies were most exposed to transition risks with charts specifically tailored to the investment trajectories of individual companies (CDI and 2DII 2018, 12–19; Piotrowski 2018). Moreover, at the end of reports, investment information was provided that identified specific securities that are most adversely impacting the investment trajectories of individual companies, that is, pushing an investment trajectory line into a yellow or red area (CDI and 2DII 2018, 20–21). This information could be used by companies to align their portfolios with the objectives of the Paris Agreement and for French Energy Transition Law or TCFD reporting.
The PACTA tool can also use other scenarios that have been developed as international climate objectives and social preferences have changed over time or been adjusted to reflect updated scientific research. For example, the California Department of Insurance and 2 Degrees Investing Initiative decided to apply the IEA’s Sustainable Development Scenario when applying the PACTA tool to the investment portfolios of insurers in a subsequent year of analysis rather than the IEA’s 450 Scenario (CDI and 2DII 2018, 28–29; CDI n.d.). The California Department of Insurance and 2 Degrees Investing Initiative also added the IEA’s Beyond 2 Degrees Scenario when applying the PACTA tool to the investment portfolios of insurers in the subsequent year of analysis. In this subsequent analysis, the California Department of Insurance and 2 Degrees Investing Initiative continued to use the IEA’s New Policies Scenario and the IEA’s Current Policies Scenarios. However, when this analysis was conducted, temperature projections associated with these scenarios had decreased (CDI and 2DII 2018, 28–29; CDI n.d.).
2 Degrees Investing Initiative launched a free-to-use online version of the PACTA tool. The tool allows analysis of exposure in transition risks in equity and debt investments within portfolios over multiple scenarios (PRI n.d.a). This allows users to manipulate criteria such as temperature targets or energy technology deployments for achieving those targets. It also allows for applying additional scenarios, such as Greenpeace’s Advanced Energy [R]evolution and the International Renewable Energy Agency’s REmap scenarios.
Application of the PACTA tool has grown. 2 Degrees Investing Initiative now has had over a thousand companies upload their investment portfolio into the free-to-use online version of its tool (2DII n.d.c). The PACTA tool also became one of the tools for the Climate Action 100+, which is used by investors to influence more than a hundred of the largest emitters of greenhouse gases (Climate Action 100+ 2019, 76). ING launched Terra, which uses PACTA technology to evaluate the ING’s investment portfolio’s exposure to transition risks (ING 2020). The European Insurance and Occupational Pensions Authority has been using PACTA to examine the portfolios of European insurers (2DII n.d.b). The Swiss Ministry of Environment is also using PACTA for an updated scenario analysis effort that includes participants from additional sectors, such as banking, and covers more types of assets (2DII n.d.a).
A transition risk tool that uses energy transition scenarios allows for the analysis of a significant range of scenarios, providing a user with a great degree of flexibility in analyzing assets under management. An energy transition scenario can also inform policy decisions on the best approaches to managing energy consumption moving forward with respect to decisions on deployment of energy technologies as a share of the energy mix in short-, medium-, and long-term timeframes. Following the signing of the Paris Agreement, 2 degrees Celsius was a target that was often used, as it was decided that a more than 2 degrees Celsius rise would lead to catastrophic carbon risks. The California Department of Insurance and 2 Degrees Investing Initiative used several scenarios when initially applying the PACTA tool, with an emphasis on the IEA’s 450 Scenario looking at limiting global warming to 2 degrees Celsius. This was the most widely used transition risk scenario at the time (CDI and 2DII 2018, 24), as the world was focused on achieving the Paris Agreement objective of limiting global temperature rise to no more than 2 degrees Celsius above preindustrial levels. However, following the IPCC and United States National Climate Assessment’s recent bleak assessments of climate change impacts, now 1.5 degrees Celsius is becoming a widely accepted target. There has also been a push to include the management of additional socially responsible investment standards with the management of environmentally responsible standards. This has been reflected in an expansion in the capabilities of transition risk scenario analysis tools. Therefore, these tools, like those used for the subsequent California Department of Insurance and 2 Degrees Investing Initiative scenario analysis, are able to incorporate the IEA’s Beyond 2 Degrees and Sustainable Development scenarios. There is also increased debate over the appropriate energy technology deployment projections, with some projections taking into account nuclear energy and carbon capture and storage and others not doing so.
6.1.2 Warming potential
Another type of transition risk tool that has evolved is the warming potential scenario analysis tool. This tool compares the global warming potential of securities in a company’s investment portfolio against total greenhouse gas emissions allowable in order to reach specified temperature targets. Carbon Delta offers a warming potential tool called Climate Value-at-Risk that operates in the following manner. To begin with, Scope 1 and Scope 2 greenhouse gas budgets are established for each sector and for companies within those sectors. These budgets are based on projections necessary to achieve certain temperature targets. Carbon Delta then determines necessary emissions reductions for companies at the facility level in order to meet these budgets, using a proprietary database of over twenty thousand publicly-listed companies covering equity and debt for over tens of thousands of securities (MSCI and Carbon Delta 2019).
Carbon Delta’s tool is available commercially on a subscription or project basis (MSCI and Carbon Delta 2019). In a TCFD and French Energy Transition Law report, AXA stated that it is examining using Carbon Delta’s tool to measure the position of its portfolio versus a 2 degrees Celsius target (AXA 2018, 8–11). AXA is now using Carbon Delta’s tool to test climate scenarios, including a 1.5 degrees Celsius scenario, on the value of its investments (AXA 2020, 16). MSCI, one of the world’s largest data providers, recently acquired Carbon Delta (MSCI n.d.).
A warming potential scenario analysis tool provides some unique capabilities when assessing climate change specific to the operations of individual companies. In particular, such a tool could eventually incorporate Scope 3 emissions, providing the opportunity to examine supply chain contributions in ways that other tools are not built to easily do. Such tools also provide unique challenges, though. Challenges include, for instance, how reliable and comparable greenhouse gas measurements are and whether the information is independently verified. Right now, there are possible gaps in coverage, as there are not a lot of independently verified carbon footprints for all emissions scopes, but coverage is likely to increase over time.
6.1.3 Carbon price
Another type of transition risk scenario analysis tool that has evolved is the carbon price scenario analysis tool. Trucost, which is now part of S&P Global (Mattison 2018), has developed a carbon price scenario analysis tool called Carbon Earnings At Risk. According to research cited by Trucost, significantly increased carbon pricing will be necessary in order to address climate change, a several-fold increase to over one hundred dollars per ton of CO2 (Trucost and S&P Global 2019a, 2019b, 2019c).
Carbon Earnings At Risk compares the potential implementation of carbon price mechanisms to companies’ investment portfolios based on the potential application of carbon price mechanisms in specific regions where companies in the portfolio are located and on expected carbon emissions for these companies over time. To achieve this aim, Trucost has developed several scenarios that can be applied to companies’ investment portfolios to evaluate the impact of an increase in carbon pricing. Using a database of present and potential carbon pricing mechanisms, such as carbon taxes and emissions trading systems, Trucost has developed scenarios that include projected carbon pricing mechanisms needed to achieve temperature projections connected with the IEA’s 450 Scenario and the New Policies Scenario. Trucost has also developed a database of greenhouse gas emissions associated with particular securities using publicly available greenhouse gas data provided to CDP (Trucost and S&P Global 2019a, 2019b, 2019c).
A growing number of companies are reporting to CDP that they are pricing carbon internally to evaluate their own operations (Trucost and S&P Global 2019a, 2019b, 2019c). Along these lines, this tool allows investors to evaluate the impact of carbon price increases on their portfolio of investments. As application of the tool is centered around specific regulatory actions, such as the pricing of carbon through further implementation of carbon taxes or emissions trading systems, a carbon price tool can inform a company of impacts that are likely to occur if a large policy decision is made on pricing carbon and also inform policymakers on the impact of such a decision.
6.1.4 Capex
In addition to transition risk scenario analysis that examines transition risks on investments, there are models that look at transition risks with fossil fuel reserves, in particular for extensions to existing projects or for new projects where there has not been a final investment decision. A prominent transition risk tool that provides this type of analysis is the 2 Degrees of Separation tool developed by Carbon Tracker and PRI. This tool looks at the upstream risks to the oil and gas sectors and oil and gas companies and projects. It can be used to determine whether companies are highly exposed to transition risks based on capital expenditures or capex necessary to exploit their oil and gas reserves. The general premise of the tool is that not all oil and gas companies are equally positioned for a transition to a low-carbon economy. A company is not aligned with the Paris Agreement objectives if it plans to exploit reserves in excess of emissions limits necessary to achieve these objectives. Exploitation of these reserves is also not necessarily financially viable unless the market price of oil and gas is exceedingly high. Companies with reserves that have a high extraction cost should be advised that a restriction on the use of oil and gas and related or unrelated decreases in consumer demand will most adversely impact those companies with the highest extraction cost for oil and gas reserves, whereas companies with lower extraction costs for oil and gas reserves will still be viable, at least in the near term (Leaton and Grant 2017).
When the 2 Degrees of Separation tool launched in 2017, the tool used the IEA’s 450 Scenario to evaluate oil and gas sectors and oil and gas companies and projects. In particular, the tool developed oil and gas carbon budgets for 2017 to 2035 using the IEA’s 450 Scenario as a proxy for Paris Agreement objective of limiting average global temperature to no more than a 2 degrees Celsius increase above preindustrial levels. This allows the tool to identify the use of fossil fuels that will produce no more than a set limit of carbon dioxide emissions, split fifty-nine percent for oil and forty-one percent for gas. By plotting a vertical carbon budget line on a supply cost curve chart, limits for both oil and gas can be compared to a business-as-usual supply cost curve sourced from industry data. The supply cost curve to the left of a vertical carbon budget line is perceived as within the 2 degrees Celsius budget, the supply cost curve to the right of a vertical carbon budget line is perceived as outside the 2 degrees Celsius budget, and connected projects are viewed as involving capex that should not be deployed if the world were to align with the Paris Agreement objectives (Leaton and Grant 2017, 15–17).
The tool provides sectorwide and company- and project-specific information. Overall, for the oil and gas sectors, the tool determined that 2.3 trillion dollars, or approximately one-third of potential capex to 2025, should not be deployed if the world were to align with the Paris Agreement objectives (Leaton and Grant 2017, 5, 19–22, 25). Figure 6.2 shows the application of the 2 Degrees of Separation tool for the oil sector. The supply cost curve to the left of the vertical oil emissions budget line is perceived as within the 2 degrees Celsius budget, the supply cost curve to the right of the vertical oil emissions budget line is perceived as outside the 2 degrees Celsius budget, and connected projects are viewed as involving capex that should not be deployed if the world were to align with the Paris Agreement objectives. Projects to the right of the vertical emissions budget line, on the steeper side of the supply cost curve, include oil sands or certain deepwater projects. Typically, the highest-costing projects are also the most carbon-intense projects (Leaton and Grant 2017, 19).
The tool also was used to generate a list showing the percentage of total available capex opportunities for specific oil and gas companies’ potential projects. The companies with the least capex outside of the 2 degrees Celsius budget were viewed as facing the least risk if the world were to align with the Paris Agreement objectives. On the other hand, those with the most capex outside the 2 degrees Celsius budget were viewed as facing the most risk (Leaton and Grant 2017, 26–29).
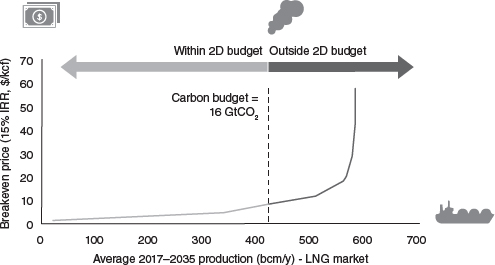
Figure 6.2Oil Production Cost Curve
Source: Carbon Tracker. This image was viewable on July 25, 2020, on the following Carbon Tracker website: www.carbontracker.org/reports/2-degrees-of-separation-transition-risk-for-oil-and-gas-in-a-low-carbon-world-2/
In 2019, additional work with the 2 Degrees of Separation tool applied the IEA’s New Policies Scenario, an updated IEA’s Sustainable Development Scenario and an IEA’s Beyond 2 Degrees Scenario on the oil and gas sectors for years 2019 to 2030. Under the IEA’s New Policies Scenario, the tool does not identify a risk of stranding capital expenditures. However, under an updated IEA’s Sustainable Development Scenario, the tool identifies a risk that sixty percent of capital expenditures will be stranded. Further, under an IEA’s Beyond 2 Degrees Scenario, the tool identifies a risk that eighty-three percent of capital expenditures will be stranded. The tool further identifies oil and gas companies that are invested in nineteen major projects that are not aligned with the IEA’s Sustainable Development Scenario. According to the tool’s application, there is fifty billion dollars of investment in these nineteen major projects that are inconsistent with a Sustainable Development Scenario pathway (Carbon Tracker 2019). Carbon Tracker and PRI have made 2 Degrees of Separation reports public and have provided additional analytical resources to PRI signatories (PRI n.d.b).
The capex scenario analysis tool provides useful information to a number of parties. For fossil fuel companies, the tool can help inform companies on the most cost-effective reserves to exploit and whether additional exploration is desirable. The tool can help investors understand which companies are most exposed to a transition to a low-carbon economy. The tool can also help policymakers understand the supply cost pressures on fossil fuel companies when balancing other considerations such as geopolitical and environmental concerns.
6.1.5 Comparing tools
There are a number of different types of transition risk scenario analysis tools. These tools serve different functions. Tables 6.4 and 6.5 discuss the transition risk scenario analysis tools for investments and fossil fuel reserves, respectively.
| Energy Transition | An energy transition scenario analysis tool compares investment portfolios to energy transition scenarios that are estimated to be needed in order to reach a temperature target. |
| Warming Potential | A warming potential scenario analysis tool compares investment portfolios to global warming budgets that are needed in order to reach a temperature target. |
| Carbon Price | A carbon price scenario analysis tool examines the impact of a carbon price (e.g., resulting from a cap-and-trade program or carbon tax) on investment portfolios. |
| Capex | A capex scenario analysis tool evaluates whether potential capex should be deployed when considering carbon budget restrictions. |
6.2 Physical risks
Physical risk scenario analysis is increasing in prominence. Physical risk scenario analysis involves using climate scenarios to evaluate the physical risks presented to assets under management. The IPCC’s climate scenarios are the scenarios typically used to evaluate physical risks (TCFD 2017b, 12–13). Incorporating the input of governments and research institutions involved in dozens of global research collaborations (IPCC 2020; PRI n.d.b; Four Twenty Seven 2018, 2–3), the scenarios identify emissions trajectories or the amount of emissions in the atmosphere over time when specific future courses of action are taken (IPCC 2020; PRI n.d.b; TCFD 2017b, 24–25). In Table 6.6 is information on IPCC’s climate scenarios that are used for physical risk ratings and scenario analysis that incorporates physical risk ratings.
| IPCC’s RCP 2.6 | The Intergovernmental Panel on Climate Change’s Representative Concentration Pathway 2.6 Scenario is a scenario where there is strict mitigation action and global temperatures are aligned with Paris Agreement objectives. |
| IPCC’s RCP 4.5 | The Intergovernmental Panel on Climate Change’s Representative Concentration Pathway 4.5 Scenario is an intermediate mitigation action scenario where there are sizeable global temperature increases. |
| IPCC’s RCP 8.5 | The Intergovernmental Panel on Climate Change’s Representative Concentration Pathway 8.5 Scenario is a business-as-usual scenario where there are significant global temperature increases. |
6.2.1 Generating ratings
The general methodology for physical risk scenario analysis builds on practices already established for rating physical risks to properties. Insurers and banks have been using property-specific risk scores, generated from risk assessment tools, to make lending and underwriting decisions about specific properties, while total overall underwriting rates can be restricted by actuarial models that use historic loss data. In the United States, the primary risk assessment tool for wildfires has been generating property-specific risk scores using historical data with only three factors: fuel load, access, and slope for all properties within a zip code. Properties in specific zip codes are assigned a score of 0 to 30 based on a calculation for their zip code, with a score of 0 representing no risk and a score of 30 representing extreme risk (ISO n.d.). Insurers will typically charge lower premium rate to properties with a low risk score and charge a higher rate to properties with a high risk score or decide not to underwrite a property with high risk score altogether.
A risk assessment tool that is capable of generating property-specific risk scores using a range of complex environmental factors can also assign risk scores using forward-looking weather and non-weather data sourced from downscaled climate model output. Climate models can provide information on dozens of variables, including temperature and precipitation, but climate models produce gridded data with limited resolution. However, climate model output can be further downscaled to provide greater resolution, allowing for modeling on topographical features (Four Twenty Seven 2018, 2–3). Once downscaled, climate change model output can be supplemented with additional data to yield more location specific risk assessment information. This can be loaded into a risk assessment tool to provide property-specific risk scores.
The process for developing forward-looking risk rating involves selecting a climate scenario to input into a climate model. A climate modeler can input climate scenarios, such as the IPCC’s scenarios, into climate models to generate outputs. For instance, as part of California’s Fourth Climate Assessment, Scripps Institution of Oceanography researchers input the IPCC’s RCP 4.5 Scenario and the IPCC’s RCP 8.5 Scenario into global climate models. The output from doing so was limited in resolution. However, the Scripps Institution of Oceanography researchers then used localized constructed analogs to downscale the limited-resolution outputs. Doing so increased resolution, allowing for modeling on topographical features such as California’s unique land surface and hydrological characteristics (Pierce, Cayan, and Dehaan 2016). Once downscaled, climate change model projections can be supplemented with additional data, including, for instance, heat stress, water stress, wildfires, sea level rise, and hurricanes, to yield more location-specific risk assessment information (Four Twenty Seven 2018, 4–7). Downscaling is depicted in Figure 6.3.
Four Twenty Seven, an affiliate of Moody’s and provider of data related to physical climate and environmental risks (Flavelle 2019), uses its risk assessment tool to provide physical climate risk scores based on downscaled global climate models and other environmental datasets applied to corporate structures and other property assets (Four Twenty Seven 2018, 7). This process has enabled Four Twenty Seven to develop a global database of security information with facility-level physical risk scores (Four Twenty Seven 2018, 7). Figure 6.4 shows the exposure to water stress of all facilities in Four Twenty Seven’s global company database. The map provides overall risk scores for corporate facilities and other property holdings. Although not as easily discernable in the grayscale reproduction, distinguishable shading represents locations where there is the highest level of risk, significant risk, still concerning risk, and minimal risk. Where there is no shading, the database did not include facilities in that area at the time this map was generated, although the database’s coverage has since expanded.

Figure 6.3Climate Model Downscaling
Source: Scripps Institution of Oceanography
Four Twenty Seven’s on-demand physical climate risk application and company climate risk scores allow asset owners to evaluate identifiable climate risks and determine whether any risk mitigation efforts are warranted. For instance, asset owners can assess flood risks for a particular asset and then explore whether there are specific protection efforts that should be taken or whether relocation efforts are more prudent. With heat stress, asset owners can determine how increased energy demands could impact operational costs and plan for the impact accordingly (Four Twenty Seven 2019, 13).
Four Twenty Seven is also planning to add additional scenarios to its physical climate risk scores. While Four Twenty Seven’s database already allows asset managers to check their portfolio against Four Twenty Seven’s database of security information to determine how exposed they are to physical risks, additional RCP scenarios would help inform reporting requirements and risk management. The knowledge can inform future asset management decisions in order to be more aligned with the Paris Agreement objectives.

Source: Four Twenty Seven (427mt.com) © 2019 All Rights Reserved
6.2.2 Applying ratings
A physical scenario analysis tool can incorporate physical risk ratings in the following manner. A physical scenario analysis tool links property-specific risks scores to corporate assets based on the location of the company’s business operations. A modeler uploads investment portfolio information into this physical scenario analysis tool, which provides information on the exposure of assets in that portfolio to the risks reflected in the risk scores.
In the beginning of 2019, when the California Department of Insurance and 2 Degrees Investing Initiative released subsequent scenario analysis results, the results included an assessment of physical risks on insurers’ investments, along with transition risks (CDI n.d.). In particular, the analysis looked at water stress, floods, and wildfires. With respect to water stress, the analysis used World Resource Institute’s Aqueduct risk rating tools and data to assess the investments under management and determined the percentage of thermal power investments at risk of water stress. Thermal power plants, including coal, oil, gas, and nuclear power plants require water for operations such as cooling and are at risk from climate-related water stress. The data also indicates that climate change presents risks to certain clean technologies exposed to water stress, such as thermal solar power plants in desert regions (CDI and 2DII 2019, 23; WRI n.d.). With respect to flood risk, the analysis applied the European Union–developed global flood risk rating map to identify the exposure of power, oil and gas, and coal mining investments to a 1-in-100 scenario (CDI and 2DII 2019, 24; EU 2020). With respect to wildfire risks, the analysis applied wildfire risk analytics built on the United Nations Environment global wildfire risk rating map to identify the exposure of power, oil and gas, and coal mining investments. The data also indicates that climate change presents risks to utilities with transmission lines in certain regions where there is significant wildfire risk (CDI and 2DII 2019, 23). All of the physical risk analysis used the underlying investment portfolio data used for the subsequent transition risk analysis. Table 6.7 discusses how a physical risk scenario analysis tool for assets works.
Physical risk scenario analysis is important because it helps asset managers understand another important concern when making decisions about investments. Some investments that are not exposed to transition risks could be exposed to physical risks. Moreover, other investments may be exposed to both transition and physical risks, requiring additional attention.
| Location of Assets | This scenario analysis uses a physical risk rating or other location-specific assessments that are attributed to securities through their headquarters and other real property holdings. |
6.3 Comparing risks
Transition scenario analysis and physical risk scenario analysis have important similarities. To start, with both transition and physical risk scenario analysis, users of scenario analysis have to select scenarios. Scenarios incorporate a number of assumptions that are unique to each scenario. However, the main decision that a user has to make in selecting a scenario is how ambitious future action will be with respect to achieving climate objectives with scenarios reflecting either major, moderate, or no achievements. In addition, there are also subtle decisions that a user has to make in selecting a scenario, such as whether a modeler agrees with data that was used in developing the scenario and how that data was incorporated.
Next, with both transition and physical risk scenario analysis, users have to create or decide on how to upload investment portfolio data. These decisions impact how to compose and otherwise aggregate the data that is going to have a scenario applied to it and how the trajectory of data will appear when interacting with a scenario. For example, a determination will need to be made on what asset classes are incorporated and whether those asset classes are identified collectively or separately. There will also have to be a decision on whether to include only publicly traded securities or also private placements. It is more difficult to automate the inclusion of private placements because they do not have security labels and therefore may have to be identified manually. Moreover, there will have to be decisions about what sectors to include and how to identify assets within those sectors. Some sectors may have limited coverage or not have a lot of alternative investment options. Therefore, findings for certain sectors may be more reliable than findings for other sectors. Also, depending on what third-party data products are used, certain assets will be classified as a type of security in some instances but not in other instances. Further, users may only wish to upload a portion of their investment portfolios, such as a region of investments corresponding with a specific scenario or the demands of an agency monitoring or seeking investment reporting.
There are also important differences between transition and physical risk scenario analysis. To begin with, they tend to use different types of scenarios. Transition risk scenarios tend to show plausible assumptions about the deployment of sustainable energy technologies and the development of regulatory policies that will limit greenhouse gas emissions in line with these policies (TCFD 2017b, 12–13). With transition risk modeling, if other factors are held to be the same, it is more difficult for an investment portfolio to be aligned with a lower temperature target. It is also possible that with a very low temperature target, certain industries may not be able to operate and new industries such as those connected with sinks may need to develop, further compounding issues with portfolio alignment.
Physical risk scenarios tend to show the results of projected levels of greenhouse gas emissions on the world’s climate that are downscaled to potential local-level impacts (TCFD 2017b, 12–13). With physical risk modeling, if other factors are held to be the same, facilities and property holdings as well as investment portfolios are likely to experience the greatest degrees of risk with higher temperature projections. Moreover, it is possible that with certain high temperatures, there could be cascading effects related to major weather–induced catastrophes, such as the melting of the polar ice caps or bleaching of major coral reefs.
The interaction between transition risk modeling and physical risk modeling is shown in Figure 6.5. When there are lower temperature targets, there are greater transition risks and lower physical risks. Conversely, when there are higher temperature targets, there are lower transition risks and greater physical risks. Therefore, it is important for modelers to use different scenarios when evaluating their assets. As explained by the TCFD, “Given the number of variables and analytical approaches to scenario analysis, there can be a wide range of scenarios that describe various outcomes” (TCFD 2017b, 8). In order to perform the analysis, multiple assumptions need to be made.
A number of companies are familiarizing themselves with transition and physical risk scenario analysis tools. The use of transition risk scenario analysis is starting to become widely used. For instance, 2 Degrees Investing Initiative says that hundreds of companies have uploaded their investment portfolios into their and PRI’s free-to-use version of the PACTA tool. The use of physical risk scenario analysis is expanding, too. However, how companies are using transition and physical risk scenario analysis is not entirely clear.
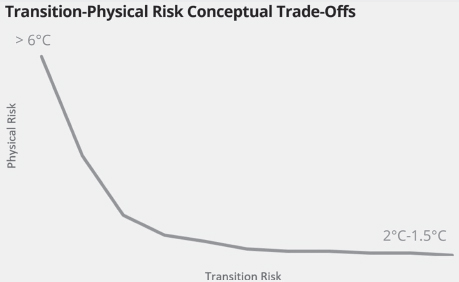
Figure 6.5Transition-Physical Risk Conceptual Trade-offs
Source: Task Force on Climate-related Financial Disclosures
Outputs from transition and physical scenario analysis can be used to help companies report in jurisdictions where climate change reporting is required, such as in France. Specifically, the French Energy Transition Law requires companies to make climate disclosures but does not currently strictly prescribe how this is to take place, making publication of scenario analysis results on a company website presumably an acceptable option. The PACTA tool can similarly help companies comply with the TCFD recommendations (PRI n.d.a). Four Twenty Seven also explains that its physical risk data can be used for French Energy Transition Law and TCFD reporting.
Outputs from transition and physical risk scenario analysis can also be used to inform investment decisions. Some companies have already said that they will use transition risk scenario analysis testing to help them modify their investment strategy to align with the Paris Agreement (ING n.d.). Other companies are doing the same or stating that they are exploring the possibility of doing so (AXA 2018, 8–11, 2020, 16). Meanwhile, it is possible that at least certain asset managers could be required to at least report findings from such analysis in the relatively near future, especially if they are a pension fund responsible for paying dividends in the long term or any type of asset manager operating in France, where climate-related financial legislation is developing. Along these lines, this scenario analysis can also help inform the decision making of pension fund managers who are required to align with the Paris Agreement objectives or companies that may be required to make similar calculations. However, absent a requirement to either report on carbon risks and green finance or align a company’s investment portfolio with a prescribed set of standards, there may not be significant motivation to publish transition and physical risk scenario analysis results or make financial decisions informed by them.
References
2 Degrees Investing Initiative. 2017. Out of the Fog: Quantifying the Alignment of Swiss Pension Funds and Insurance with the Paris Agreement. New York: 2 Degrees Investing Initiative.
2 Degrees Investing Initiative. n.d.a. “PACTA 2020 – Climate Alignment Assessment.” Accessed July 25, 2020. www.transitionmonitor.com/pacta-2020/.
2 Degrees Investing Initiative. n.d.b. “Partnerships with Supervisors.” Accessed July 25, 2020. https://2degrees-investing.org/resource/partnerships-with-supervisors-2/.
2 Degrees Investing Initiative. n.d.c. “Paris Agreement Capital Transition Assessment.” Accessed July 25, 2020. www.transitionmonitor.com/.
AXA. 2018. Climate-Related Investment & Insurance Report. Paris: AXA.
AXA. 2020. 2020 Climate Report: Renewed Action in a Time of Crisis. Paris: AXA.
Bank of England. 2019. General Insurance Stress Test 2019: Scenario Specification, Guidelines and Instructions. London: Bank of England.
Bank of France. 2020. Climate-Related Scenarios for Financial Stability Assessment: An Application to France. Working Paper Series no. 774. Paris: Bank of France.
Bolton, Patrick, Morgan Despres, Luiz Awazu Pereira da Silva, Frédéric Samama, and Romain Svartzman. 2020. The Green Swan: Central Banking and Financial Stability in the Age of Climate Change. Basel: Bank of International Settlements and Bank of France.
California Department of Insurance. n.d. “Scenario Analysis.” Accessed July 25, 2020. https://interactive.web.insurance.ca.gov/apex_extprd/f?p=250:70.
California Department of Insurance and 2 Degrees Investing Initiative. 2018. 2 Degrees Scenario Analysis, Insurance Companies Operating in California. Sacramento: California Department of Insurance and 2 Degrees Investing Initiative.
California Department of Insurance and 2 Degrees Investing Initiative. 2019. 2 Degrees Scenario Analysis, Insurance Companies Operating in California. Sacramento: California Department of Insurance and 2 Degrees Investing Initiative.
Carbon Tracker. 2019. Measuring Commitment to Climate Goals. London: Carbon Tracker.
Climate Action 100+. 2019. “2019 Progress Report.”
Dent, Kieran, Ben Westwood, and Miguel Segoviano. 2016. Stress Testing of Banks: An Introduction. London: Bank of England.
European Union Open Data Portal. n.d. “Flood Hazard Map of the World – 100-Year Return Period.” Accessed July 25, 2020. https://data.europa.eu/euodp/en/data/dataset/jrc-floods-floodmapgl_rp100y-tif.
Flavelle, Christopher. 2019. “Moody’s Buys Climate Data Firm, Signaling New Scrutiny of Climate Risks.” The New York Times, July 24. www.nytimes.com/2019/07/24/climate/moodys-ratings-climate-change-data.html.
Four Twenty Seven. 2018. Using Climate Data, A Primer to Inform the Use of Climate Data in Financial Institutions, Business and Governments. Berkeley: Four Twenty Seven.
Four Twenty Seven. 2019. Demystifying Climate Scenario Analysis for Financial Stakeholders. Berkeley: Four Twenty Seven.
Greenpeace. n.d. “Energy [R]evolution Report Details How United States Can Transition to Nearly 100% Renewable Energy.” Accessed May 12, 2014. www.greenpeace.org/usa/news/energy-revolution-report-details-how-us-can-transition-to-nearly-100-renewable-energy/.
ING. n.d. “Terra Approach.” Accessed July 25, 2020. www.ing.com/Sustainability/Sustainable-business/INGs-Terra-approach.htm.
Intergovernmental Panel on Climate Change. n.d. “The Intergovernmental Panel on Climate Change.” Accessed July 25, 2020. www.ipcc.ch/.
International Energy Agency. 2018. World Energy Model Documentation. Paris: International Energy Agency.
International Renewable Energy Agency. n.d. “REmap – Renewable Energy Roadmaps.” Accessed July 25, 2020. www.irena.org/remap.
ISO. n.d. “FireLine Reports.” ISO. Accessed July 25, 2020. www.iso.com/isoPassportHelp/fireline_reports.htm.
Leaton, James, and Andrew Grant. 2017. 2 Degrees of Separation: Transition Risk for Oil and Gas in Low Carbon World. London: Carbon Tracker.
Mattison, Richard. 2018. “Trucost and S&P Global.” Trucost ESG Analysis and S&P Global, October 25. www.trucost.com/trucost-blog/trucost-and-sp-global/.
Mills, Evan, Ted Lamm, Sadaf Sukhia, Ethan Elkind, and Aaron Ezroj. 2018. Trial by Fire: Managing Climate Risks Facing Insurance in the Golden State. Sacramento: California Department of Insurance.
MSCI. n.d. “The Global Industry Classification Standard.” Accessed July 25, 2020. www.msci.com/gics.
MSCI and Carbon Delta. 2019. “Climate Value-at-Risk.” Accessed July 25, 2020. www.carbon-delta.com.
Network for Greening the Financial System. 2020. Guide to Climate Scenario Analysis for Central Banks and Supervisors. Paris: Network for Greening the Financial System.
Pierce, David W., Daniel R. Cayan, and Laurel Dehaan. 2016. Climate Projections to Support the 4th California Climate Assessment. La Jolla: Scripps Institution of Oceanography.
Piotrowski, Jan. 2018. “Markets May be Underpricing Climate-Related Risk.” The Economist, May 24. www.economist.com/finance-and-economics/2018/05/24/markets-may-be-underpricing-climate-related-risk.
Principles for Responsible Investment. n.d.a. “Launch of First Online and Free Climate Scenario-Based Analysis Tool.” Accessed September 3, 2018. www.unpri.org/news-and-press/launch-of-first-online-and-free-climate-scenario-based-analysis-tool/3571.article.
Principles for Responsible Investment. n.d.b. “Climate Scenario Analysis.” Accessed July 25, 2020. www.unpri.org/climate-change/directory-of-climate-scenario-tools/3606.article.
Task Force on Climate-related Financial Disclosures. 2017a. Recommendations of the Task Force on Climate-related Financial Disclosures. Basel: Task Force on Climate-related Financial Disclosures.
Task Force on Climate-related Financial Disclosures. 2017b. The Use of Scenario Analysis in Disclosure of Climate-Related Risks and Opportunities. Basel: Task Force on Climate-related Financial Disclosures.
Thomä, Jakob, and Hugues Chenet. 2019. “Transition Risks and Market Failure: A Theoretical Discourse on Why Financial Models and Economic Agents May Misprice Risk Related to the Transition to a Low-Carbon Economy.” In Stranded Assets: Developments in Finance and Investment, edited by Ben Caldecott, 45–63. New York: Routledge.
Trucost ESG Analysis and S&P Global. 2019a. Carbon Earnings at Risk. London: Trucost ESG Analysis and S&P Global.
Trucost ESG Analysis and S&P Global. 2019b. Integrating Future Carbon Price Risk into Portfolio Analysis. London: Trucost ESG Analysis and S&P Global.
Trucost ESG Analysis and S&P Global. 2019c. TCFD Scenario Analysis: Integrating Future Carbon Price Risk into Portfolio Analysis. London: Trucost ESG Analysis and S&P Global.
Vermeulen, Robert, Edo Schets, Melanie Lohuis, Barbara Kölbl, David-Jan Jansen, and Willem Heeringa. 2018. An Energy Transition Risk Stress Test for the Financial System of the Netherlands. Amsterdam: Dutch Bank.
Vermeulen, Robert, Edo Schets, Melanie Lohuis, Barbara Kölbl, David-Jan Jansen, and Willem Heeringa. 2019. The Heat Is on: A Framework Measuring Financial Stress Under Disruptive Energy Transition Scenarios. Amsterdam: Dutch Bank.
World Resources Institute. n.d. “Identify and Evaluate Water Risks Around the World.” Accessed July 25, 2020. www.wri.org/aqueduct.