
]>
Chapter 9
Harnessing Artificial Intelligence for Secure ECG Analytics at the Edge for Cardiac Arrhythmia Classification
CONTENTS
9.4.1 ECG Pre-processing Phase
9.4.2 Heartbeat Segmentation Phase
9.4.3 Feature Extraction Phase
9.4.4 Learning/Classification Phase
9.5 Experimental Setups, Results and Discussion
9.5.2 Results for Experimental Setup 1
9.1 Introduction
Due to the rapid advancement in Artificial Intelligence (AI) and Internet of Things (IoT) technologies, automated health monitoring of subjects with chronic diseases such as cardiovascular diseases (CVDs) is emerging to be a striking necessity to introduce intelligence into the healthcare system. However, traditional health analytics and monitoring systems mostly employ cloud computing, which can raise an obvious privacy concern for the subjects and care providers [1]. Therefore, to integrate intelligence into the healthcare system and make the analytics process more robust and secure, we choose electrocardiogram (ECG) analysis for arrhythmia detection. The proposed AI-aided heartbeat classification system, if deployed at the edge devices, can identify irregular heartbeats with high accuracy and can be deployed at the edge device for localized intelligence without the obligation to transfer health data to a remote server decision-making.
As a proof of concept of the localized analytics of health data, we choose cardiac arrhythmia since it is one of the major causes of CVDs. CVDs are the leading reason for death globally, and more people die yearly from CVDs than from any other cause, according to the world health organization (WHO) [2]. These CVDs arise due to the long-term result of cardiac arrhythmia, which may not seem life-threatening initially but can result in heart failure in the long run if not detected timely. Arrhythmia causes the heart not to pump blood adequately. Patients suffering from arrhythmia ordinarily feel signs of quicker or slower heart pulsations. Some other symptoms encompass fainting, dizziness, weakness and pain in the chest. However, various patients with arrhythmia do not perceive every indication. Hence, automatic arrhythmia detection is vital to avoid any extreme adverse CVD conditions. Continuous observation of the ECG signals over hours is very critical for detecting various CVDs. The conventional method of long-time ECG monitoring is known to be invasive, time-consuming and extremely expensive, where the daily activity of the subject becomes confined during the ECG data retrieval phase. Lately, due to the massive advancement in Machine Learning (ML), Deep Learning (DL) techniques for efficient data analysis and the wearable IoT devices and wireless technologies, the ECG signal can be transmitted using wireless transmission techniques and analyzed automatically. Figure 9.1 manifests the traditional cloud-based health monitoring system and our focused secure AI-aided edge analytics for smarter IoT with embedded intelligence. It is usually analyzed at the remote cloud to get insights into the health status of a subject. However, in this way, the private sensitive health data gets shared with the cloud server, which can raise a potential privacy concern. Moreover, this paradigm of ECG analytics results in bandwidth consumption, delay in transmitting the enormous data and privacy concerns.

Figure 9.1 Traditional cloud-based ECG monitoring architecture vs secure edge analytics paradigm.
Although the traditional cloud-based architecture has aforementioned potential pitfalls, the adaptation of localized intelligence at the edge devices is still lacking focus in the literature. To diminish the communication delay, extensive network bandwidth, and preserve user-data privacy, we should consider the localized analysis of the health data. Thus, a more automated and effective analytics technique should be designed and integrated with the edge devices. Therefore, in this chapter, as the primary step of integrating intelligence with edge devices, we focus on developing the efficient multi-class heartbeat (HB) classification system and we considered several ML techniques to pave the way to relocate the ECG monitoring system for arrhythmia detection from the centralized cloud paradigm to edge IoT to enhance the privacy of the subject’s health data. We employ state-of-the-art AI and data analytics techniques to efficiently develop the ML models and assess the models’ effectiveness in multiple experimental setups. Among the ML models, we have explored the random forest (RF), Decision Tree (DT), K Nearest Neighbor (KNN), Quadratic Discriminant Analysis (QDA) and Linear Discriminative Analysis (LDA) classifiers to compare the models’ performance employing a clinically graded ECG dataset [3–5]. The RF model outperformed the other two ML models with exceptional classification accuracy (95.74% and 99.45%), which indicates the model’s eligibility for deploying at the programmable smart edge devices for secure ECG monitoring.
9.2 Literature Review
An efficient arrhythmia classification is a vital task for secure ECG monitoring, which comprises detecting irregular heartbeats from the ECG signal. Arrhythmia subjects usually experience symptoms of faster or slower heartbeats compared to a regular rhythm [6]. Due to the availability of IoT devices that can facilitate health data transmission, researchers have been working on ECG analysis for detecting these diverse abnormal heart conditions. It is indispensable to identify CVDs timely, and hence, constant measurement of ECG for an extended time is imperative. However, the traditional method of long-time ECG monitoring is invasive and costly, and it limits the daily activity of the subjects. To surmount this issue and introduce automation in the ECG monitoring system, cloud-based ECG analytics has been employed where the ECG signal is customarily broadcasted adopting wireless transmission methods such as Bluetooth, Zigbee or Wi-Fi [7, 8]. Therefore, most of these conventional automatic ECG monitoring systems analyze the data at the cloud servers to carry out the system models and then send feedback to the user or care providers. Authors in [9] proposed cloud-based analytics where the ECG signals are gathered employing a wearable monitoring node and transmitted straight to the IoT cloud using Wi-Fi. An IoT-based patient monitoring system is introduced where data is then processed utilizing a Raspberry Pi, temperature sensor, heart rate sensor and accelerometer sensor and then after the analysis phase decision regarding the heart condition is delivered to the IoT cloud for cloud-based analytics [10].
Arrhythmia is often attached to other kinds of heart disease, which means subjects may require treatment to prevent further severe issues. Hence, recently automatic heartbeat classification is getting widespread attention to automate the process with enhanced efficiency and security. The most common medical test for arrhythmia is the ECG. Due to the ECG signal’s noise and the heartbeat signal’s non-stationary nature, it is difficult for cardiologists to deal with manual arrhythmia detection. Arrhythmia can be discovered when the heartbeat’s electrical activity is unusual and can result in a faster or slower heartbeat than normal conditions. Arrhythmia can happen at random times as ECG is a non-stationary signal. The ECG data volume is enormous, and the manual process can be delayed and time-consuming [11]. Hence, the automatic classification needs to implement with the IoT sensors to embed the intelligence or the analytics phase of the detection of arrhythmia efficiently and securely. A few notable examples of ECG analysis are performed by employing time-domain analysis [12], neural networks [13], wavelet analysis [14], wavelet analysis combined with radial basis function neural networks (RBFNN) [15] and non-linear delay differential equations [16].
In the cloud-based ECG arrhythmia monitoring systems, numerous techniques are utilized, for example, feature extraction and classification techniques such as ML and Deep Learning (DL). The authors in [17] have proposed a Support Vector Machine (SVM)-based classification model for arrhythmia detection with high accuracy. The authors in [18] use a deep learning-based CNN model to classify heartbeats with high correctness. Another method employed a Deep Neural Network (DNN) architecture [19] to classify the ECG signal as natural or unusual, checked with ground-truth, and demonstrated exceptional performance. Furthermore, AdaBoost and Gradient Boosting algorithms were implemented by the authors in [20] to classify ECG using single-lead ECG. In another research, an accurate arrhythmia classification method for ECG is proposed based on extreme weighted gradient boosting (XGBoost) using a broad range of feature sets [21]. Although most researchers have focused on cloud-based ECG analytics, the concept of localized intelligence for ultra-edge IoT-based efficient arrhythmia classification technique is proposed in [1].
9.3 Dataset Preparation
To develop the arrhythmia classification model, we have employed the MIT-BIH arrhythmia database [22] taken from Physionet, which comprises records of several traditional and life-threatening cases of arrhythmia and normal samples sinus rhythm. Since 1980, this dataset has been utilized for fundamental research on cardiac diseases and ECG. The database contains 48 examples of 30 mins excerpts of two-lead (lead A and B) ECG recordings acquired from 47 subjects at a sampling rate of 360 Hz. At least two cardiologists annotate each beat. Most of the dataset recordings consist of either lead II, V2, V4, or V5. The recordings can be divided into two sets:
23 subjects (100 series) are determined at random from a group of over 4000 Holter recordings
25 subjects (200 series) were chosen to incorporate samples of unusual but essential cases of arrhythmia.
The datasets comprise a text header file, a binary file, and a binary annotation file with .txt, .dat, and .atr extensions, respectively.
Header file (.hea): These files comprise a brief text file that defines the contents of the signals, such as the name of the signal file, number of examples, signal format, type of signal, and so forth.
Binary file (.dat): The binary files include digitized representations of the ECG signals.
Annotation files (.atr): The annotation files contain compilations of heartbeat labels that represent the nature of ECG signals at a stipulated time in the record.
Annotations can be used in this dataset to generate five different beat categories in accordance with the Association for the Advancement of Medical Instrumentation (AAMI) EC57 standard [23]. Table 9.1 illustrates a summary of mappings between beat annotations in each category.
Table 9.1 Mapping the MIT-BIH Arrhythmia dataset heartbeats to the AAMI heartbeat classes.
| Heartbeat Super Class | Heartbeat Annotation |
|---|---|
| N (Normal) | N (Normal) |
| L (Left bundle branch block beat) | |
| R (Right bundle branch block beat) | |
| e (Atrial escape beat) | |
| j (Nodal (junctional) escape beat) | |
| S (Supraventricular ectopic beat) | A (Atrial premature beat) |
| a (Aberrated atrial premature beat) | |
| J (Nodal (junctional) premature beat) | |
| S (Supraventricular premature beat) | |
| V (Premature ventricular contraction) | |
| V (Ventricular ectopic beat) | E (Ventricular escape beat) |
| F (Fusion beat) | F (Fusion of ventricular and normal beats) |
| Q (Unclassifiable beat) | |
| / (Paced beat) | |
| Q (Unknown beat) | f (Fusion of paced and normal beat) |
The labeled ventricular beats are from 15 different heartbeat types in the MIT-BIH arrhythmia dataset, as shown in Table 9.1. Also, there exists considerable variation in the number of examples of the heartbeat types presented in Table 9.2. Here, the most prominent class is Normal (N), with over 75,000 samples, whereas the minority class with the least number of samples is the Fusion beat (F). Among the five classes in the dataset, for the multi-class heartbeat detection task, we have employed the three prominent classes with a high number of samples (i.e., N, S, and V) in the experiment. Even after considering the majority classes with a higher number of heartbeats, there is a significant class imbalance within the three categories, and we adopted up-sampling the instances from the classes with lower samples compared to the majority class.
Table 9.2 Frequency of heartbeats of each class of the dataset.
| Heartbeat Super Class | Number of Samples |
|---|---|
| N (Normal beat) | 90,083 |
| S (Supraventricular ectopic beat) | 2,779 |
| V (Ventricular ectopic beat) | 7,009 |
| F (Fusion beat) | 15 |
| Q (Unknown beat) | 803 |
9.4 Methodology
This section illustrates the proposed ML-based heartbeat classification methods and the potentiality of deploying at the edge node for secure ECG analytics. AI logic can be integrated with edge sensors for a long time, efficient ECG monitoring of a subject [1] [24]. Hence, in this work, we aim to develop a practical ECG filtering, feature extraction method, which can pave the way to a secure classification method by deploying at the edge node. The deployment and integration of the efficient AI-aided models at the edge devices will enhance the privacy and security of the sensitive ECG trace as the data will not be required to be transferred to any remote server for analysis. The results produced by the edge analytics can then be transmitted to the care-providers for cardiac activity monitoring. In order to implement the AI-aided system at the edge sensors for faster and secure analysis, the classification of heartbeat is a crucial segment. Consequently, our primary goal is to design such an AI-aided model that can be deployed at the edge node for secure ECG monitoring with high precision.
The proposed AI-aided system requires four distinct phases for efficient ECG analytics:
ECG signal pre-processing
Heartbeat segmentation
Feature extraction
Learning or Classification
As presented in Figure 9.2, the ECG heartbeat classification task mainly comprises four steps. The first step is the pre-processing phase, which involves eliminating the ECG’s undesired interference and noises. The segmentation technique creates parts into simple data for additional analysis. A unique set of significant features extracted for further investigation of the ECG is produced in the feature extraction phase. Lastly, the classification phase includes the detection and learning of the type of heartbeat based on ECG features. The techniques utilized during the pre-processing step directly influence the results, and hence, it should be cautiously accumulated. The classification of heartbeat mainly consists of the combination of an efficient feature extraction technique followed by ML or deep learning algorithms. The following subsections explain the methodology employed in each of the four steps of the analysis.

Figure 9.2 Steps of ECG heartbeat classification.
9.4.1 ECG Pre-processing Phase
There are several kinds of noise associated with the raw ECG signal. Among these include the noise due to muscle contraction, power-line interference, baseline wander. Hence, pre-processing is essential for efficient recognition of ECG signals. Several approaches have been taken for the pre-processing step of ECG signals. To decrease the impacts of artifacts of ECG before handling the information. In perspective on this, we utilized a course of three filters:
A high-pass Butterworth filter with cut-off frequency 1 Hz is used to eliminate DC component and baseline wander
A band-reject Butterworth filter is utilized to reduce the 60 Hz AC interference
A low-pass Butterworth filter is applied to high-frequency noise with cut-off frequency 25 Hz
Butterworth filter produces frequency response as flat as possible in the passband. In Figures 9.3 and 9.3, a portion of raw ECG from record 100 of the MIT-BIH arrhythmia dataset is exhibited that contains noise and pre-processed clean ECG, respectively. As the figures illustrate that the exploited three-phased noise-filtering can eliminate different segments of unwanted noise from the ECG signal and produce a clean ECG trace for further analysis.

Figure 9.3 Effect of the noise filtering of the raw ECG signal.
9.4.2 Heartbeat Segmentation Phase
In the heartbeat segmentation phase, we have taken the fiducial points provided with the MIT-BIH datasets. These provided fiducial focuses are at the moment of the significant nearby outrageous of a QRS complex of the ECG signal. The fiducial focuses were obtained on beat-by beat premise. All heart pulsates are isolated into fifteen beat types in the datasets. However, as indicated by AAMI, all the heart thumps, which are accessible in the database, were arranged into five groups as per their physiological source. In our analysis, we have taken the three classes of beats to be specific normal (N), supraventricular (S), and ventricular (V).
Therefore, we have utilized the database’s annotations associated with heartbeat segmentation, such as identifying the R peak in the QRS complex, which is distinguished and labeled earlier. Employing the R peak location, we have also segmented the location of the other peaks (i.e., Q, S, T, etc.). Figure 9.4 illustrates the heartbeat segmentation phase’s QRS complex detection. The figure exhibits the result of Q, R, and S peak detection of the record 100 from the dataset. The R peaks’ locations are already annotated in the dataset; hence, we utilized that information to determine the exact positions of the Q and S peaks from each ECG cycle. We employed the peak location from each cycle to identify the unique features in the feature extraction phase.

Figure 9.4 Detection of QRS peaks from the ECG sample (record 100 from the dataset).
9.4.3 Feature Extraction Phase
The feature extraction stage is an essential phase for the success in the secure heartbeat classification of the arrhythmia using the ECG signal. Any information obtained from the heartbeat used to distinguish its type can be acknowledged as a feature. Figure 9.5 manifests different segments and peaks of an ideal ECG cycle and illustrates the typical locations of the four significant peaks in an ECG cycle, namely, P, Q, R, S, and T peaks. The Q, R, and S wave peaks comprise the QRS complex, which is a vital distinguishing portion of an ECG cycle. We utilize the position of these peaks to find discriminative features of the regular and irregular ECG signals.

Figure 9.5 Different components of one ideal ECG cycle.
In this study, the features have been categorized into four different groups:
RR intervals features
Heartbeat intervals features
Heartbeats waves’ amplitude features
Morphology features
The most distinguishing feature is determined from the heartbeat interval, also recognized as the RR interval, which is the interval between the R peak of a heartbeat to another different heartbeat, which could be its previous or follower heartbeat. We determined the pre-RR and post-RR intervals by calculating the R peak range with respect to the predecessor and successor cycle’s R peak’s location. Features related to RR interval have a high aptitude to distinguish the kinds of pulses, and the RR interval features play a vital role in efficient ECG analysis. Features linked with heartbeat intervals are determined after heartbeat segmentation. The QRS duration is the time interval between the QRS onset and the QRS offset. The T-wave duration is established as the time interval between the QRS offset and the T-wave offset. The full set of unique features employed in this study is presented in Table 9.3. The features are utilized for both ECG leads, namely, lead A and lead B. Therefore, combining lead A and B, we get our full feature set consisting of 34 features, 17 for each lead A and B. Features related to heartbeat amplitude can be divided into five categories, one per P, Q, R, S, and T wave where each of these contains the corresponding amplitude values. For the morphology features, five samples were taken in the QRS complex (between onset and offset point of the QRS complex).
Table 9.3 The unique set of extracted features from the ECG signal.
| Feature Group | Lead A and B |
|---|---|
| RR Intervals | Average RR |
| Pre-RR | |
| Post-RR | |
| Heartbeat Intervals features | PQ Interval |
| QT Interval | |
| ST Interval | |
| QRS Duration | |
| Heart beats amplitude features | P peak |
| T peak | |
| R peak | |
| S peak | |
| Q peak | |
| Morphology features | QRS morph feature 1 |
| QRS morph feature 2 | |
| QRS morph feature 3 | |
| QRS morph feature 4 | |
| QRS morph feature 5 |
In our study, after extracting the features from the ECG trace, we have used the standard scaling technique to scale the features in a specific range. The standardization technique scales the features by excluding the mean and adjusting to unit variance. Standardization considers that the observations fit a Gaussian distribution with a proper mean and standard deviation. This scaling technique also serves to normalize the data within a selective range, which also benefits in speeding up the computations. The standard score of sample feature x can be calculated from the Equation (9.1),
Here, μ = the mean of the feature x and σ = standard deviation
9.4.4 Learning/Classification Phase
We utilize the RF-based ML technique to deploy the AI-aided model to the edge devices for secure analysis of ECG. After defining a set of features from the heartbeats from the feature extraction phase, models can be trained with these features using AI algorithms from ML and data mining specialties for arrhythmia heartbeat classification. Some of the commonly used AI approaches for this purpose are SVM, Artificial Neural Networks (ANN) and Linear Discriminant Analysis (LDA), etc. In this research, we have applied the RF algorithm and compared the results with traditional ML models, namely the DT, KNN, QDA and LDA.
The RF is an ensemble learning method for classification, regression. Multiple decision trees are formed at the time of training. The fundamental concept behind the RF method is to combine many decision trees into a particular model. Separately, predictions made by decision trees may not be accurate, but the predictions will be more efficient when combined from multiple decision trees. A bootstrap sample technique is adopted for outputting the class that is the mode of the classes of the individual trees for classification purposes. In RF, a large number of nearly uncorrelated trees function as a combination. A set of decision trees from a randomly selected subset of the training set. Then it aggregates the majorities from all the decision trees to decide the final class of the test instance. In the RF, the measure of the split’s quality can be calculated using Gini impurity or entropy. In the adopted RF architecture, we exploited the Gini index for splitting. The RF performance is linked to the correlation among trees and the strength of each individual tree. If there is a higher correlation among the trees, the error will decrease, whereas the strength of each tree will increase the forest’s performance. We considered
9.5 Experimental Setups, Results and Discussion
In this section, we exhibit the results of the systematic experiments we conducted for the proposed RF model and compared it with other traditional ML methods. We evaluate the proposed ML-based method’s efficiency across different experimental setups. The systematic analyses were carried in different phases which are noted as follows:
Experimental setup 1: The full dataset is divided into two parts, one for training and another part for testing. The training part consists of 22 records, whereas the testing part also consists of 22 files. We also perform hyper-parameter tuning to find the optimal parameters for the ML methods.
Experimental setup 2: The full dataset is employed in this scheme. To evaluate the models, we conducted stratified cross-validation [25]. We also considered the class imbalance in the dataset by applying up-sampling of the minority class.
The experiments were conducted on a workstation with Intel Core i7, 3.00GHz CPU, 16 GB RAM, powered by Nvidia RTX 2060 GPU. For implementing the ML algorithms and other data analytics methods, we intended to utilize python programming language. We employed the Scikit-learn library for adopting the ML models, the matplotlib library for visualizing the results and ECG signals. To analyze the locations of different peaks from ECG, we employed a library named waveform-database (WFDB) [26] package for reading, writing and processing WFDB signals and annotations.
9.5.1 Performance Indicators
To evaluate the classification performance of the adopted ML models, we utilized the sequence of three measurement indicators, accuracy, weighted precision and weighted F1 score. The accuracy of a test is its ability to differentiate the three cases correctly. Considering, C = Number of classes in the considered ECG classification, Nj = Number of samples in the jth class and ∣N ∣ = the total number of samples in all the class, the accuracy can be denoted using the Equation. (9.2):
Here, TPj, FPj stands for true positive and false positive classification for the jth class, respectively. The weighted precision can be represented as Equation (9.3). It addresses how well defined the model is out of those predicted to be in jth class, how many of them are genuinely in jth class and the amount is multiplied by the weight of the jth class. The precision of the jth class can be expressed as the Equation (9.3):
As the third performance indicator, we employed the weighted F1 score, which is essentially the weighted average of precision and recall. The weighted F1 score can be achieved as Equation (9.4). Here, Pj and Rj are the precision and recall of jth class, respectively. Pj can be expressed as TPj/(TPj + FPj) and Rj can be denoted as TPj/(TPj + FNj). TPj indicates the number of cases correctly identified to be in the jth class; FPj depicts the number of cases incorrectly identified to be in the jth class and FNj indicates the number of cases wrongly identified as a class other than the jth class.
9.5.2 Results for Experimental Setup 1
In the experimental setup 1, we firstly performed hyper-parameter tuning for KNN and RF to find the optimal value of K and the number of trees, respectively, which produces the best performance. We considered N (Normal), S (Supraventricular ectopic beat) and V (Ventricular ectopic beat) heartbeats for our classification purpose. The distribution of these beats in the training and testing set for the experimental setup 1 is manifested in Table 9.4.
Table 9.4 Heartbeat distribution in train and test set for the experimental setup 1.
| Heartbeat super class | Train set | Test set |
|---|---|---|
| N (Normal) | 45,845 | 44,238 |
| S (Supraventricular ectopic beat) | 943 | 1,836 |
| V (Ventricular ectopic beat) | 3,788 | 3,221 |
Figure 9.6 exhibits the results after performing hyper-parameter tuning for KNN and RF employing experimental setup 1. We used a grid search with three-fold cross-validation for this purpose. For the training purpose of the hyper-parameter tuning phase, we utilized 50% of the training data from Table 9.4. This portion of training data was preserved and separated only for training purposes in both experimental setups. According to the hyper-parameter tuning results, the best accuracy (96.9%) of KNN was recorded when the value of K was 3. For RF, the best accuracy (97.5%) was recorded when the number of trees was 101.

Figure 9.6 Hyper-parameter tuning results for K Nearest Neighbor (KNN) and random forest (RF).
After selecting the optimal configuration for the ML models, we conducted the training of the models utilizing the training and testing data portion of experimental setup 1, illustrated in Table 9.4. In our experiments, we have employed singular value decomposition (SVD) as the solver for LDA. In terms of the KNN model, we have used Minkowski distance as the distance measurement technique. The experimental results are exhibited in Figure 9.7. The results show that the RF model outperformed the other four ML methods (DT, KNN, QDA and LDA). For further experiments, we have selected the best performing three ML methods (RF, KNN and LDA). The accuracy, precision and F1 score of the RF model were 95.74%, 0.9291 and 0.9404. Hence, the RF model’s efficiency in all three performance matrices proves its efficiency for deploying at the edge node for secure ECG analytics.
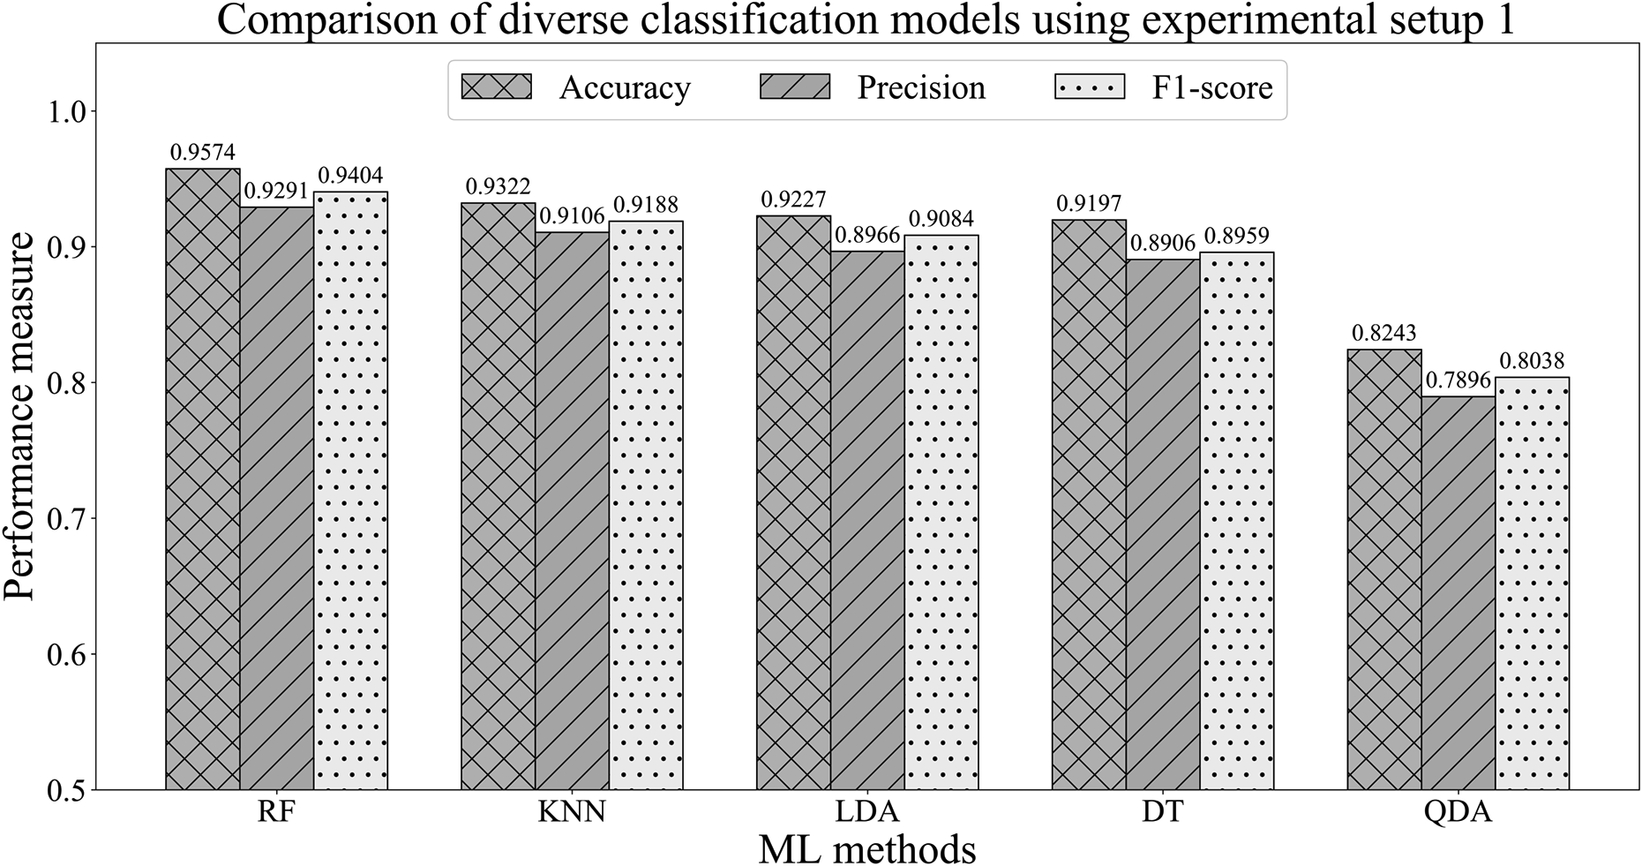
Figure 9.7 Performance comparison of the classification models employing the experimental setup 1.
As the RF method produced the best classification efficiency, we investigate the model’s performance by using the crucial features from the whole feature list. To find out more useful features in distinguishing irregular heartbeats from the ECG signal, we have utilized RF feature importance scores and used the experimental setup 1 for this purpose. In Figure 9.8, all the feature’s importance is plotted in descending order from left to right direction. Analyzing feature importance, we can perform feature selection to reduce the feature set’s dimension and use more essential features to train the classifiers [27]. In this manner, we can eliminate less significant features from the feature set to make the classifier more efficient in integrating with the edge devices. As in many cases, the edge devices are often limited in terms of resources; therefore, finding out the optimal set of features is vital to designing a model that can perform efficiently even with a lower number of features.

Figure 9.8 Top 10 features from the random forest in terms of feature importance.
Figure 9.8 demonstrates that the features related to RR intervals are more significant for RF to identify patterns in heartbeats. The first and second features in the ranking of feature importance are the pre-RR feature for lead A and lead B. These results confirm the significance of the R peak and the features related to RR intervals. Out of the top 10 features, six features are from the RR interval group. According to the feature importance score, the morphology features are the least important features as none of the top 10 features are from that feature group.
The top three ML models acquired from the previous results are compared when the reduced features (top 10 features) are utilized with the full set of features (34 features). Table 9.5 represents the results of the performance of RF when the reduced feature set is employed. The RF model outperformed the other two methods in terms of classification efficiency. The results illustrate that the RF model is robust enough to classify irregular heartbeats with 93.95% accuracy, 0.9101 precision and 0.9118 F1 score. The performance for the reduced feature set is slightly lower than that of when the full feature set is employed. However, the decrease in performance is not that massive considering that the dataset has become almost half in terms of the number of features. The encouraging classification performance proves that using only the top significant features; the RF model can be integrated with the edge devices. The RF model’s robust performance, even with the reduced feature set, proves that in terms of integrating with computational resource-constrained edge devices, the model can identify discriminative features from the ECG signal even with fewer features, facilitating the edge devices to generate faster decisions with enhanced security due to localized analytics.
Table 9.5 Performance comparison of the top performing three ML methods employing the full feature set and the reduced feature set after selecting top 10 features based on feature importance of experimental setup 1.
| Method | Full feature set | Reduced feature set with top 10 features | ||||
|---|---|---|---|---|---|---|
| Accuracy | Precision | F1 score | Accuracy | Precision | F1 score | |
| RF | 95.74% | 0.9291 | 0.9404 | 93.95% | 0.9101 | 0.9118 |
| KNN | 93.22% | 0.9106 | 0.9188 | 91.27% | 0.9014 | 0.9095 |
| LDA | 92.27% | 0.8966 | 0.9084 | 91.99% | 0.8846 | 0.8904 |
9.5.3 Results for Experimental Setup 2
For the classification of experimental setup 2, we have considered the full MIT-BIH dataset without any pre-defined training and testing data. We have used ten-fold stratified cross-validation for all three methods. Stratified k-fold cross-validator splits data into train and test sets by maintaining the ratio of representations for each class. Before the training phase of k-fold cross-validation, 20% of the whole dataset was split into the testing ECG data. The remaining 80% of the ECG trace was employed for the training purpose.
In this experimental setup, we also applied the up-sampling technique for the minority classes to deal with the class imbalance. After filtering out the noise from the ECG signal, we applied Synthetic Minority Over-sampling Technique (SMOTE) in terms of experimental setup 2 to balance the four classes. SMOTE is a technique for increasing the number of cases in the dataset in a balanced procedure [28]. This technique works by generating new examples from existing minority cases that are supplied as input. However, SMOTE does not increase or reduce the number of samples in the majority class. SMOTE receives representatives of the feature space and produces discrete cases that blend features of the target case with features of its neighbors for the minority class.
Table 9.6 manifests that the efficiency of the RF model raises after balancing the classes by adopting SMOTE. The classification accuracy of the RF model increases from 99.17% to 99.45% due to applying the SMOTE to balance out the classes. However, SMOTE did not have a positive influence on the performance of KNN and LDA as the accuracy reduced slightly for both the methods. The encouraging experimental outcomes prove that the RF model can be a viable solution for efficient and secure ECG analytics tool if integrated with the edge devices. Therefore, as the AI-based module, we can deploy this pre-trained RF model into the programmable edge devices for secure, faster and efficient analysis of the subjects’ sensitive health data with enhanced privacy due to localized inference by the ML models.
Table 9.6 Performance Comparison of the machine learning models before and after employing Synthetic Minority Over-sampling Technique (SMOTE) for experimental setup 2 using stratified 10-fold cross-validation.
| Method | Without applying SMOTE | After applying SMOTE | ||||
|---|---|---|---|---|---|---|
| Accuracy | Precision | F1 score | Accuracy | Precision | F1 score | |
| RF | 99.17% | 0.9916 | 0.9916 | 99.45% | 0.9945 | 0.9945 |
| KNN | 99.31% | 0.9931 | 0.993 | 98.86% | 0.9896 | 0.9889 |
| LDA | 95.55% | 0.9524 | 0.9531 | 90.84% | 0.9443 | 0.9252 |
9.6 Conclusion
The proliferation of wearable sensors and IoT devices generate a large stream of health data, and it is essential to keep safe from any unwanted third-party access. The pitfalls of traditional cloud-based solutions for health data analytics can cause severe concerns for the subjects and the care providers as well, and if the private health data gets compromised, it can cause a dire circumstance for both. Hence, with the developing processing power of IoT devices and smart devices, traditional analytics can be driven away from the cloud to the edge, and it can assist in overcoming significant privacy concerns as well as overall communication delay and bandwidth consumption. Hence, this chapter aims to employ AI and data analytics techniques to classify heartbeats by analyzing the ECG signal, which can be integrated with edge devices for efficient and secure heartbeat classification. This regular and irregular heartbeat classification can pave the path to overcome privacy issues of the traditional cloud-based health analytics and moving toward local intelligence. Different ML and data analytics techniques are employed to decide the most suitable model for this ECG analysis at the edge. The proposed method depicts an automatic multi-class heartbeat classification system according to the guidance of ANSI/AAMI EC57:1998 standard so that it can be integrated with sensors to produce sensors with embedded intelligence. A clinically graded dataset from PhysioNet is utilized to evaluate the proposed method, and multiple experimental setups are arranged to ensure the generalization ability of the proposed RF-based model. The selected AI-aided technique is optimized by choosing the best hyper-parameters by tuning different sets of values for the parameters. Finally, the trained model can be integrated with the edge devices to achieve localized embedded intelligence. In the proposed architecture for secure ECG analysis, a selected use-case from the health domain, the edge devices will take part in the analytics, and this way, the private and sensitive data will persist within their local device for faster and enhanced privacy.
References
- 1. S. Sakib, M. M. Fouda, Z. M. Fadlullah, and N. Nasser, “Migrating intelligence from cloud to ultra-edge smart IoT sensor based on deep learning: An arrhythmia monitoring use-case,” in 2020 International Wireless Communications and Mobile Computing (IWCMC), Limassol, Cyprus, Jun. 2020, pp. 595–600, doi: 10.1109/IWCMC48107.2020.9148134.
- 2.“Cardiovascular diseases (CVDs),” 2017. [Online]. Available: https://www.who.int/news-room/fact-sheets/detail/cardiovascular-diseases-(cvds). [Accessed: 14-Jun-2020].
- 3. A. J. Prakash and S. Ari “AAMI standard cardiac arrhythmia detection with random forest using mixed features,” 2019 IEEE 16th India Counc. Int. Conf. INDICON 2019 - Symp. Proc. pp. 24–27 2019 doi: 10.1109/INDICON47234.2019.9030317.
- 4. M. Emu and S. Sakib, “Species identification using DNA barcode sequences through supervised learning methods,” in 2nd International Conference on Electrical, Computer and Communication Engineering, ECCE 2019, 2019, pp. 7–9, doi: 10.1109/ECACE.2019.8679166.
- 5. L. Yang, X. Liu, F. Nie, and Y. Liu, “Robust and efficient linear discriminant analysis with L2,1-Norm for feature selection,” IEEE Access, vol. 8, pp. 44100–44110, 2020, doi: 10.1109/ACCESS.2020.2978287.
- 6. S. Sahoo, M. Dash, S. Behera, and S. Sabut, “Machine learning approach to detect cardiac arrhythmias in ecg signals: A survey,” Innovation and Research in BioMedical engineering (IRBM), vol. 41, pp. 185–194, 2020, doi: 10.1016/j.irbm.2019.12.001.
- 7. T. Shaown, I. Hasan, M. M. R. Mim, and M. S. Hossain, “IoT-based portable ECG monitoring system for smart healthcare,” in 1st International Conference on Advances in Science, Engineering and Robotics Technology (ICASERT), Dhaka, Bangladesh, May 2019, doi: 10.1109/ICASERT.2019.8934622.
- 8. M. Bansal and B. Gandhi, “IoT big data in smart healthcare (ECG monitoring),” in 2019 International Conference on Machine Learning, Big Data, Cloud and Parallel Computing (COMITCon), Faridabad, India, Feb. 2019, pp. 390–396, doi: 10.1109/COMITCon.2019.8862197.
- 9. A. Rahman, T. Rahman, N. H. Ghani, S. Hossain, and J. Uddin, “IoT Based patient monitoring system using ECG sensor,” in 1st International Conference on Robotics, Electrical and Signal Processing Techniques (ICREST), Dhaka, Bangladesh, Jan. 2019, pp. 378–382, doi: 10.1109/ICREST.2019.8644065.
- 10. A. Kamble and S. Bhutad, “IOT based patient health monitoring system with nested cloud security,” in 4th International Conference on Computing Communication and Automation (ICCCA), Greater Noida, India, Dec. 2018, pp. 1–5, doi: 10.1109/CCAA.2018.8777691.
- 11. E. Izci, M. A. Özdemir, R. Sadighzadeh, and A. Akan, “Arrhythmia detection on ECG signals by using empirical mode decomposition,” in 2018 Medical Technologies National Congress (TIPTEKNO), Magusa, Nov. 2018, pp. 1–4, doi: 10.1109/TIPTEKNO.2018.8597094.
- 12. Y. R. Tsai, Z. Y. Chang, and C. W. Huang, “Time-domain multi-level R-peak detection algorithm for ECG signal processing∗,” in 2019 IEEE Eurasia Conference on Biomedical Engineering, Healthcare and Sustainability (ECBIOS), Okinawa, Japan, 2019, pp. 35–38, doi: 10.1109/ECBIOS.2019.8807887.
- 13. M. Kachuee, S. Fazeli, and M. Sarrafzadeh, “ECG heartbeat classification: A deep transferable representation,” in 2018 IEEE International Conference on Healthcare Informatics (ICHI), New York, NY, Jun. 2018, pp. 443–444, doi: 10.1109/ICHI.2018.00092.
- 14. K. Giri, S. Saraswat, A. K. Yadav, and S. Singh, “Classification of supraventricular arrhythmias using wavelet decomposition,” in 9th International Conference on Cloud Computing, Data Science & Engineering (Confluence), Noida, India, Jan. 2019, pp. 387-391, doi: 10.1109/CONFLUENCE.2019.8776624.
- 15. S. Raj and K. C. Ray, “Sparse representation of ECG signals for automated recognition of cardiac arrhythmias,” Expert Systems with Applications, vol. 105, pp. 49–64, 2018, doi: 10.1016/j.eswa.2018.03.038.
- 16. C. Lainscsek and T. J. Sejnowski, “Electrocardiogram classification using delay differential equations,” Chaos, vol. 23, no. 2, pp. 1–9, Jun. 2013, doi: 10.1063/1.4811544.
- 17. V. Mondéjar-Guerra, J. Novo, J. Rouco, M. G. Penedo, and M. Ortega, “Heartbeat classification fusing temporal and morphological information of ECGs via ensemble of classifiers,” Biomedical Signal Processing and Control, vol. 47, pp. 41–48, 2019, doi: 10.1016/j.bspc.2018.08.007.
- 18. A. Rajkumar, M. Ganesan, and R. Lavanya, “Arrhythmia classification on ECG using Deep Learning,” in 5th International Conference on Advanced Computing & Communication Systems (ICACCS), Coimbatore, India, Mar. 2019, pp. 365–369, doi: 10.1109/ICACCS.2019.8728362.
- 19. R. Nanjundegowda and V. A. Meshram, “Arrhythmia detection based on Hybrid features of T-wave in Electrocardiogram,” International Journal of Intelligent Engineering and Systems, vol. 11, no. 1, pp. 153–162, 2018, doi: 10.22266/ijies2018.0228.16.
- 20. J. Bogatinovski, D. Kocev, and A. Rashkovska, “Feature extraction for heartbeat classification in single-lead ECG,” in 42nd International Convention on Information and Communication Technology, Electronics and Microelectronics (MIPRO), Opatija, Croatia, 2019, pp. 320–325, doi: 10.23919/MIPRO.2019.8757135.
- 21. H. Shi, H. Wang, Y. Huang, L. Zhao, C. Qin, and C. Liu, “A hierarchical method based on weighted extreme gradient boosting in ECG heartbeat classification,” Computer Methods and Programs in Biomedicine, vol. 171, pp. 1–10, 2019, doi: 10.1016/j.cmpb.2019.02.005.
- 22. G. B. Moody and R. G. Mark, “The impact of the MIT-BIH arrhythmia database,” IEEE Engineering in Medicine and Biology Magazine, vol. 20, no. 3, pp. 45–50, May 2001, doi: 10.1109/51.932724.
- 23. American National Standards Institute, “Testing and reporting performance results of cardiac rhythm and ST segment measurement algorithms ANSI/AAMI EC57,” Association for the Advancement of Medical Instrumentation, 2012.
- 24. A. Mohsen, M. Al-Mahdawi, M. M. Fouda, M. Oogane, Y. Ando, and Z. M. Fadlullah, “AI aided noise processing of spintronic based IoT sensor for magnetocardiography application,” in IEEE International Conference on Communications (ICC), Dublin, Ireland, Jun. 2020, pp. 1-6, doi: 10.1109/ICC40277.2020.9148617.
- 25. X. Zeng and T. R. Martinez, “Distribution-balanced stratified cross-validation for accuracy estimation,” Journal of Experimental & Theoretical Artificial Intelligence, vol. 12, no. 1, pp. 1–12, 2000, doi: 10.1080/095281300146272.
- 26.“wfdb PyPI,” [Online]. Available: https://pypi.org/project/wfdb/. [Accessed: 14-Jun-2020].
- 27. J. Rogers and S. Gunn “Identifying feature relevance using a random forest,” in SubspaceLatent Structure and Feature Selection. SLSFS 2005. Lecture Notes in Computer Science C. Saunders, M. Grobelnik, S. Gunn J. Shawe-Taylor Ed. vol 3940. Springer, Berlin Heidelberg. doi: 10.1007/11752790_12.
- 28. T. Pan, J. Zhao, W. Wu, and J. Yang, “Learning imbalanced datasets based on SMOTE and Gaussian distribution,” Information Sciences., vol. 512, pp. 1214–1233, Feb. 2020, doi: 10.1016/j.ins.2019.10.048.