
Chapter 6. High CPU Load
My first SQL Server tuning project happened more than 20 years ago, and I’ve been dealing with many systems ever since. Over the years, I’ve noticed an interesting trend. Most of the systems I optimized in the past were I/O bound. Of course there were other problems, but reducing I/O load through query tuning and code refactoring was usually enough to get the job done.
This started to change several years ago. While I still see non-optimized and I/O intensive queries, their impact is masked by high-performance, low-latency flash-based drives. Moreover, the availability of cheap hardware allows for bigger servers that can handle the load from more users. The need to reduce high CPU load is quite common nowadays.
In this chapter, I will talk about several common patterns that increase CPU load and options to address it. I will start with non-optimized queries and inefficient database code. Next, I will cover query compilation overhead, along with plan caching, and the issues they can introduce. Finally, I will discuss the benefits and downsides of parallelism in systems and ways to tune your parallelism settings.
Non-Optimized Queries and T-SQL Code
Why does your server have a high CPU load? There are several possibilities, but I’ll start with the most obvious and common one: non-optimized queries. It does not matter how fast the disk subsystem is. Nor does it matter whether the servers have enough memory to cache all data in the buffer pool and eliminate all physical I/O. Non-optimized queries will increase CPU load.
To put things in perspective: a query that scans 10 million data pages uses a million times more CPU resources than a query that scans just 10 pages. It does not matter that each logical read takes just a few microseconds of CPU time: that adds up quickly when multiple users are running those queries in parallel.
You can detect CPU-intensive queries using the techniques I discussed in Chapter 4, such as sorting data by CPU (worker) time while choosing targets for optimization. Optimizing those queries will decrease CPU load.
Don’t confuse CPU time with duration, though. While queries with higher CPU time usually take longer to complete, the opposite is not true. A query may be blocked and use little CPU but still take a long time.
Note
Reducing query duration will improve users’ experience, but I rarely choose optimization targets based on this factor. Optimizing queries with high resource usage usually reduces duration as well.
Inefficient T-SQL Code
Inefficient T-SQL code also contributes to the problem. Except for natively compiled In-Memory OLTP modules, SQL Server interprets T-SQL code. This leads to additional CPU overhead.
Don’t get me wrong: I don’t want to discourage you from using stored procedures and T-SQL code. The benefits of properly designed and implemented T-SQL modules greatly overweight CPU overhead. But there’s one case I need to mention specifically – row-by-row processing.
Regardless of how you implement row-by-row processing – with cursors or with loops – it is inefficient. Imperative row-by-row execution will be slower and more CPU-intensive than declarative set-based logic. There are some rare cases when you absolutely have to implement row-by-row processing; however, avoid it when possible.
Statements that perform row-by-row processing may not always appear to be the most resource-intensive statements. You can look at plan cache-based execution statistics for T-SQL modules with sys.dm_exec_procedure_stats, sys.dm_exec_function_stats, and sys.dm_exec_trigger_stats views (discussed in Chapter 4) to detect the modules with the most cumulative resource usage. Analyze what they are doing, keeping an eye on row-by-row logic.
Other T-SQL constructs contribute to CPU load, too: for example, JSON and (especially) XML support are CPU-intensive. It is better to parse semi-structured data on the client side, rather than in SQL Server. It’s also easier and cheaper to scale application servers since you don’t need to pay the SQL Server licensing cost.
Be aware of CLR, external languages code, and extended stored procedures with complex logic. Avoid extensive function calls, especially with user-defined functions. They add overhead and may lead to less efficient execution plans when they are not inlined.
Pay attention to views usage. Depending on the database schema and definition, views may introduce unnecessary joins, accessing tables the queries do not need to access. This is especially common if the tables do not have proper foreign keys defined.
Scripts for Troubleshooting High CPU Load
I’d like to provide you with a couple of scripts that are helpful when troubleshooting high CPU load. The first, in Listing 6-1, shows you CPU load on the server during the last 256 minutes. The data is measured once per minute, so it may miss short CPU load bursts that occur in between measurements.
Example 6-1. Getting CPU Load History
DECLARE
  @now BIGINT;

SELECT @now = cpu_ticks / (cpu_ticks / ms_ticks)
FROM sys.dm_os_sys_info WITH (NOLOCK);
;WITH RingBufferData([timestamp], rec)
AS
(
  SELECT [timestamp], CONVERT(XML, record) AS rec
  FROM sys.dm_os_ring_buffers WITH (NOLOCK)
  WHERE
    ring_buffer_type = N'RING_BUFFER_SCHEDULER_MONITOR' AND
    record LIKE N'%<SystemHealth>%'
)
,Data(id, SystemIdle, SQLCPU, [timestamp])
AS
(
  SELECT
    rec.value('(./Record/@id)[1]', 'int')
    ,rec.value
     ('(./Record/SchedulerMonitorEvent/SystemHealth/SystemIdle)[1]','int')
    ,rec.value
     ('(./Record/SchedulerMonitorEvent/SystemHealth/ProcessUtilization)[1]','int')
    ,[timestamp]
  FROM RingBufferData
)
SELECT TOP 256
  dateadd(MS, -1 * (@now - [timestamp]), getdate()) AS [Event Time]
  ,SQLCPU AS [SQL Server CPU Utilization]
  ,SystemIdle AS [System Idle]
  ,100 - SystemIdle - SQLCPU AS [Other Processes CPU Utilization]
FROM Data
ORDER BY id desc
OPTION (RECOMPILE, MAXDOP 1);
Figure 6-1 illustrates the output of the code. Data in the [Other Processes CPU Utilization] column shows CPU load in the system outside of SQL Server. If that load is significant, analyze what processes are running on the server and generating it.
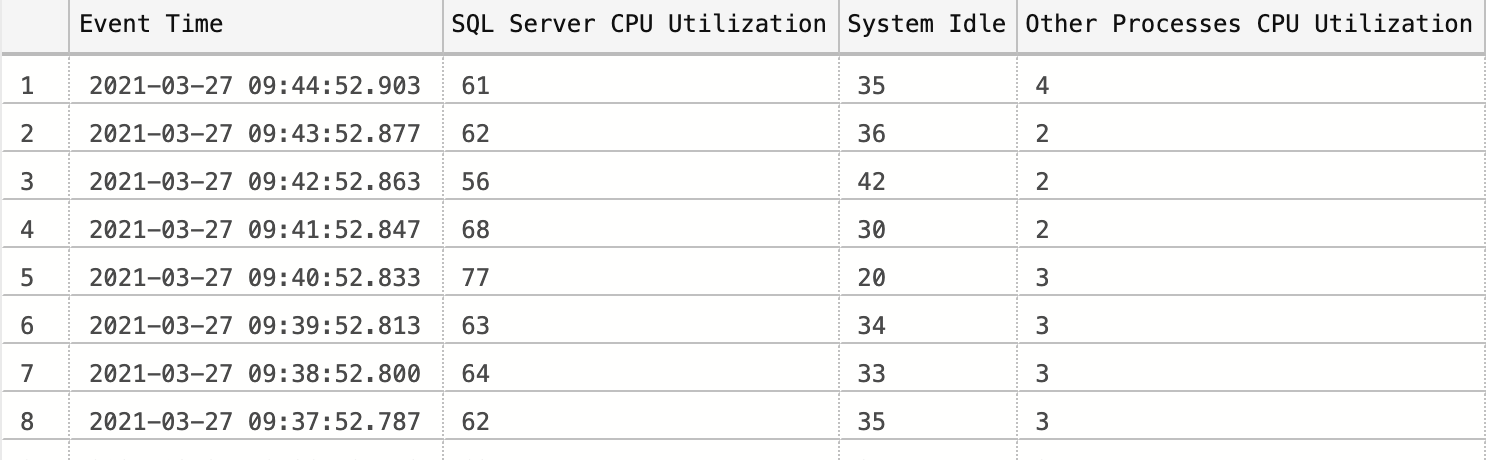
Figure 6-1. Script output showing CPU load history
Listing 6-2 helps you analyze CPU load per database. This may be beneficial when your server hosts multiple databases, and you are considering splitting the busy ones between different servers. (Please note: This script uses plan cache data, so the output is imprecise.)
Example 6-2. Per-database CPU Load
;WITH DBCPU
AS
(
    SELECT
        pa.DBID, DB_NAME(pa.DBID) AS [DB]
        ,SUM(qs.total_worker_time/1000) AS [CPUTime]
    FROM
        sys.dm_exec_query_stats qs WITH (NOLOCK)
        CROSS APPLY
        (
            SELECT CONVERT(INT, value) AS [DBID]
            FROM sys.dm_exec_plan_attributes(qs.plan_handle)
            WHERE attribute = N'dbid'
        ) AS pa
    GROUP BY pa.DBID
)
SELECT
    [DB]
    ,[CPUTime] AS [CPU Time (ms)]
    ,CONVERT(decimal(5,2), 1. *[CPUTime] /
        SUM([CPUTime]) OVER() * 100.0) AS [CPU Percent]
FROM DBCPU
WHERE DBID <> 32767 -- ResourceDB
ORDER BY [CPUTime] DESC;
Figure 6-2 shows the output from a production server.
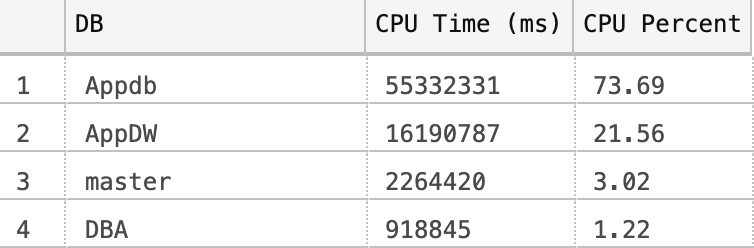
Figure 6-2. Script output showing CPU load per database
Non-Optimized Query Patterns to Watch For
In case of non-optimized queries, there are two distinct patterns that can trigger high CPU load. I call them “the worst offenders” and “death by a thousand cuts.” (This terminology is by no means standard – it’s just how I like to differentiate between them.)
The worst offenders
The “worst offenders” occur when you have one or more expensive, long-running queries that generate heavy CPU load: think of non-optimized queries with parallel execution plans that scan millions of rows and perform sorting and aggregation. They can bring a server to its knees, especially if you have several running simultaneously.
Fortunately, it is easy to detect the worst offenders in real time by querying the sys.dm_exec_requests view and analyzing the cpu_time column. (You can use the code from Listing 2-3 in Chapter 2 to do that.)
WARNING BOX
A word of caution: The code in Listing 2-3 filters out system processes with a session_id below 50. In some cases, you might want to remove this filter and analyze all sessions running on the server. Keep in mind that some sessions may have been running since SQL Server startup and have high cumulative cpu_time: pay attention to the request start time.
Death by a thousand cuts
With the second pattern, “death by a thousand cuts,” the load on the server is generated by a large number of simultaneously running requests. Each request may be relatively small and even optimized; however, the sheer number of requests drives CPU usage and server load up.
This case is more challenging to handle. While query optimization (covered in Chapter 5) may help, you’ll likely have to optimize a large number of queries consuming significant time and effort. It often requires refactoring database schemas, code, and applications on a massive scale to achieve results.
In the end, you have to reduce the load on the server to address the problem. Let’s talk about several other factors that can increase that load, starting with the query compilation and plan caching processes.
Query Compilation and Plan Caching
Every time you submit a query to the system, SQL Server needs to compile and optimize it. This process is resource intensive, so SQL Server tries to minimize the number of compilations by caching execution plans for later reuse. In addition to regular client queries and batches, it caches plans of various objects, such as stored procedures, triggers, and user-defined functions. The memory area where these are stored is called the plan cache.
SQL Server uses different algorithms to determine which plans to remove from the cache in case of memory pressure. For ad-hoc queries, this selection is based on how often the plan is reused. For other types of plans, the cost of plan generation is also factored into the decision.
SQL Server recompiles queries when it suspects that currently cached plans are no longer valid. This may happen if the plan references objects whose schemas have changed, or because of stale statistics. SQL Server checks to see if the statistics are outdated when it looks up a plan from the cache, and it recompiles the query if they are. That recompilation, in turn, triggers a statistics update.
Plan caching and reuse can significantly reduce the number of compilations and the CPU load, as I will demonstrate later in the chapter. However, it can also introduce problems. Let’s look at some of the most common issues that arise, starting with parameter sensitivity in parameter-sensitive plans. (This is sometimes called parameter sniffing, which just describes the SQL Server behavior that leads to that issue).
Parameter-Sensitive Plans
Except for some trivial queries, SQL Server always offers multiple options for generating the execution plan for the query. It can use different indexes to access data, select different join types, and choose among operators and execution strategies.
By default, SQL Server analyzes (sniffs) parameter values at the time of optimization and generates and caches an optimal plan for those values. Nothing is wrong with this behavior—though it can, if your data is unevenly distributed, lead to a cached plan that is optimal for atypical, rarely used parameter values but highly inefficient for queries with more common parameters.
I’m sure we’re all experienced a situation where some queries or stored procedures suddenly started taking much longer to complete, even though there were no recent changes in the system. In most cases, these situations happen when queries are recompiled after a statistics update, due to parameter sniffing.
Let me show you an example. The script in Listing 6-3 creates a table and populates it with 1 million rows, evenly distributed across 10 StoreId values (a little more than 100,000 rows per StoreId), along with 10 rows with a StoreId of 99.
Example 6-3. Parameter-sensitive plans: Table creation
CREATE TABLE dbo.Orders
(
    OrderId INT NOT NULL IDENTITY(1,1),
    OrderNum VARCHAR(32) NOT NULL,
    CustomerId UNIQUEIDENTIFIER NOT NULL,
    Amount MONEY NOT NULL,
    StoreId INT NOT NULL,
    Fulfilled BIT NOT NULL
);
;WITH N1(C) AS (SELECT 0 UNION ALL SELECT 0) -- 2 rows
,N2(C) AS (SELECT 0 FROM N1 AS T1 CROSS JOIN N1 AS T2) -- 4 rows
,N3(C) AS (SELECT 0 FROM N1 AS T1 CROSS JOIN N2 AS T2) -- 16 rows
,N4(C) AS (SELECT 0 FROM N1 AS T1 CROSS JOIN T2 CROSS JOIN N2 AS T3) -- 1024 rows
,N5(C) AS (SELECT 0 FROM N1 AS T1 CROSS JOIN N4 AS T2 ) -- 1,048,576 rows
,IDs(ID) AS (SELECT ROW_NUMBER() OVER (ORDER BY (SELECT NULL)) FROM N5)
INSERT INTO dbo.Orders(OrderNum, CustomerId, Amount, StoreId, Fulfilled)
    select
        'Order: ' + convert(varchar(32),ID)
        ,newid()
        ,ID % 100
        ,ID % 10
        ,1
    from IDs;
INSERT INTO dbo.Orders(OrderNum, CustomerId, Amount, StoreId, Fulfilled)
	select top 10 OrderNum, CustomerId, Amount, 99, 0
	from dbo.Orders
	order by OrderId;
CREATE UNIQUE CLUSTERED INDEX IDX_Orders_OrderId
ON dbo.Orders(OrderId);
CREATE NONCLUSTERED INDEX IDX_Orders_CustomerId
ON dbo.Orders(CustomerId);
CREATE NONCLUSTERED INDEX IDX_Orders_StoreId
ON dbo.Orders(StoreId);
Next, let’s create a stored procedure that calculates the total sales amount for a specific store (Listing 6-4). I’m using a stored procedure in this example; however, parameterized queries called from client applications would behave the same way.
Listing 6-4. Parameter-sensitive plans: Stored procedure
CREATE PROC dbo.GetTotalPerStore(@StoreId int)
AS
    SELECT SUM(Amount) as [Total Amount]
    FROM dbo.Orders
    WHERE StoreId = @StoreId;
With the current data distribution, when the stored procedure is called with any @StoreId other than 99, the optimal execution plan involves scanning the clustered index in the table. However, if @StoreId=99, a better execution plan would be to use an index seek on IDX_Orders_StoreId index, with the key lookup afterwards.
Let’s call the stored procedure twice: the first time with @StoreId=5 and the second time with @StoreId=99, as shown in Listing 6-5.
Example 6-5. Parameter-sensitive plans: Calling the procedure (Test 1)
EXEC dbo.GetTotalPerStore @StoreId = 5;
EXEC dbo.GetTotalPerStore @StoreId = 99;
As you can see from the execution plan in Figure 6-3, SQL Server compiles the stored procedure, caches the plan with the first call, and reuses the plan later. Even though this plan is less efficient for the second call with @StoreId=99, it may be acceptable when those calls are rare, which is expected with such a data distribution.
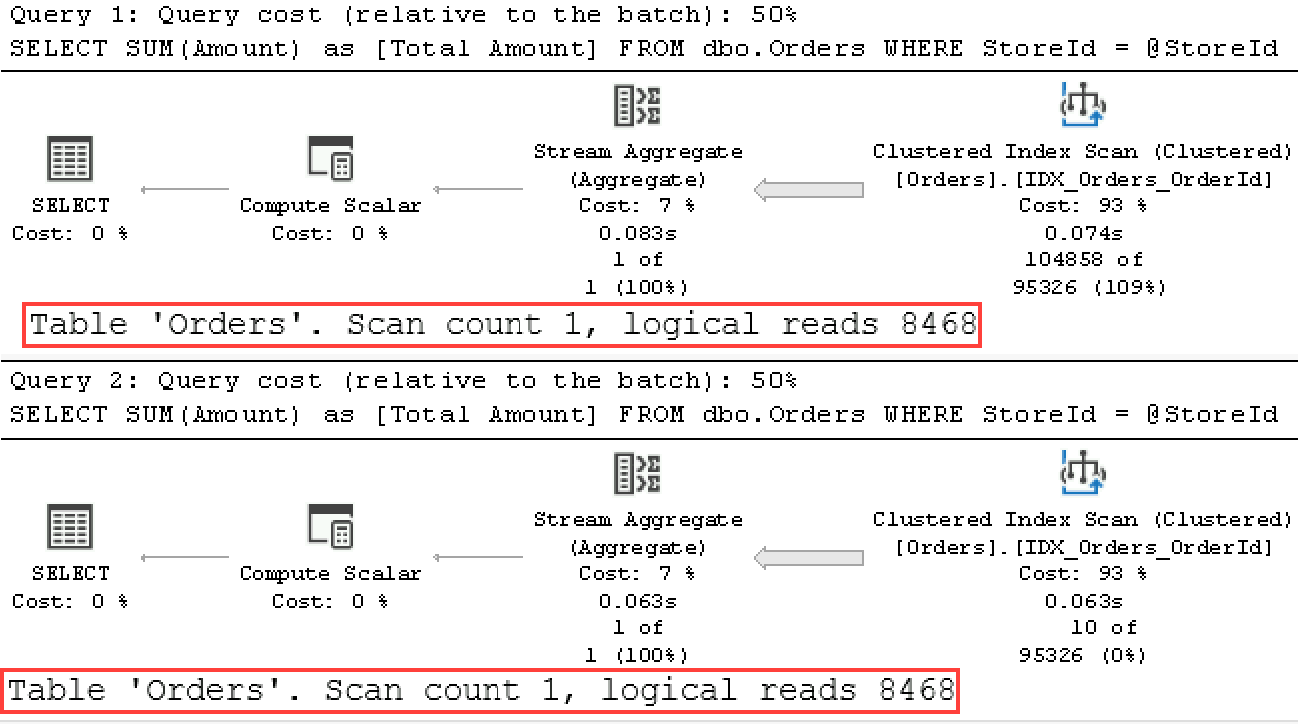
Figure 6-3. Execution plans of the queries (Test 1).
Now let’s take a look at what happens if we swap those calls when the plan is not cached (Listing 6-6). I am clearing the plan cache with the DBCC FREEPROCCACHE command – do not run this demo on a production server! Note, however, that the same thing can happen when a statistics update triggers the query to recompile.
Example 6-6. Parameter-sensitive plans: Calling the procedure (Test 2)
DBCC FREEPROCCACHE;
EXEC dbo.GetTotalPerStore @StoreId = 99;
EXEC dbo.GetTotalPerStore @StoreId = 5;
As you can see in Figure 6-4, SQL Server now caches the plan compiled for the @StoreId=99 parameter value. Even though this plan is more efficient when the stored procedure is called with this parameter, it is highly inefficient for other @StoreId values.
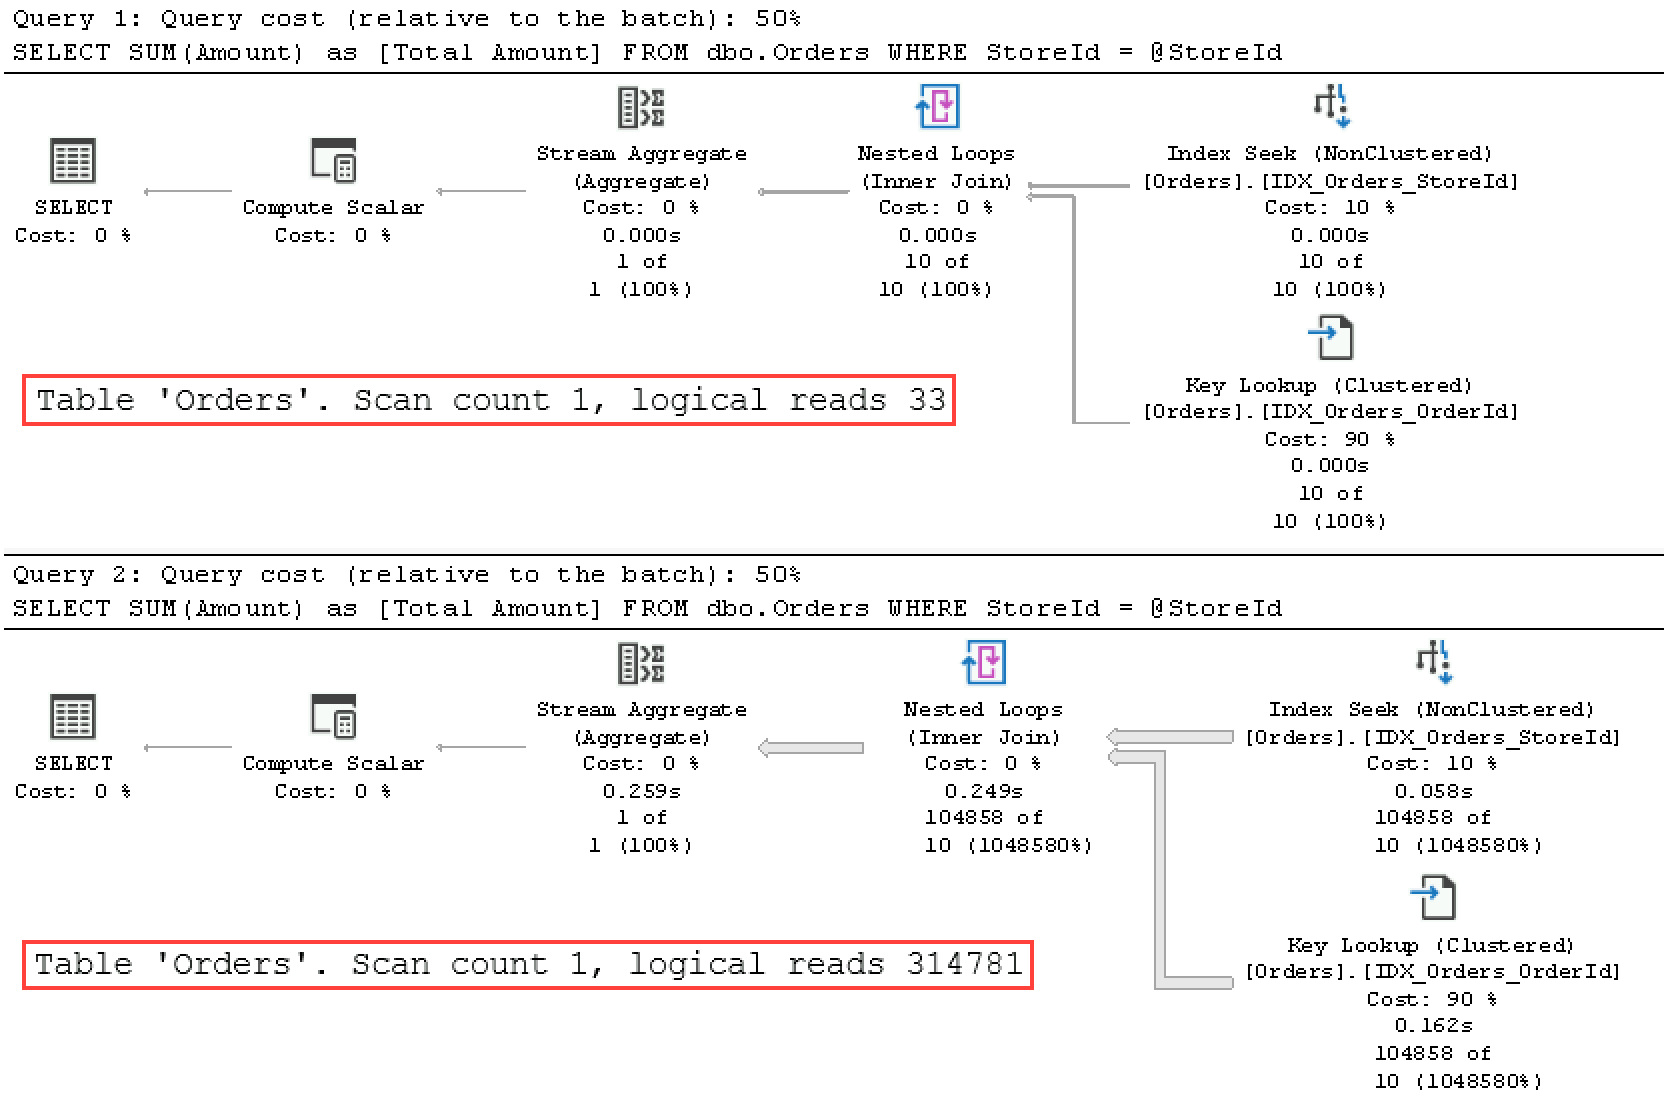
Figure 6-4. Execution plans of the queries (Test 2).
Inefficient parameter-sensitive plans often become the “worst offender” queries that drive CPU load up. As I mentioned, you can detect those queries with the sys.dm_exec_requests view (Listing 2-3) and recompile them to remediate the issue.
You can force stored procedures and other T-SQL modules to recompile with the sp_recompile stored procedure. For ad-hoc queries, you can call DBCC FREEPROCCACHE, providing plan_handle or sql_handle as the parameter. Finally, if you have Query Store enabled, you can force a more efficient query execution plan there.
Obviously, it is better to address the root cause of the issue. First, see if there are any opportunities for query tuning, which would eliminate the plans’ parameter sensitivity. We usually end up with parameter-sensitive plans because there are no efficient plans that do not depend on parameter values. For example, if you have the Amount column included to the IDX_Orders_StoreId index, that index would become covering. SQL Server can use it for all parameter values regardless of how many rows will be read, because the Key Lookup operation will no longer be required.
If you are using SQL Server 2017 or above, you can benefit from automatic plan correction, which is part of the automatic tuning technology. When this feature is enabled, SQL Server can detect parameter sniffing issues and automatically force the last known good plan that was used before regression occurred.
Automatic plan correction relies on the Force Plan feature of Query Store and, as you can guess, requires Query Store to be enabled in the database. Moreover, you need to enable it in the database with ALTER DATABASE SET AUTOMATIC_TUNING (FORCE_LAST_GOOD_PLAN = ON) statement. You can read more about it in the Microsoft documentation.
If neither of those options works, you can force the recompilation of either stored procedure using EXECUTE WITH RECOMPILE or a statement-level recompile with OPTION (RECOMPILE) clauses. Listing 6-7 shows the latter approach.
Example 6-7. Parameter-sensitive plans: Statement-level recompile
ALTER PROC dbo.GetTotalPerStore(@StoreId int)
AS
    SELECT SUM(Amount) as [Total Amount]
    FROM dbo.Orders
    WHERE StoreId = @StoreId
	OPTION (RECOMPILE);
GO
EXEC dbo.GetTotalPerStore @StoreId = 99;
EXEC dbo.GetTotalPerStore @StoreId = 5;
Figure 6-5 shows that SQL Server recompiles the query sniffing parameters during each call.
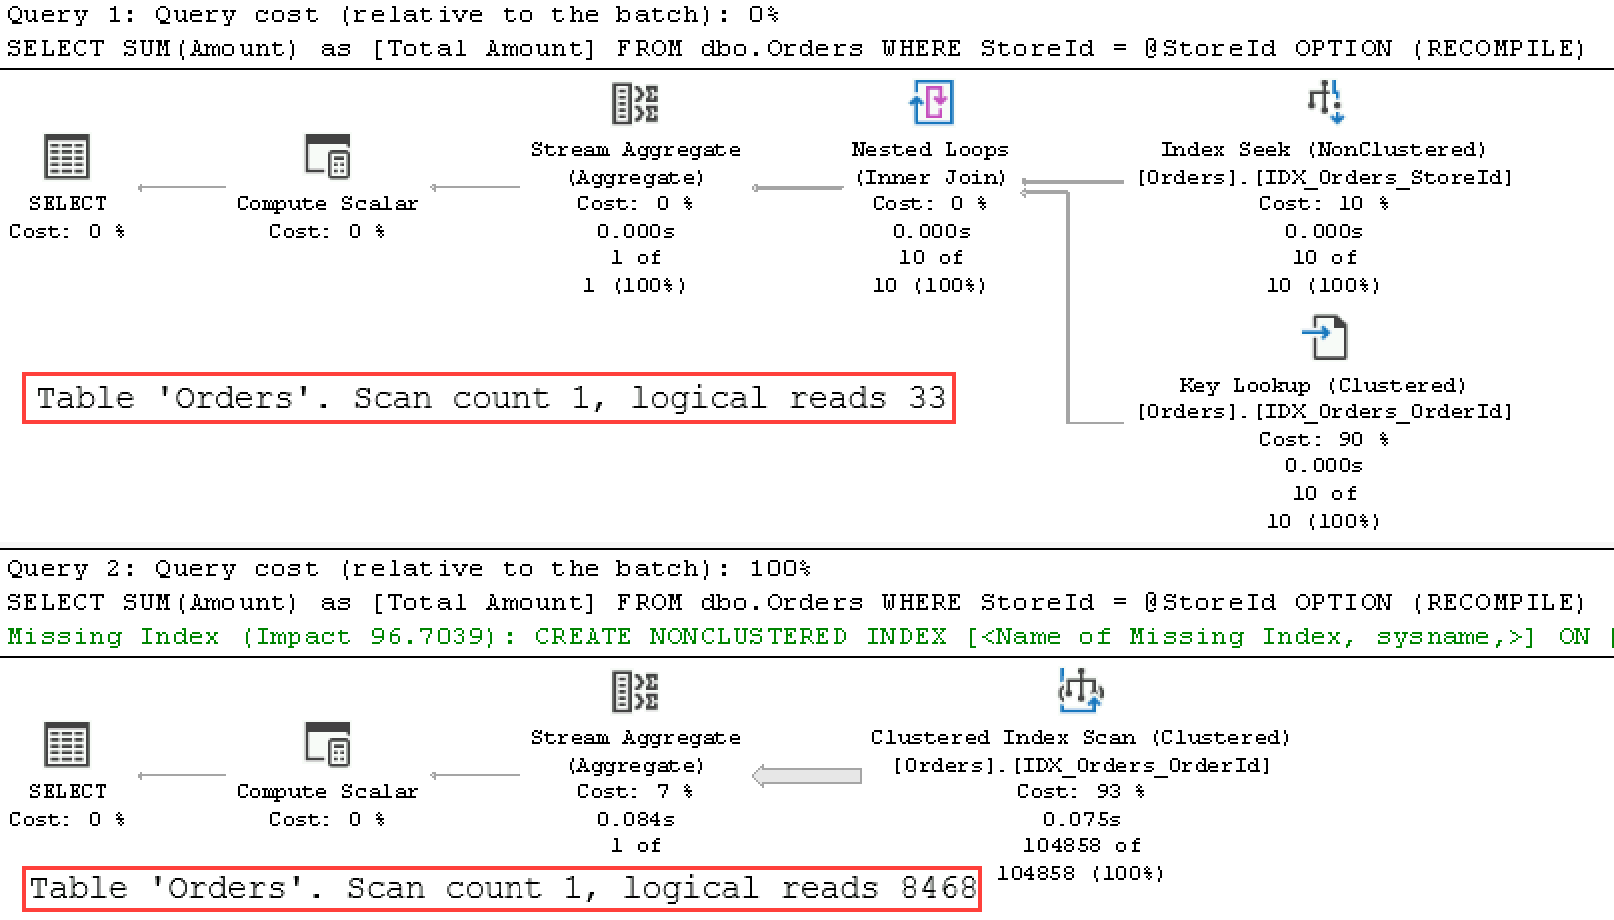
Figure 6-5. Execution plans of the queries (statement-level recompile).
Forcing the recompile will allow you to get the most efficient execution plans on each call—at the cost of constant recompilation overhead. This approach may be completely acceptable with infrequently executed queries; however, with frequently executed ones it may lead to noticeable CPU increase, as I’ll show later in the chapter.
You can address this by utilizing another hint – OPTIMIZE FOR. This hint allows you to specify parameter values for Query Optimizer to use during optimization. For example, with OPTIMIZE FOR (@StoreId=5) hint, Query Optimizer will not sniff @StoreId, instead optimizing it for the value of 5 all the time.
As you can guess, the danger of using the OPTIMIZE FOR hint is that data distribution changes. For example, if the store with @StoreId=5 went out of business, you’d end up with highly inefficient execution plans.
Fortunately, there is another form of this hint: OPTIMIZE FOR UNKNOWN. With this hint, SQL Server performs an optimization based on the most statistically common value in the table. In our case, this hint would lead to the plan with clustered index scan, which is expected with data distribution in the table.
You can use the hints OPTIMIZE FOR UNKNOWN (in all SQL Server versions after 2008) or DISABLE_PARAMETER_SNIFFING (in SQL Server 2016 and up) on the query level. Both hints are essentially the same. In SQL Server 2016, you can also control it at the database level with the PARAMETER_SNIFFING database option. Finally, you can disable parameter sniffing on the server-level with trace flag T4136. This trace flag also works in SQL Server versions prior to 2016.
Note
In my experience, disabling parameter sniffing leads to better and more stable execution plans in multi-tenant systems and systems with very uneven data distribution. Your mileage may vary, but it’s worth trying if you see a large number of parameter-sensitive plans in your system.
Caching inefficient parameter-sensitive plans increases CPU load. Unfortunately, that’s not the only issue you can encounter with plan caching.
Parameter-Value Independence
Cached execution plans need to be valid for all possible combinations of parameters in future calls. As a result, even with parameter sniffing, SQL Server will not generate an execution plan that cannot be used with some parameters in the future when SQL Server expects to cache it.
This sounds a bit confusing, so let me demonstrate it with a simple example. Listing 6-8 shows a very common (and very bad) pattern: the stored procedure accepts optional parameters, using a single query to cover them all.
Example 6-8. Parameter-Value Independence
CREATE PROC dbo.SearchOrders
(
    @StoreId INT
    ,@CustomerId UNIQUEIDENTIFIER
)
AS
    SELECT OrderId, CustomerId, Amount, Fulfilled
    FROM dbo.Orders
    WHERE
        ((@StoreId IS NULL) OR (StoreId = @StoreId)) AND
        ((@CustomerId IS NULL) OR (CustomerId = @CustomerId));
GO
EXEC dbo.SearchOrders
    @StoreId = 99
    ,@CustomerId = 'A65C047D-5B08-4041-B2FE-8E3DD6570B8A';
Regardless of what parameters you are using at the time of compilation, you will get a plan similar to the one shown in Figure 6-6. Even though there are indexes and SARGable predicates on both the CustomerId and StoreId columns, SQL Server uses the Index Scan operation instead of Index Seek. Unfortunately, SQL Server cannot use index seek because the plan needs to be cached and reused in the future; this plan would not be valid if the seek predicate (@StoreId parameter in the plan below) was not provided.
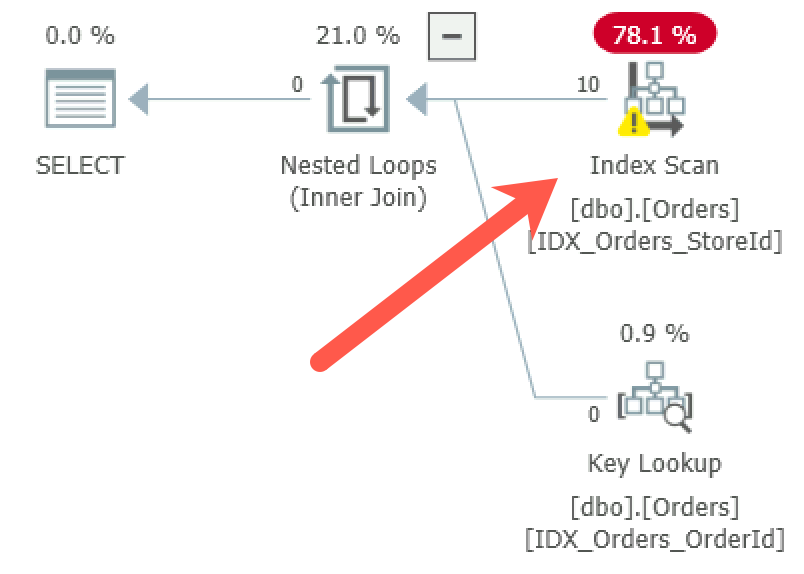
Figure 6-6. Parameter-value independence: Execution plan of the stored procedure
The statement-level recompile addresses the problem, again at the cost of additional compilation overhead. As noted, this overhead may be acceptable for infrequently executed queries.
As another option, you could rewrite the code using IF statements that cover all possible combinations of parameters. If you did, SQL Server would cache the plan for each statement. It would work in simple cases, but would quickly become unmanageable as the number of parameters grows.
Finally, writing the code using dynamic SQL is a completely valid option in many cases. (Listing 6-9 shows how to do that.) Be careful, of course, and utilize parameters to prevent SQL injection.
Example 6-9. Dynamic SQL implementation
ALTER PROC dbo.SearchOrders
(
    @StoreId INT
    ,@CustomerId UNIQUEIDENTIFIER
)
AS
BEGIN
    DECLARE
        @SQL nvarchar(max) =
 N'SELECT OrderId, CustomerId, Amount, Fulfilled
 FROM dbo.Orders
 WHERE
    (1=1)' +
    IIF(@StoreId IS NOT NULL, N'AND (StoreId = @StoreId)','') +
    IIF(@CustomerId IS NOT NULL, N'AND (CustomerId = @CustomerId)','');
    EXEC sp_executesql
        @SQL = @SQL
        ,@Params = N'@StoreId INT, @CustomerId UNIQUEIDENTIFIER'
        ,@StoreId = @StoreId, @CustomerId = @CustomerId;
END
There are other times when caching and reusing plans may lead to inefficient plans. One case, which is often overlooked, involves filtered indexes.
The query in Listing 6-10 will not use a filtered index even if you call it with @Fulfilled = 0 value. This happens because the cached execution plan that uses the filtered index will not be valid for @Fulfilled = 1 calls.
Example 6-10. Query that would not use filtered index
CREATE NONCLUSTERED INDEX IDX_Orders_ActiveOrders_Filtered
ON dbo.Orders(OrderId)
INCLUDE(Fulfilled)
WHERE Fulfilled = 0;
GO
DECLARE
    @Fulfilled bit = 0;
SELECT COUNT(*) AS [Active Order Count]
FROM dbo.Orders
WHERE Fulfilled = @Fulfilled;
Note
Always add all columns from the filter to either key or included columns in filtered indexes. This leads to more efficient execution plans.
Unfortunately, this problem can also occur due to auto-parameterization, which I will discuss later in the chapter. But first, let’s look at compilations and the overhead they introduce.
Compilation and Parameterization
As you know, SQL Server caches and reuses execution plans for T-SQL modules and ad-hoc client queries and batches. For ad-hoc queries, however, the plans are reused only for identical queries. There are a few factors that dictate that.
First, identical queries need to be exactly the same: a complete character-for-character match. Look at the queries in Listing 6-11. Only two are identical (the first and second), even though all of these queries are logically the same.
Example 6-11. Identical queries
SELECT COUNT(*) FROM dbo.Orders WHERE StoreId = 99;
SELECT COUNT(*) FROM dbo.Orders WHERE StoreId = 99;
SELECT COUNT(*) FROM dbo.Orders WHERE StoreId=99;
select count(*) from dbo.Orders where StoreId = 99;
In addition, some of the SET options affect plan reuse, including ANSI_NULL_DLFT_OFF, ANSI_NULL_DLFT_ON, ANSI_NULL, ANSI_PADDING, ANSI_WARNING, ARITHABORT, CONCAT_NULL_YELDS_NULL, DATEFIRST, DATEFORMAT, FORCEPLAN, DATEFORMAT, LANGUAGE, NO_BROWSETABLE, NUMERIC_ROUNDABORT, and QUOTED_IDENTIFIER. Plans generated with one set of SET options cannot be reused by sessions that use a different set of SET options.
You’ve probably noticed that I keep emphasizing the point that query compilation and optimization processes are resource intensive and may introduce significant CPU load with a heavy ad-hoc workload. To demonstrate this, I have created a small application that runs simple queries from Listing 6-12 in a loop in multiple threads. You can download it from the companion materials of the book.
In the first test case, the application runs ad-hoc queries using non-parameterized CustomerId values (the queries are constructed in the application). Each query in the call is unique and needs to be compiled. The second test, on the other hand, uses parameterized query. The plan for this query can be reused across calls.
Example 6-12. Ad hoc versus parameterized workload
-- Test Case 1
SELECT TOP 1 OrderId
FROM dbo.Orders
WHERE CustomerId = '<ID Generated in the app>';
-- Test Case 2
SELECT TOP 1 OrderId
FROM dbo.Orders
WHERE CustomerId = @CustomerId;
Both of the queries are extremely light. Moreover, I ran them in the test environment with enough memory to cache the entire table and eliminate physical I/O.
Figure 6-7 illustrates the performance metrics collected during the tests. As you can see, during the second test (on the right), the system was able to handle almost 6 times more requests per second than during the first test.
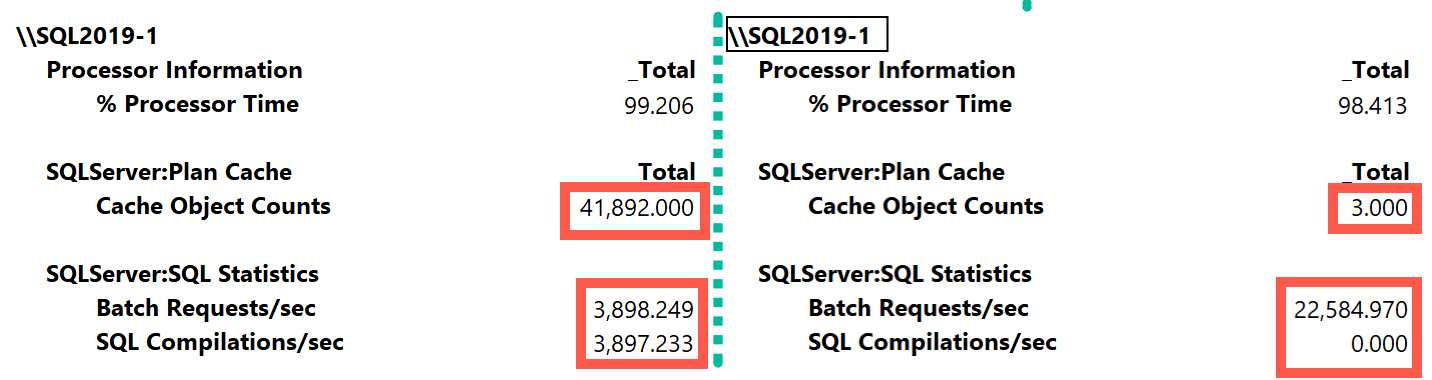
Figure 6-7. Ad hoc versus parameterized workload throughput
Obviously, this scenario is completely synthetic; in real life, you are unlikely to see a situation where SQL Server has to spend majority of its time compiling queries. Nevertheless, in systems with heavy ad-hoc workloads, the impact of compilations can be very significant. In addition to CPU load, there is also an impact on memory, which I will discuss in the next chapter.
There are three SQL Server: SQL Statistics performance counters that can help you to see system throughput and number of compilations.
- Batch Requests/sec
-
Batch Requests/sec counter shows the number of batches SQL Server receives per second. Higher values indicate higher system load and throughput.
- SQL Compilations/sec
-
SQL Compilations/sec counter shows how many compilations SQL Server performs every second. The higher this number is, the more compilations and, therefore, the more overhead you have.
- SQL Re-Compilations/sec
-
SQL Re-Compilations/sec counter gives you the number of recompilations for already cached execution plans. This may happen due to frequent changes in underlying data in both users and temporary tables.
In a properly tuned OLTP system, the number of compilations and recompilations should be just a fraction of the total number of batch requests. If that is not the case, analyze and reduce the compilations. (We will talk about how to analyze plan cache data in the next chapter.)
Non-parameterized, ad-hoc client queries are the most common cause of compilations. As you can guess, the best approach is changing the queries and parameterizing them. Unfortunately, this usually requires you to change the client code, which is not always possible.
Fortunately, there is another option: auto-parameterization.
Auto-Parameterization
SQL Server tries to reduce compilation overhead by replacing constants in ad-hoc queries with parameters and cache compiled plans as if the queries were parameterized. When this happens, similar ad-hoc queries that use different constants can reuse cached plans.
Let’s look at the example and run the queries in Listing 6-13. As before, I am clearing the plan cache with the DBCC FREEPROCCACHE command to reduce the size of the output.
Example 6-13. Auto-parameterization
DBCC FREEPROCCACHE
GO
SELECT * FROM dbo.Orders WHERE OrderId = 1;
GO
SELECT * FROM dbo.Orders WHERE OrderId = 2;
GO
SELECT
    p.usecounts, p.cacheobjtype, p.objtype, p.size_in_bytes, t.[text]
FROM
    sys.dm_exec_cached_plans p CROSS APPLY
        sys.dm_exec_sql_text(p.plan_handle) t
WHERE
    p.cacheobjtype LIKE 'Compiled Plan%' AND
    t.[text] LIKE '%Orders%'
ORDER BY
    p.objtype DESC
OPTION (RECOMPILE);
Figure 6-8 shows the output of the last statement from the code. As you can see, there are three entries in the plan cache: a compiled plan used for both auto-parameterized ad-hoc queries, and two other objects called shell queries. Each shell query uses about 16KB of memory and stores information about the original ad-hoc query and links it to the compiled plan.
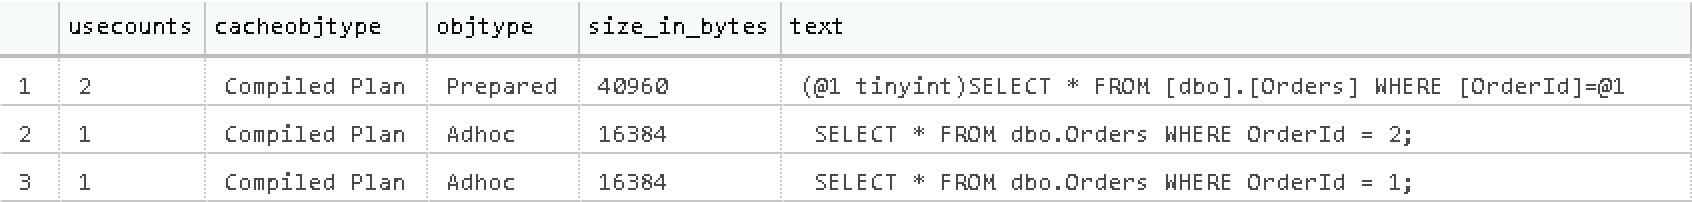
Figure 6-8. Plan cache after auto-parameterization
Simple parameterization
By default, SQL Server uses SIMPLE parameterization, and it is very conservative in parameterizing queries. Simple parameterization only happens when a cached plan is considered safe to parameterize. This means that the plan would have the same shape and cardinality estimations, even when constant or parameter values change.
For example, a plan with a nonclustered index seek and key lookup on a unique index is safe because nonclustered index seek would never return more than one row, regardless of parameter value. However, the same operation on a non-unique index is not safe. Different parameter values would lead to different cardinality estimations; this could make a clustered index scan the better option for some parameter values.
Moreover, there are many language constructs that prevent simple parameterization, including IN, TOP, DISTINCT, JOIN, UNION, and subqueries. In practice, this means the majority of queries will not be auto-parameterized.
Forced Parameterization
Alternatively, SQL Server can use FORCED parameterization. This can be enabled at the database level with the ALTER DATABASE SET PARAMETRIZATION FORCED command, or at the query level with a PARAMETRIZATION FORCED hint. In this mode, SQL Server auto-parameterizes most ad-hoc queries (with very few exceptions).
Figure 6-9 shows results of the first test case (non-parameterized ad-hoc queries) from Listing 6-12 after I enable forced parameterization in the database. While the system throughput is still significantly lower than with a properly parameterized workload, it is much better than with simple parameterization (Figure 6-7) that did not auto-parameterize the query. SQL Server still needs to spend CPU time to auto-parameterize queries; however, it can reuse the cached execution plan and does not need to optimize all queries.
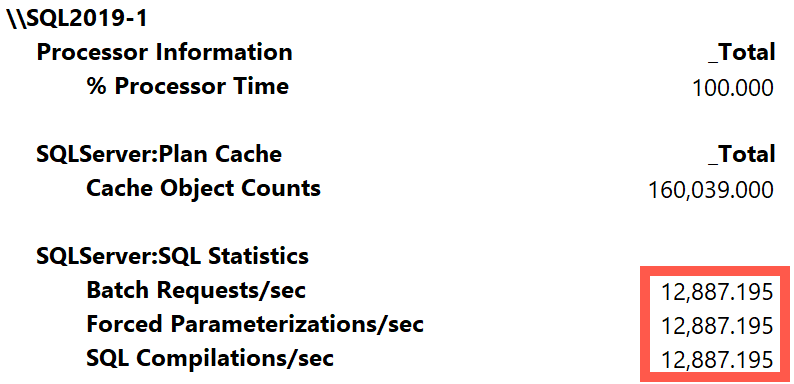
Figure 6-9. Throughput with forced parameterization
Enabling forced parameterization may significantly reduce compilation overhead and CPU load in systems with heavy ad-hoc workload. You will of course get different results in different systems, but I’ve had a few cases where enabling forced parameterization reduced CPU load by as much as 25 to 30%.
Forced parameterization has its downsides, though. When it is enabled, SQL Server starts to auto-parameterize the majority of ad-hoc queries, which will open the door to parameter-sensitive plans and parameter-sniffing-related issues. You can expect some ad-hoc queries to regress because of that.
Note
I recommend that you consider disabling parameter sniffing after you enable forced parameterization. While this may not be the best option for every system, I have found it helpful in most cases.
Fortunately, you are not always forced to take an all-or-nothing approach. As I mentioned, you can enable forced parameterization on the query level with the PARAMETERIZATION FORCED query hint. This is useful when you have just a handful of non-parameterized ad-hoc queries and do not want to enable forced parameterization globally.
If you don’t have access to the source code, you can force the hint through plan guides. Listing 6-14 shows how to do that. It uses two stored procedures. The first, sp_get_query_template, creates the query template based on the sample query provided as parameter. You can use any constant values in an ad-hoc query for template creation. The second procedure, sp_create_plan_guide, creates the plan guide.
Example 6-14. Applying forced parameterization through a plan guide
DECLARE
    @stmt nvarchar(max)
    ,@params nvarchar(max)
    ,@query nvarchar(max) =
N’SELECT TOP 1 OrderId FROM dbo.Orders WHERE CustomerId = ‘’B970D68B-F88E-438B-9B04-6EDE47CC1D9A’’’;
EXEC sp_get_query_template
    @querytext = @query
    ,@templatetext = @stmt output
    ,@params = @params output;

EXEC sp_create_plan_guide
    @type = N’TEMPLATE’
    ,@name = N’forced_parameterization_plan_guide’
    ,@stmt = @stmt
    ,@module_or_batch = null
    ,@params = @params
    ,@hints = N’OPTION (PARAMETERIZATION FORCED)’;
You can download the test application from this book’s companion materials and repeat the load tests to validate that the plan guide is working in a database that uses SIMPLE parameterization.
In some cases, you need to do the opposite and force simple parameterization for specific queries in the database that use forced parameterization. This can happen when some ad-hoc queries have parameter-sensitive plans. Listing 6-15 shows how you can force simple parameterization through the plan guide, allowing the ad-hoc query to utilize filtered index. You need to provide the statement to sp_create_plan_guide stored procedure as if it already had been auto-parameterized. You can obtain it from the plan cache, as shown in the listing, along with the parameters of the statement.
The first query in Listing 6-15 is the one to which I am applying the plan guide.
Example 6-15. Applying simple parameterization through a plan guide
SELECT OrderId
FROM dbo.Orders
WHERE Fulfilled = 0;
GO
SELECT
    SUBSTRING(qt.text, (qs.statement_start_offset/2)+1,
    ((
        CASE qs.statement_end_offset
            WHEN -1 THEN DATALENGTH(qt.text)
            ELSE qs.statement_end_offset
        END - qs.statement_start_offset)/2)+1) AS SQL
    ,qt.text AS [Full SQL]
FROM
    sys.dm_exec_query_stats qs with (nolock)
        CROSS APPLY sys.dm_exec_sql_text(qs.sql_handle) qt
WHERE
    qt.text like '%Fulfilled%'
OPTION(RECOMPILE, MAXDOP 1);
DECLARE
    @stmt nvarchar(max) =
        N'select OrderId from dbo . Orders where Fulfilled = @0'
    ,@params nvarchar(max) = N'@0 int'

-- Creating plan guide
EXEC sp_create_plan_guide
    @type = N'TEMPLATE'
    ,@name = N'simple_parameterization_plan_guide'
    ,@stmt = @stmt
    ,@module_or_batch = null
    ,@params = @params
    ,@hints = N'OPTION (PARAMETERIZATION SIMPLE)';
SQL Server does not auto-parameterize queries in stored procedures and other T-SQL modules. You can move some ad-hoc queries to stored procedures, avoiding parameter-sensitivity issues when forced parameterization is enabled.
Finally, I’d like to reiterate: recompilations may lead to significant CPU overhead in systems with heavy ad-hoc workloads. Pay attention to it!
Parallelism
SQL Server uses parallelism to speed up execution of complex queries by splitting the queries across multiple CPUs (workers). It improves user experience by completing queries faster. However, there ain’t such a thing as a free lunch: parallelism always comes with overhead. With parallel execution plans, SQL Server needs to do additional work, splitting and merging the data across multiple workers and managing their execution.
Assume that a query finishes in 1 second, with the serial execution plan using the same 1,000ms of worker time. The same query may complete in 300ms with a parallel four-CPU plan, consuming 1,050ms of worker time in total. Managing parallelism requires SQL Server to perform extra work, and cumulative CPU time will always be higher than in the serial plan.
That overhead may impact throughput in busy OLTP systems. Faster execution time for a single query does not matter much, since there are many other queries waiting for CPUs in the queue. The overhead of parallelism forces them to wait longer for a CPU to become available. Although parallelism is good in complex reporting and analytical workloads, it can become a problem in OLTP systems, especially when the server operates under high CPU loads.
Unfortunately, it is extremely hard to find a system that does not mix both workloads. Even when you implement a dedicated data warehouse and operational data store (ODS), there will still be some reports and complex queries running in the source OLTP systems. Ideally, you want to separate those workloads, running them with different parallelism settings.
To make matters worse, SQL Server’s default parallelism configuration is far from optimal. It allows SQL Server to utilize all CPUs in parallel execution plans (MAXDOP=0 setting) and generate parallel execution plans when the cost of queries is equal to or greater than 5 (in technical terms, when the cost threshold for parallelism, or CTFP, is 5 or more). The meaning of cost is synthetic: it does not represent anything meaningful and is used as a baseline metric during query optimization. Nevertheless, the value of 5 is extremely low nowadays as amounts of data grow; this value allows parallel execution plans for many queries.
Parallelism presents itself in the system with CXPACKET, CXCONSUMER and EXCHANGE waits. It is very important to remember, however, that parallelism is not the root cause but a symptom of the issue. A high percentage of parallelism waits merely indicates a large number of expensive queries, which could be completely normal for a given reporting workload. In OLTP systems, on the other hand, such a figure usually means that queries are not properly optimized (optimized queries would have a lower cost).
Note
You can see the cost of an individual statement by examining the property of the root operator in the execution plan.
When I see substantial parallelism waits in OLTP systems, I adjust the parallelism settings and continue troubleshooting and query tuning. Optimized queries have a lower cost and therefore reduce parallelism. In some cases, I even filter out parallelism waits from the wait statistics output, to get more a detailed picture of other waits.
There are several approaches to tuning parallelism settings. In OLTP systems I start by setting MAXDOP to one-fourth of the number of available CPUs. If the server has a large number of CPUs or handles lots of OLTP requests, I may decrease the number to one-eight or even lower. In data warehouse systems I might use half of the available CPUs instead.
More importantly, I increase the CTFP. I often start with a CTFP of 50, but you can examine the cost of the queries to analyze if other thresholds would work better. You can run the code from Listing 4-X, uncommenting the [Query Cost] column to see the cost of cached execution plans.
After the change is done, I monitor CPU load, percent of signal waits, and parallelism waits and adjust the settings. One goal for these adjustments is finding the right CFTP value, which will allow SQL Server to separate different workloads and reduce or even prevent parallelism in OLTP queries.
There are other, more granular options to control parallelism. For example, you can separate OLTP and reporting workloads with Resource Governor and set different MAXDOP options for different workload groups. You could also consider setting MAXDOP to 1 in OLTP systems, enabling parallelism for reporting queries with a MAXDOP query hint. Either of those options would require you to monitor the system constantly and work closely with development teams.
Whatever you do, do not set MAXDOP to 1 for all system workloads. This just hides the problem. Remember that parallelism is normal – you just need to make sure it is used legitimately.
Summary
Issues with high CPU load are common nowadays, as fast disk subsystems and large amount of memory hide the impact of non-optimized queries. Reducing CPU load often becomes the goal of the performance tuning process.
Nevertheless, non-optimized queries are still a major factor in increasing CPU load on the server. The more data SQL Server needs to scan, the more CPU resources it uses. General query optimization helps to reduce that.
You also learned in this chapter about the overhead of query compilation. In systems with heavy ad-hoc workloads, query compilation may lead to very significant CPU usage. Query parameterization in the code is the best option to address the issue. Alternately, consider enabling forced parameterization for some queries or at the database level.
Unfortunately, parameterization may lead to issues with parameter-sensitive plans, where SQL Server compiles and caches plans for atypical parameter values. Those plans may be highly inefficient for other combinations of parameters. In many cases, disabling parameter sniffing improves the situation.
Pay attention to the amount of parallelism in your system. Parallelism is completely normal for reporting and analytical workloads; however, it is not desirable in OLTP systems, because parallelism management always adds overhead.
Remember that parallelism indicates the existence of expensive queries. You need to optimize them, instead of disabling parallelism and hiding the problem. Nevertheless, SQL Server’s default parallelism settings are suboptimal and need to be tuned.
In the next chapter, you’ll learn how to troubleshoot memory-related issues in SQL Server.
Troubleshooting Checklist
Analyze and reduce CPU load from the processes outside of SQL Server.
Detect and optimize the worst offenders – the queries that use the most worker time.
Detect and optimize the most resource-intensive stored procedures and T-SQL modules.
Review the impact of compilations. Plan cache metrics (which we’ll discuss in the next chapter) may be useful in cross-checking the data.
Parameterize critical queries. In the most severe cases of heavy, non-parameterized ad-hoc workloads, consider enabling forced parameterization and, potentially, disabling parameter sniffing.
Tune your parallelism settings.