
CHAPTER 11
NETWORK DESIGN
NETWORK MANAGERS perform two key tasks: (1) designing new networks and network upgrades and (2) managing the day-to-day operation of existing networks. This chapter examines network design. Network design is an interative process in which the designer examines users’ needs, develops an initial set of technology designs, assesses their cost, and then revisits the needs analysis until the final network design emerges.
OBJECTIVES ![]()
- Be familiar with the overall process of designing and implementing a network
- Be familiar with techniques for developing a logical network design
- Be familiar with techniques for developing a physical network design
- Be familiar with network design principles
- Understand the role and functions of network management software
- Be familiar with several network management tools
CHAPTER OUTLINE ![]()
11.1.1 The Traditional Network Design Process
11.1.2 The Building-Block Network Design Process
11.2.4 Categorizing Network Needs
11.3.1 Designing Clients and Servers
11.3.2 Designing Circuits and Devices
11.4.2 Selling the Proposal to Management
11.5 DESIGNING FOR NETWORK PERFORMANCE
11.5.4 Minimizing Network Traffic
11.6 IMPLICATIONS FOR MANAGEMENT
11.1 INTRODUCTION
All but the smallest organizations have networks, which means that most network design projects are the design of upgrades or extensions to existing networks, rather than the construction of entirely new networks. Even the network for an entirely new building is likely to be integrated with the organization's existing backbone or WAN, so even new projects can be seen as extensions of existing networks. Nonetheless, network design is very challenging.
11.1.1 The Traditional Network Design Process
The traditional network design process follows a very structured systems analysis and design process similar to that used to build application systems. First, the network analyst meets with users to identify user needs and the application systems planned for the network. Second, the analyst develops a precise estimate of the amount of data that each user will send and receive and uses this to estimate the total amount of traffic on each part of the network. Third, the circuits needed to support this traffic plus a modest increase in traffic are designed and cost estimates are obtained from vendors. Finally, 1 or 2 years later, the network is built and implemented.
This traditional process, although expensive and time consuming, works well for static or slowly evolving networks. Unfortunately, networking today is significantly different from what it was when the traditional process was developed. Three forces are making the traditional design process less appropriate for many of today's networks.
First, the underlying technology of the client and server computers, networking devices, and the circuits themselves is changing very rapidly. In the early 1990s, mainframes dominated networks, the typical client computer was an 8-MHz 386 with 1 megabyte (MB) of random access memory (RAM) and 40 MB of hard disk space, and a typical circuit was a 9,600-bps mainframe connection or a 1-Mbps LAN. Today, client computers and servers are significantly more powerful, and circuit speeds of 100 Mbps and 1 Gbps are common. We now have more processing capability and network capacity than ever before; both are no longer scarce commodities that we need to manage carefully.
Second, the growth in network traffic is immense. The challenge is not in estimating today's user demand but in estimating its rate of growth. In the early 1990s, email and the Web were novelties primarily used by university professors and scientists. In the past, network demand essentially was driven by predictable business systems such as order processing. Today, much network demand is driven by less predictable user behavior, such as email and the Web. Many experts expect the rapid increase in network demand to continue, especially as video, voice, and multimedia applications become commonplace on networks. At a 10 percent growth rate, user demand on a given network will increase by one-third in three years. At 20 percent, it will increase by about 75 percent in three years. At 30 percent, it will double in less than three years. A minor mistake in estimating the growth rate can lead to major problems. With such rapid growth, it is no longer possible to accurately predict network needs for most networks. In the past, it was not uncommon for networks to be designed to last for 5 to 10 years. Today, most network designers use a 3- to 5-year planning horizon.
MANAGEMENT FOCUS
A recent survey of network managers found that most expect their network hardware to last three to five years—not because the equipment wears out, but because rapid changes in capabilities make otherwise good equipment obsolete.
Life expectancy for selected network equipment:
| Rack mounted switch | 4.5 years |
| Chassis switch | 4.5 years |
| Backbone router | 5 years |
| Branch office router | 4 years |
As Joel Snyder, a senior partner at OpusOne (a network consulting firm), puts it: “You might go buy a firewall for a T-1 at a remote office and then two weeks later have your cable provider offer you 7 Mbps.”
| Wi-Fi access point | 3 years |
| Desktop PC | 3.5 years |
| Laptop PC | 2.5 years |
| Mainframe | 8.5 years |
SOURCE: “When to Upgrade,” Network World, November 28, 2005, pp. 49–50.
Finally, the balance of costs have changed dramatically over the past 10 years. In the early 1990s, the most expensive item in any network was the hardware (circuits, devices, and servers). Today, the most expensive part of the network is the staff members who design, operate, and maintain it. As the costs have shifted, the emphasis in network design is no longer on minimizing hardware cost (although it is important); the emphasis today is on designing networks to reduce the staff time needed to operate them.
The traditional process minimizes the equipment cost by tailoring the equipment to a careful assessment of needs but often results in a mishmash of different devices with different capabilities. Two resulting problems are that staff members need to learn to operate and maintain many different devices and that it often takes longer to perform network management activities because each device may use slightly different software.
Today, the cost of staff time is far more expensive than the cost of equipment. Thus, the traditional process can lead to a false economy—save money now in equipment costs but pay much more over the long term in staff costs.
11.1.2 The Building-Block Network Design Process
Some organizations still use the traditional process to network design, particularly for those applications for which hardware or network circuits are unusually expensive (e.g., WANs that cover long distances through many different countries). However, many other organizations now use a simpler approach to network design that we call the building-block process. The key concept in the building-block process is that networks that use a few standard components throughout the network are cheaper in the long run than networks that use a variety of different components on different parts of the network.
Rather than attempting to accurately predict user traffic on the network and build networks to meet those demands, the building-block process instead starts with a few standard components and uses them over and over again, even if they provide more capacity than is needed. The goal is simplicity of design. This strategy is sometimes called “narrow and deep” because a very narrow range of technologies and devices is used over and over again (very deeply throughout the organization). The results are a simpler design process and a more easily managed network built with a smaller range of components.
In this chapter, we focus on the building-block process to network design. The basic design process involves three steps that are performed repeatedly: needs analysis, technology design, and cost assessment (Figure 11.1). This process begins with needs analysis, during which the designer attempts to understand the fundamental current and future network needs of the various users, departments, and applications. This is likely to be an educated guess at best. Users and applications are classified as typical or high volume. Specific technology needs are identified (e.g., the ability to dial in with current modem technologies).
The next step, technology design, examines the available technologies and assesses which options will meet users’ needs. The designer makes some estimates about the network needs of each category of user and circuit in terms of current technology (e.g., 100Base-T, 1000Base-T) and matches needs to technologies. Because the basic network design is general, it can easily be changed as needs and technologies change. The difficulty, of course, lies in predicting user demand so one can define the technologies needed. Most organizations solve this by building more capacity than they expect to need and by designing networks that can easily grow and then closely monitoring growth so they expand the network ahead of the growth pattern.
In the third step, cost assessment, the relative costs of the technologies are considered. The process then cycles back to the needs analysis, which is refined using the technology and cost information to produce a new assessment of users’ needs. This in turn triggers changes in the technology design and cost assessment and so on. By cycling through these three processes, the final network design is settled (Figure 11.2).
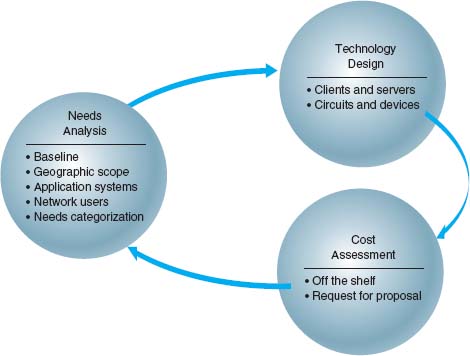
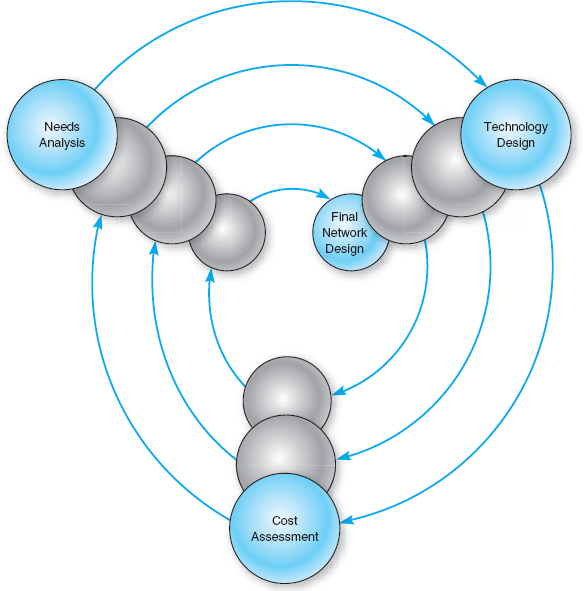
FIGURE 11.2 The cyclical nature of network design
11.2 NEEDS ANALYSIS
The goal of needs analysis is to understand why the network is being built and what users and applications it will support. In many cases, the network is being designed to improve poor performance or enable new applications to be used. In other cases, the network is upgraded to replace unreliable or aging equipment or to standardize equipment so that only one type of equipment, one protocol (e.g., TCP/IP, Ethernet), or one vendor's equipment is used everywhere in the network.
Often, the goals in network design are slightly different between LANs and backbones (BNs) on the one hand and WANs on the other. In the LAN and BN environment, the organization owns and operates the equipment and the circuits. Once they are paid for, there are no additional charges for usage. However, if major changes must be made, the organization will need to spend additional funds. In this case, most network designers tend to err on the side of building too big a network—that is, building more capacity than they expect to need.
In contrast, in most WANs, the organization leases circuits from a common carrier and pays for them on a monthly or per-use basis. Understanding capacity becomes more important in this situation because additional capacity comes at a noticeable cost. In this case, most network designers tend to err on the side of building too small a network, because they can lease additional capacity if they need it—but it is much more difficult to cancel a long-term contract for capacity they are not using.
Much of the needs analysis may already have been done because most network design projects today are network upgrades rather than the design of entirely new networks. In this case, there is already a fairly good understanding of the existing traffic in the network and, most important, of the rate of growth of network traffic. It is important to gain an understanding of the current operations (application systems and messages). This step provides a baseline against which future design requirements can be gauged. It should provide a clear picture of the present sequence of operations, processing times, work volumes, current communication network (if one exists), existing costs, and user/management needs. Whether the network is a new network or a network upgrade, the primary objective of this stage is to define (1) the geographic scope of the network and (2) the users and applications that will use it.
The goal of the needs analysis step is to produce a logical network design, which is a statement of the network elements needed to meet the needs of the organization. The logical design does not specify technologies or products to be used (although any specific requirements are noted). Instead, it focuses on the fundamental functionality needed, such as a high-speed access network, which in the technology design stage will be translated into specific technologies (e.g., switched 100Base-T).
11.2.1 Geographic Scope
The first step in needs analysis is to break the network into three conceptual parts on the basis of their geographic and logical scope: the access layer, the distribution layer, and the core layer, as first discussed in Chapter 7.1 The access layer is the technology that is closest to the user—the user's first contact with the network—and is often a LAN or a broadband Internet connection. The distribution layer is the next part of the network that connects the access layer to the rest of the network, such as the BN(s) in a specific building. The core layer is the innermost part of the network that connects the different distribution-layer networks to each other, such as the primary BN on a campus or a set of WAN circuits connecting different offices together. As the name suggests, the core layer is usually the busiest, most important part of the network. Not all layers are present in all networks; small networks, for example, may not have a distribution layer because their core may be the BN that directly connects the parts of the access layer together.
Within each of these parts of the network, the network designer must then identify some basic technical constraints. For example, if the access layer is a WAN, in that the users need to connect to the network over a broadband connection, this provides some constraints on the technologies to be used; one usually could not use 100Base-T Ethernet, for example. Likewise, if the access layer is a LAN, it would be silly to consider using T1 circuits.
Sometimes, the current network infrastructure also imposes constraints. For example, if we are adding a new building to an existing office complex that used 100Base-T in the access-layer LANs, then we will probably choose to use 100Base-T for the access layer in the new building. All such constraints are noted.
It is easiest to start with the highest level, so most designers begin by drawing a network diagram for any WANs with international or countrywide locations that must be connected. A diagram that shows the logical network going between the locations is sufficient. Details such as the type of circuit and other considerations will be added later. Next, the individual locations connected to the WAN are drawn, usually in a series of separate diagrams, but for a simple network, one diagram may be sufficient.
At this point, the designers gather general information and characteristics of the environment in which the network must operate. For example, they determine whether there are any legal requirements, such as local, state/provincial, federal, or international laws, regulations, or building codes, that might affect the network.
Figure 11.3 shows the initial drawing of a network design for an organization with offices in four areas connected to the core network, which is a WAN. The Toronto location, for example, has a distribution layer (a BN) connecting three distinct access-layer LANs, which could be three distinct LANs in the same office building. Chicago has a similar structure, with the addition of a fourth access part that connects to the Internet; that is, the organization has only one Internet connection, so all Internet traffic must be routed through the core network to the Chicago location. The Atlantic Canada network section has two distinct access layer parts; one is a LAN and one access layer is a WAN (e.g., DSL). The New York network section is more complex, having its own core network component (a BN connected into the core WAN), which in turn supports three distribution-layer BNs. Each of these support several access-layer LANs.
11.2.2 Application Systems
Once the basic geographic scope is identified, the designers must review the list of applications that will use the network and identify the location of each. This information should be added to the emerging network diagrams. This process is called baselining. Next, those applications that are expected to use the network in the future are added.
In many cases, the applications will be relatively well defined. Specific internal applications (e.g., payroll) and external applications (e.g., Web servers) may already be part of the “old” network. However, it is important to review the organization's long-range and short-range plans concerning changes in company goals, strategic plans, development plans for new products or services, projections of sales, research and development projects, major capital expenditures, possible changes in product mix, new offices that must be served by the communications network, security issues, and future commitments to technology. For example, a major expansion in the number of offices or a major electronic commerce initiative will have a significant impact on network requirements.
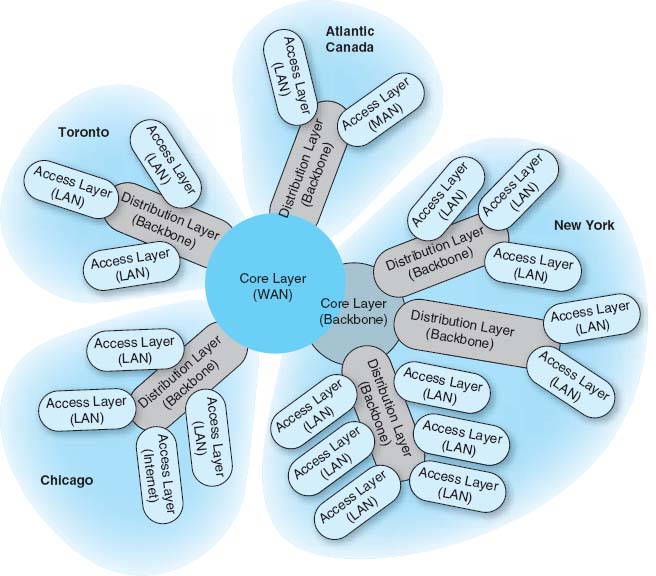
FIGURE 11.3 Geographic scope. LAN = local area network; MAN = metropolitan area network; WAN = wide area network
It also is helpful to identify the hardware and software requirements of each application that will use the network and, if possible, the protocol each application uses (e.g., HTTP over TCP/IP, Windows file access). This knowledge helps now and will be particularly useful later when designers develop technological solutions.
11.2.3 Network Users
In the past, application systems accounted for the majority of network traffic. Today, much network traffic is produced by the discretionary use of the Internet. Applications such as email and the Web are generating significant traffic, so the network manager is no longer in total control of the network traffic generated on his or her networks. This is likely to continue in the future as network-hungry applications such as desktop videoconferencing become more common. Therefore, in addition to understanding the applications, you must also assess the number and type of users that will generate and receive network traffic and identify their location on the emerging network diagram.
11.2.4 Categorizing Network Needs
At this point, the network has been designed in terms of geographic scope, application systems, and users. The next step is to assess the relative amount of traffic generated in each part of the network. With the traditional design approach, this involves considerable detailed analysis. With the building-block approach, the goal is to provide some rough assessment of the relative magnitude of network needs. Each application system is assessed in general terms to determine the amount of network traffic it can be expected to generate today and in the future, compared with other applications. Likewise, each user is categorized as either a typical user or a high-traffic user. These assessments will be refined in the next stage of the design process.
This assessment can be problematic, but the goal is some relative understanding of the network needs. Some simple rules of thumb can help. For example, applications that require large amounts of multimedia data or those that load executables over the network are likely to be high-traffic applications. Applications that are time sensitive or need constant updates (e.g., financial information systems, order processing) are likely to be high-traffic applications.
Once the network requirements have been identified, they also should be organized into mandatory requirements, desirable requirements, and wish-list requirements. This information enables the development of a minimum level of mandatory requirements and a negotiable list of desirable requirements that are dependent on cost and availability. For example, desktop videoconferencing may be a wish-list item, but it will be omitted if it increases the cost of the network beyond what is desired.
At this point, the local facility network diagrams are prepared. For a really large network, there may be several levels. For example, the designer of the network in Figure 11.3 might choose to draw another set of diagrams, one each for Toronto, Chicago, Atlantic Canada, and New York. Conversely, the designer might just add more detail to and develop separate, more detailed diagrams for New York. The choice is up to the designer, provided the diagrams and supporting text clearly explain the network's needs.
11.2.5 Deliverables
The key deliverable for the needs assessments stage is a set of logical network diagrams, showing the applications, circuits, clients, and servers in the proposed network, each categorized as either typical or high traffic. The logical diagram is the conceptual plan for the network and does not consider the specific physical elements (e.g., routers, switches, circuits) that will be used to implement the network.
Figure 11.4 shows the results of a needs assessment for one of the New York parts of the network from Figure 11.3. This figure shows the distribution and access parts in the building with the series of six access LANs connected by one distribution BN, which is in turn connected to a campus-area core BN. One of the six LANs is highlighted as a high-traffic LAN, whereas the others are typical. Three mandatory applications are identified that will be used by all network users: email, Web, and file sharing. One wish-list requirement (desktop videoconferencing) is also identified for a portion of the network.
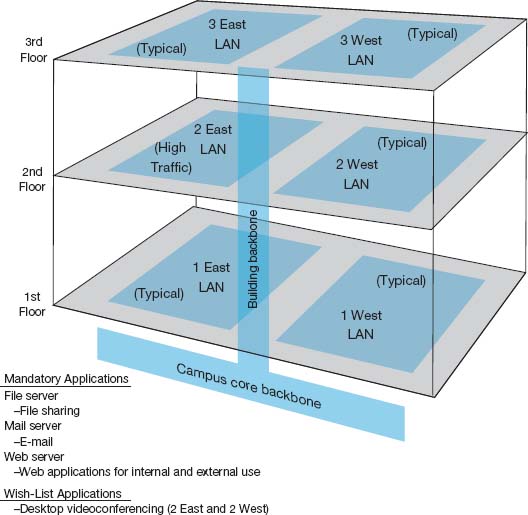
FIGURE 11.4 Sample needs assessment. LAN = local area network
11.3 TECHNOLOGY DESIGN
Once the needs have been defined in the logical network design, the next step is to develop a physical network design (or set of possible designs). The physical network design starts with the client and server computers needed to support the users and applications. If the network is a new network, new computers will need to be purchased. If the network is an existing network, the servers may need to be upgraded to the newest technology. Once these are designed, then the circuits and devices connecting them are designed.
11.3.1 Designing Clients and Servers
The idea behind the building-block approach is to specify needs in terms of some standard units. Typical users are allocated the base-level client computers, as are servers supporting typical applications. Users and servers for applications needing more powerful computers are assigned some advanced computer. As the specifications for computers rapidly improve and costs drop (usually every six months), today's typical user may receive the type of computer originally intended for the advanced user when the network is actually implemented, and the advanced users may end up with a computer not available when the network was designed.
11.3.2 Designing Circuits and Devices
The same is true for network circuits and devices (e.g., hubs, routers, switches). There are two interrelated decisions in designing network circuits and devices: the fundamental technology and protocols (e.g., Ethernet, T1, TCP/IP) and the capacity of each circuit (e.g., 100 Mbps, 1000 Mbps). These are interrelated, because each technology offers different circuit capacities.
Designing the circuit capacity means capacity planning, estimating the size and type of the standard and advanced network circuits for each type of network (LAN, BN, WAN). For example, should the standard LAN circuit be shared or switched 100Base-T? Likewise, should the standard BN circuit be 100Base-T or 1GbE?
This requires some assessment of the current and future circuit loading (the amount of data transmitted on a circuit). This analysis can focus on either the average circuit traffic or the peak circuit traffic. For example, in an online banking network, traffic volume peaks usually are in the midmorning (bank opening) and just prior to closing. Airline and rental car reservations network designers look for peak volumes before and during holidays or other vacation periods whereas telephone companies normally have their highest peak volumes on Mother's Day. Designing for peak circuit traffic is the ideal.
The designer usually starts with the total characters transmitted per day on each circuit or, if possible, the maximum number of characters transmitted per two-second interval if peaks must be met. You can calculate message volumes by counting messages in a current network and applying some estimated growth rate. If an existing network is in place, network monitors/analyzers (see Chapter 12) may be able to provide an actual circuit character count of the volume transmitted per minute or per day.
A good rule of thumb is that 80 percent of this circuit loading information is easy to gather. The last 20 percent needed for very precise estimates is extremely difficult and expensive to find. However, precision usually is not a major concern because of the stairstep nature of communication circuits and the need to project future needs. For example, the difference between 100Base-T and 1GbE is quite large, and assessing which level is needed for typical traffic does not require a lot of precision. Forecasts are inherently less precise than understanding current network traffic. The turnpike effect is an expression that means that traffic increases much faster than originally forecast. It comes from the traffic forecasting that was done for the construction of the early interstate highways. When a new, faster highway (or network) is built, people are more likely to use it than the old slow one because it is available, is very efficient, and provides new capabilities. The annual growth factor for network use may vary from 5 to 50 percent and, in some cases, may exceed 100 percent for high-growth organizations.
Although no organization wants to overbuild its network and pay for more capacity than it needs, in most cases, upgrading a network costs 50 to 80 percent more than building it right the first time. Few organizations complain about having too much network capacity, but being under capacity can cause significant problems. Given the rapid growth in network demand and the difficulty in accurately predicting it, most organizations intentionally overbuild (build more capacity into their network than they plan to use), and most end up using this supposedly unneeded capacity within 3 years.
11.3.3 Network Design Tools
Network modeling and design tools can perform a number of functions to help in the technology design process. With most tools, the first step is to enter a diagram or model of the existing network or proposed network design. Some modeling tools require the user to create the network diagram from scratch. That is, the user must enter all of the network components by hand, placing each server, client computer, and circuit on the diagram and defining what each is (e.g., 10Base-T, frame relay circuit with a 1-Mbps committed information rate).
Other tools can “discover” the existing network; that is, once installed on the network, they will explore the network to draw a network diagram. In this case, the user provides some starting point, and the modeling software explores the network and automatically draws the diagram itself. Once the diagram is complete, the user can then change it to reflect the new network design. Obviously, a tool that can perform network discovery by itself is most helpful when the network being designed is an upgrade to an existing network and when the network is very complex.
Once the diagram is complete, the next step is to add information about the expected network traffic and see if the network can support the level of traffic that is expected. Simulation, a mathematical technique in which the network comes to life and behaves as it would under real conditions, is used to model the behavior of the communication network. Applications and users generate and respond to messages while the simulator tracks the number of packets in the network and the delays encountered at each point in the network.
Simulation models may be tailored to the users’ needs by entering parameter values specific to the network at hand (e.g., this computer will generate an average of three 100-byte packets per minute). Alternatively, the user may prefer to rely primarily on the set of average values provided by the network.
Once the simulation is complete, the user can examine the results to see the estimated response times throughout. It is important to note that these network design tools provide only estimates, which may vary from the actual results. At this point, the user can change the network design in an attempt to eliminate bottlenecks and rerun the simulation. Good modeling tools not only produce simulation results but also highlight potential trouble spots (e.g., servers, circuits, or devices that experienced long response times). The very best tools offer suggestions on how to overcome the problems that the simulation identified (e.g., network segmentation, increasing from T1 to T3).
11.3.4 Deliverables
The key deliverable is a set of one or more physical network designs. Most designers like to prepare several physical designs so they can trade off technical benefits (e.g., performance) against cost. In most cases, the critical part is the design of the network circuits and devices. In the case of a new network designed from scratch, it is also important to define the client computers with care because these will form a large portion of the total cost of the network. Usually, however, the network will replace an existing network and only a few of the client computers in the existing network will be upgraded.
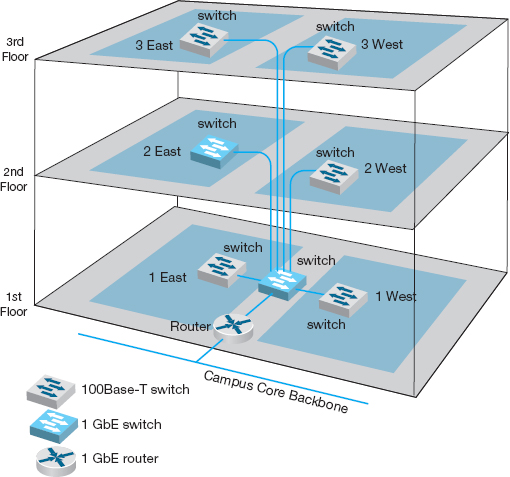
FIGURE 11.5 Physical network design
Figure 11.5 shows a physical network design for the simple network in Figure 11.4. In this case, a 1GbE collapsed backbone is used in the distribution layer, and switched 100Base-T Ethernet has been chosen as the standard network for typical users in the access layer. High-traffic users (2 East) will use 1GbE. The building backbone will be connected directly into the campus backbone using a router and will use fiber-optic cable to enable the possible future addition of desktop videoconferencing.
11.4 COST ASSESSMENT
The purpose of this step is to assess the costs of various physical network design alternatives produced in the previous step. The main items are the costs of software, hardware, and circuits. These three factors are all interconnected and must be considered along with the performance and reliability required. All factors are interrelated with regard to cost.
Estimating the cost of a network is quite complex because many factors are not immediately obvious. Some of the costs that must be considered are
- Circuit costs, including costs of circuits provided by common carriers or the cost of purchasing and installing your own cable
- Internetworking devices such as switches and routers
- Hardware costs, including server computers, NICs, hubs, memory, printers, uninterruptible power supplies, and backup tape drives
- Software costs for network operating system, application software, and middleware
- Network management costs, including special hardware, software, and training needed to develop a network management system for ongoing redesign, monitoring, and diagnosing of problems
- Test and maintenance costs for special monitoring equipment and software, plus the cost of onsite spare parts
- Costs to operate the network
11.4.1 Request for Proposal
Although some network components can be purchased off the shelf, most organizations develop a request for proposal (RFP) before making large network purchases. RFPs specify what equipment, software, and services are desired and ask vendors to provide their best prices. Some RFPs are very specific about what items are to be provided in what time frame. In other cases, items are defined as mandatory, important, or desirable, or several scenarios are provided and the vendor is asked to propose the best solution. In a few cases, RFPs specify generally what is required and the vendors are asked to propose their own network designs. Figure 11.6 provides a summary of the key parts of an RFP.
Once the vendors have submitted their proposals, the organization evaluates them against specified criteria and selects the winner(s). Depending on the scope and complexity of the network, it is sometimes necessary to redesign the network on the basis of the information in the vendors’ proposals.
One of the key decisions in the RFP process is the scope of the RFP. Will you use one vendor or several vendors for all hardware, software, and services? Multivendor environments tend to provide better performance because it is unlikely that one vendor makes the best hardware, software, and services in all categories. Multivendor networks also tend to be less expensive because it is unlikely that one vendor will always have the cheapest hardware, software, and services in all product categories.
Multivendor environments can be more difficult to manage, however. If equipment is not working properly and it is provided by two different vendors, each can blame the other for the problem. In contrast, a single vendor is solely responsible for everything.
11.4.2 Selling the Proposal to Management
One of the main problems in network design is obtaining the support of senior management. To management, the network is simply a cost center, something on which the organization is spending a lot of money with little apparent change. The network keeps on running just as it did the year before.
The key to gaining the acceptance of senior management lies in speaking manage-ment's language. It is pointless to talk about upgrades from 100 Mbps to 1GbE on the backbone because this terminology is meaningless from a business perspective. A more compelling argument is to discuss the growth in network use. For example, a simple graph that shows network usage growing at 25 percent per year, compared with network budget growing at 10 percent per year, presents a powerful illustration that the network costs are well managed, not out of control.
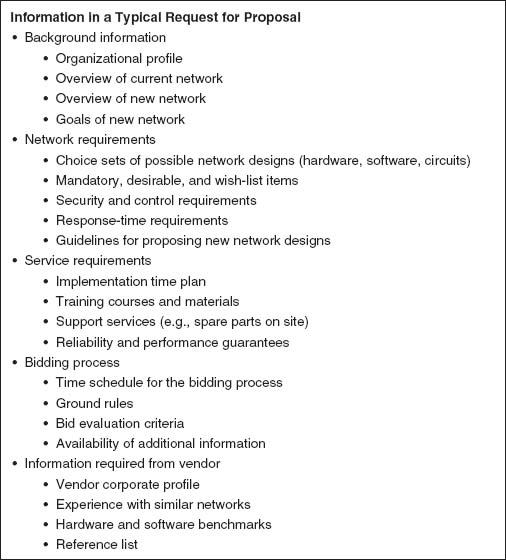
FIGURE 11.6 Request for proposal
Likewise, a focus on network reliability is an easily understandable issue. For example, if the network supports a mission-critical system such as order processing or moving point-of-sale data from retail stores to corporate offices, it is clear from a business perspective that the network must be available and performing properly, or the organization will lose revenue.
11.4.3 Deliverables
There are three key deliverables for this step. The first is an RFP that goes to potential vendors. The second deliverable, after the vendor has been selected, is the revised physical network diagram (e.g., Figure 11.5) with the technology design complete. Exact products and costs are specified at this point (e.g., a 16-port 100Base-T switch). The third deliverable is the business case that provides support for the network design, expressed in business objectives.
11.5 DESIGNING FOR NETWORK PERFORMANCE
At the end of the previous chapters we have discussed the best practice design for LANs, backbones, WANs, and WLANs and examined how different technologies and services offered different effective data rates at different costs. In the backbone and WAN chapters we also examined different topologies and contrasted the advantages and disadvantages of each. So at this point, you should have a good understanding of the best choices for technologies and services and how to put them together into a good network design. In this section, we examine several higher-level concepts used to design the network for the best performance.
11.5.1 Managed Networks
The single most important element that contributes to the performance of a network is a managed network that uses managed devices. Managed devices are standard devices, such as switches and routers, that have small onboard computers to monitor traffic flows through the device as well as the status of the device and other devices connected to it. Managed devices perform their functions (e.g., routing, switching) and also record data on the messages they process. These data can be sent to the network manager's computer when the device receives a special control message requesting the data, or the device can send an alarm message to the network manager's computer if it detects a critical situation such as a failing device or a huge increase in traffic.
In this way, network problems can be detected and reported by the devices themselves before problems become serious. In the case of the failing network card, a managed device could record the increased number of retransmissions required to successfully transmit messages and inform the network management software of the problem. A managed hub or switch might even be able to detect the faulty transmissions from a failing network card, disable the incoming circuit so that the card could not send any more messages, and issue an alarm to the network manager. In either case, finding and fixing problems is much simpler, requiring minutes not hours.
Network Management Software A managed network requires both hardware and software: hardware to monitor, collect, and transmit traffic reports and problem alerts, and network management software to store, organize, and analyze these reports and alerts. There are three fundamentally different types of network management software.
Device management software (sometimes called point management software) is designed to provide information about the specific devices on a network. It enables the network-manager to monitor important devices such as servers, routers, and gateways, and typically report configuration information, traffic volumes, and error conditions for each device. Figure 11.7 shows some sample displays from a device management package running at Indiana University. This figure shows the amount of traffic in terms of inbound traffic (light gray area) and outbound traffic (dark gray line) over several network segments. The monthly graph shows, for example, that inbound traffic maxed out the resnet T3 circuit in week 18.
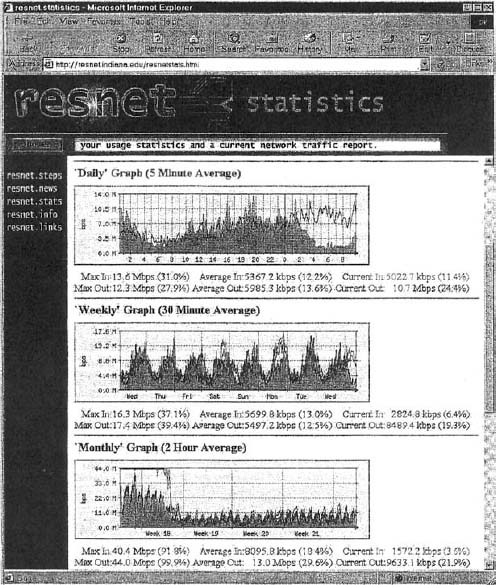
FIGURE 11.7 Device management software
System management software (sometimes called enterprise management software or a network management framework) provides the same configuration, traffic, and error information as device management systems, but can analyze the device information to diagnose patterns, not just display individual device problems. This is important when a critical device fails (e.g., a router into a high-traffic building). With device management software, all of the devices that depend on the failed device will attempt to send warning messages to the network administrator. One failure often generates several dozen problem reports, called an alarm storm, making it difficult to pinpoint the true source of the problem quickly. The dozens of error messages are symptoms that mask the root cause. System management software tools correlate the individual error messages into a pattern to find the true cause, which is called root cause analysis, and then report the pattern to the network manager. Rather than first seeing pages and pages of error messages, the network manager instead is informed of the root cause of the problem. Figure 11.8 shows a sample from HP.
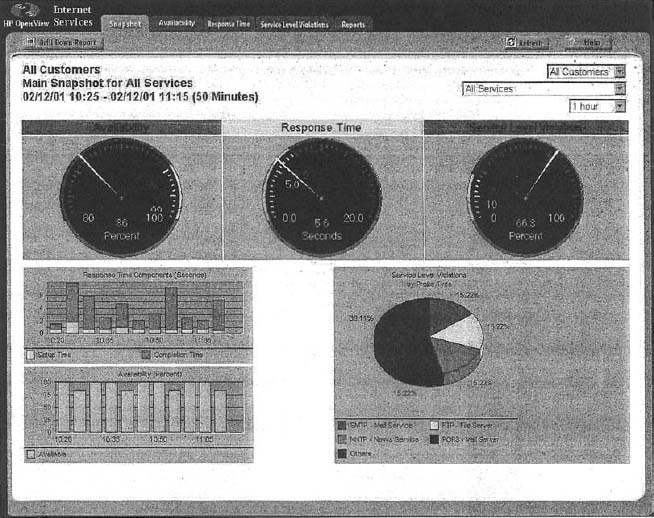
FIGURE 11.8 Network management software
Source: HP OpenView
Application management software also builds on the device management software, but instead of monitoring systems, it monitors applications. In many organizations, there are mission-critical applications that should get priority over other network traffic. For example, real-time order-entry systems used by telephone operators need priority over email. Application management systems track delays and problems with application layer packets and inform the network manager if problems occur.
Network Management Standards One important problem is ensuring that hardware devices from different vendors can understand and respond to the messages sent by the network management software of other vendors. By this point in this book, the solution should be obvious: standards. A number of formal and de facto standards have been developed for network management. These standards are application layer protocols that define the type of information collected by network devices and the format of control messages that the devices understand.
The two most commonly used network management protocols are Simple Network Management Protocol (SNMP) and Common Management Interface Protocol (CMIP). Both perform the same basic functions but are incompatible. SNMP is the Internet network management standard, whereas CMIP is a newer protocol for OSI-type networks developed by the ISO. SNMP is the most commonly used today although most of the major network management software tools understand both SNMP and CMIP and can operate with hardware that uses either standard.
Originally, SNMP was developed to control and monitor the status of network devices on TCP/IP networks, but it is now available for other network protocols (e.g., IPX/SPX). Each SNMP device (e.g., router, gateway, server) has an agent that collects information about itself and the messages it processes and stores that information in a central database called the management information base (MIB). The network manager's management station that runs the network management software has access to the MIB. Using this software, the network manager can send control messages to individual devices or groups of devices asking them to report the information stored in their MIB.
Most SNMP devices have the ability for remote monitoring (RMON). Most first-generation SNMP tools reported all network monitoring information to one central network management database. Each device would transmit updates to its MIB on the server every few minutes, greatly increasing network traffic. RMON SNMP software enables MIB information to be stored on the device itself or on distributed RMON probes that store MIB information closer to the devices that generate it. The data are not transmitted to the central server until the network manager requests, thus reducing network traffic (Figure 11.9).
Network information is recorded based on the data link layer protocols, network layer protocols, and application layer protocols, so that network managers can get a very clear picture of the exact types of network traffic. Statistics are also collected based on network addresses so the network manager can see how much network traffic any particular computer is sending and receiving. A wide variety of alarms can be defined, such as instructing a device to send a warning message if certain items in the MIB exceed certain values (e.g., if circuit utilization exceeds 50 percent).
As the name suggests, SNMP is a simple protocol with a limited number of functions. One problem with SNMP is that many vendors have defined their own extensions to it. So the network devices sold by a vendor may be SNMP compliant, but the MIBs they produce contain additional information that can be used only by network management software produced by the same vendor. Therefore, while SNMP was designed to make it easier to manage devices from different vendors, in practice this is not always the case.
Policy-Based Management With policy-based management, the network manager uses special software to set priority policies for network traffic that take effect when the network becomes busy. For example, the network manager might say that order processing and videoconferencing get the highest priority (order processing because it is the lifeblood of the company and videoconferencing because poor response time will have the greatest impact on it). The policy management software would then configure the network devices using the quality of service (QoS) capabilities in TCP/IP and/or ATM and/or its VLANs to give these applications the highest priority when the devices become busy.
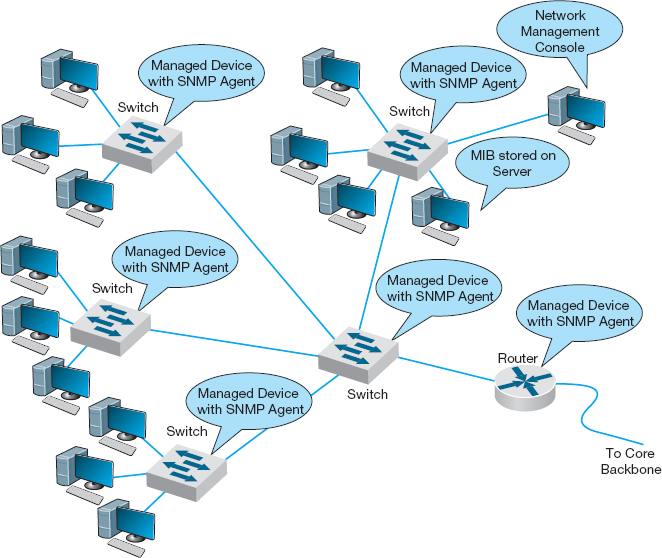
FIGURE 11.9 Network Management with Simple Network Management Protocol (SNMP). MIB = management information base
11.5.2 Network Circuits
In designing a network for maximum performance, it is obvious that the network circuits play a critical role, whether they are under the direct control of the organization itself (in the case of LANs, backbones, and WLANs) or leased as services from common carriers (in the case of WANs). Sizing the circuits and placing them to match traffic patterns is important. We discussed circuit loading and capacity planning in the earlier sections. In this section we also consider traffic analysis and service level agreements, which are primarily important for WANs, because circuits are most important in these networks in which you pay for network capacity.
Traffic Analysis In managing a network and planning for network upgrades, it is important to know the amount of traffic on each network circuit to find which circuits are approaching capacity. These circuits then can be upgraded to provide more capacity and less-used circuits can be downgraded to save costs. A more sophisticated approach involves a traffic analysis to pinpoint why some circuits are heavily used.
11.2 NETWORK MANAGEMENT AT ZF LENKSYSTEME
MANAGEMENT FOCUS
ZF Lenksysteme manufactures steering systems for cars and trucks. It is headquartered in southern Germany but has offices and plants in France, England, the United States, Brazil, India, China, and Malaysia. Its network has about 300 servers and 600 devices (e.g., routers, switches).
ZF Lenksysteme had a network management system, but when a problem occurred with one device, nearby devices also issued their own alarms. The network management software did not recognize the interactions among the devices and the resulting alarm storm meant that it took longer to diagnose the root cause of the problem.
The new HP network management system monitors and controls the global network from one central location with only three staff. All devices and servers are part of the system, and interdependencies are well defined, so alarm storms are a thing of the past. The new system has cut costs by 50 percent and also has extended network management into the production line. The robots on the production line now use TCP/IP networking, so they can be monitored like any other device.
__________
SOURCE: ZF Lenksysteme, HP Case studies, hp.com. 2010.
For example, Figure 11.10 shows the same partial mesh WAN we showed in Chapter 8. Suppose we discover that the circuit from Toronto to Dallas is heavily used.
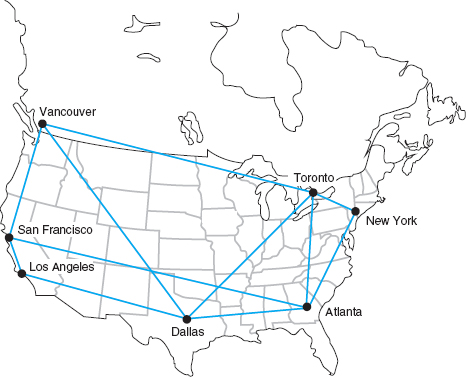
FIGURE 11.10 Sample wide area network
The immediate reaction might be to upgrade this circuit from a T1 to a T3. However, much traffic on this circuit may not originate in Toronto or be destined for Dallas. It may, for example, be going from New York to Los Angeles, in which case the best solution is a new circuit that directly connects them, rather than upgrading an existing circuit. The only way to be sure is to perform a traffic analysis to see the source and destination of the traffic.
Service Level Agreements Most organizations establish a service-level agreement (SLA) with their common carrier and Internet service provider. An SLA specifies the exact type of performance that the common carrier will provide and the penalties if this performance is not provided. For example, the SLA might state that circuits must be available 99 percent or 99.9 percent of the time. A 99 percent availability means, for example, that the circuit can be down 3.65 days per year with no penalty, while 99.9 percent means 8.76 hours per year. In many cases, SLA includes maximum allowable response times. Some organizations are also starting to use an SLA internally to clearly define relationships between the networking group and its organizational “customers.”
11.5.3 Network Devices
In previous chapters, we have treated the devices used to build the network as commodities. We have talked about 100Base-T switches and routers as though all were the same. This not true; in the same way that computers from different manufacturers provide different capabilities, so too do network devices. Some devices are simply faster or more reliable than similar devices from other manufacturers. In this section we examine four factors important in network performance: device latency, device memory, load balancing, and capacity management.
Device Latency Latency is the delay imposed by the device in processing messages. A high-latency device is one that takes a long time to process a message, whereas a low-latency device is fast. The type of computer processor installed in the device affects latency. The fastest devices run at wire speed, which means they operate as fast as the circuits they connect and add virtually no delays.
For networks with heavy traffic, latency is a critical issue because any delay affects all packets that move through the device. If the device does not operate at wire speed, then packets arrive faster than the device can process them and transmit them on the outgoing circuits. If the incoming circuit is operating at close to capacity, then this will result in long traffic backups in the same way that long lines of traffic form at tollbooths on major highways during rush hour.
Latency is less important in low-traffic networks because packets arrive less frequently and long lines seldom build up even if the device cannot process all packets that the circuits can deliver. The actual delay itself—usually a few microseconds—is not noticeable by users.
Device Memory Memory and latency go hand-in-hand. If network devices do not operate at wire speed, this means that packets can arrive faster than they can be processed. In this case, the device must have sufficient memory to store the packets. If there is not enough memory, then packets are simply lost and must be retransmitted—thus increasing traffic even more. The amount of memory needed is directly proportional to the latency (slower devices with higher latencies need more memory).
Memory is also important for servers whether they are Web servers or file servers. Memory is many times faster than hard disks so Web servers and file servers usually store the most frequently requested files in memory to decrease the time they require to process a request. The larger the memory that a server has, the more files it can store in memory and the more likely it is to be able to process a request quickly. In general, it is always worthwhile to have the greatest amount of memory practical in Web and file servers.
Load Balancing In all large-scale networks today, servers are placed together in server farms or clusters, which sometimes have hundreds of servers that perform the same task. Yahoo.com, for example, has hundreds of Web servers that do nothing but respond to Web search requests. In this case, it is important to ensure that when a request arrives at the server farm, it is immediately forwarded to a server that is not busy—or is the least busy.
A special device called a load balancing switch or virtual server acts as a router at the front of the server farm (Figure 11.11). All requests are directed to the load balancer at its IP address. When a request hits the load balancer it forwards it to one specific server using its IP address. Sometimes a simple round-robin formula is used (requests go to each server one after the other in turn); in other cases, more complex formulas track how busy each server actually is. If a server crashes, the load balancer stops sending requests to it and the network continues to operate without the failed server. Load balancing makes it simple to add servers (or remove servers) without affecting users. You simply add or remove the server(s) and change the software configuration in the load balancing switch; no one is aware of the change.
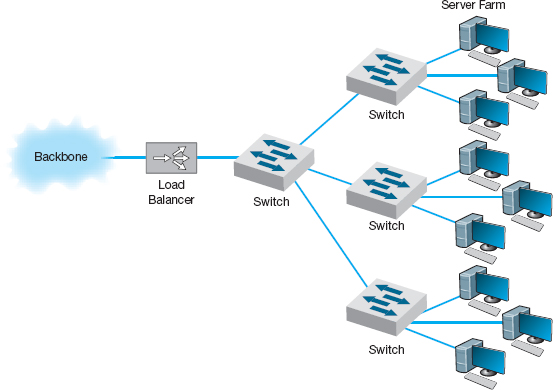
FIGURE 11.11 Network with load balancer
Server Virtualization Server virtualization is somewhat the opposite of server farms and load balancing. Server virtualization is the process of creating several logically separate servers (e.g., a Web server, an email server, a file server) on the same physical computer. The virtual servers run on the same physical computer, but appear completely separate to the network (and if one crashes it does not affect the others running on the same computer).
Over time, many firms have installed new servers to support new projects, only to find that the new server was not fully used; the server might only be running at 10 percent of its capacity and sitting idle for the rest of the time. One underutilized server is not a problem. But imagine if 20 to 30 percent of a company's servers are underutilized. The company has spent too much money to acquire the servers, and, more importantly, is continuing to spend money to monitor, manage, and update the underused servers. Even the space and power used by having many separate computers can noticeably increase operating costs. Server virtualization enables firms to save money by reducing the number of physical servers they buy and operate, while still providing all the benefits of having logically separate devices and operating systems.
Some operating systems enable virtualization natively, which means that it is easy to configure and run separate virtual servers. In other cases, special purpose virtualization software (e.g., VMware) is installed on the server and sits between the hardware and the operating systems; this software means that several different operating systems (e.g., Windows, Mac, Linux) could be installed on the same physical computer.
Capacity Management Most network traffic today is hard to predict. Users choose to download large software or audio files or have instant messenger voice chats. In many networks, there is greater capacity within a LAN than there is leading out of the LAN into the backbone or to the Internet. In Figure 11.5, for example, the building backbone has a capacity of 1 Gbps, which is also the capacity of just one LAN connected to it (2 East). If one user in this LAN generates traffic at the full capacity of this LAN, then the entire backbone will become congested, affecting users in all other LANs.
Capacity management devices, sometimes called bandwidth limiters or bandwidth shapers, monitor traffic and can act to slow down traffic from users who consume too much capacity. These devices are installed at key points in the network, such as between a switch serving a LAN and the backbone it connects into, and are configured to allocate capacity based on the IP address of the source (or its data link address) as well as the application in use. The device could, for example, permit a given user to generate a high amount of traffic for an approved use, but limit capacity for an unofficial use such as MP3 files. Figure 11.12 shows the control panel for one device made by NetEqualizer.
11.5.4 Minimizing Network Traffic
Most approaches to improving network performance attempt to maximize the speed at which the network can move the traffic it receives. The opposite—and equally effective approach—is to minimize the amount of traffic the network receives. This may seem quite difficult at first glance—after all, how can we reduce the number of Web pages people request? We can't reduce all types of network traffic, but if we move the most commonly used data closer to the users who need it, we can reduce traffic enough to have an impact. We do this by providing servers with duplicate copies of commonly used information at points closer to the users than the original source of the data. Two approaches are emerging: content caching and content delivery.
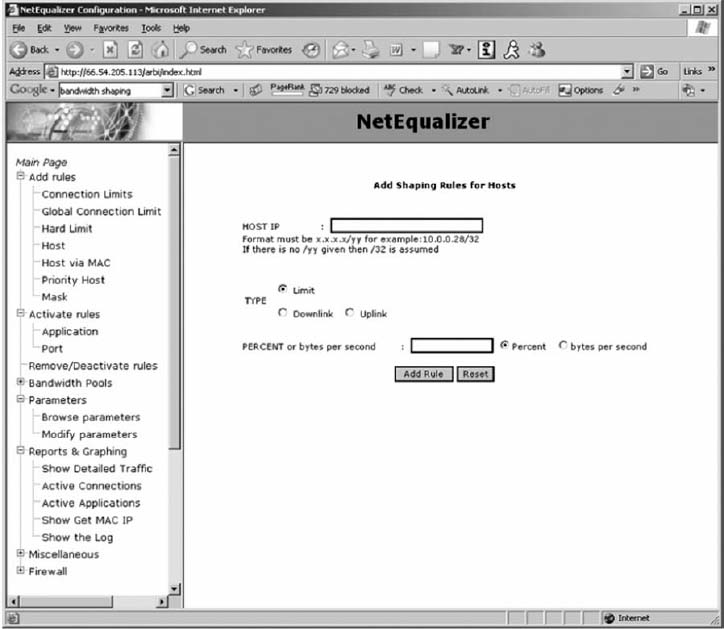
FIGURE 11.12 Capacity management software
Content Caching The basic idea behind content caching is to store other people's Web data closer to your users. With content caching, you install a content engine (also called a cache engine) close to your Internet connection and install special content management software on the router (Figure 11.13). The router or routing switch directs all outgoing Web requests and the files that come back in response to those requests to the cache engine. The content engine stores the request and the static files that are returned in response (e.g., graphics files, banners). The content engine also examines each outgoing Web request to see if it is requesting static content that the content engine has already stored. If the request is for content already in the content engine, it intercepts the request and responds directly itself with the stored file, but makes it appear as though the request came from the URL specified by the user. The user receives a response almost instantaneously and is unaware that the content engine responded. The content engine is transparent.
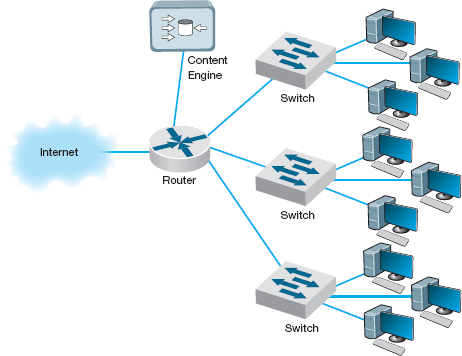
FIGURE 11.13 Network with content engine
Although not all Web content will be in the content engine's memory, content from many of the most commonly accessed sites on the Internet will be (e.g., yahoo.com, google.com, Amazon.com). The contents of the content engine reflect the most common requests for each individual organization that uses it, and changes over time as the pattern of pages and files changes. Each page or file also has a limited life in the cache before a new copy is retrieved from the original source so that pages that occasionally change will be accurate.
For content caching to work properly, the content engine must operate at almost wire speeds, or else it imposes additional delays on outgoing messages that result in worse performance, not better. By reducing outgoing traffic (and incoming traffic in response to requests), the content engine enables the organization to purchase a smaller WAN or MAN circuit into the Internet. So not only does content caching improve performance, but it can also reduce network costs if the organization produces a large volume of network requests.
Content Delivery Content delivery, pioneered by Akamai, 2 is a special type of Internet service that works in the opposite direction. Rather than storing other people's Web files closer to their own internal users, a content delivery provider stores Web files for its clients closer to their potential users. Akamai, for example, operates almost 10,000 Web servers located near the busiest Internet NAPs, and other exchanges. These servers contain the most commonly requested Web information for some of the busiest sites on the Internet (e.g., yahoo.com, monster.com, ticketmaster.com).
11.3 LOAD BALANCING AT BRYAM HEALTHCARE
MANAGEMENT FOCUS
Bryam Healthcare is a medical supply company serving more than 300,000 customers from 17 operating centers. When its sales representatives began complaining about the slow response times for email, Web, and other key applications, Anthony Acquanita, Byram's network manager, realized that the network architecture had reached its limits.
The old architecture was a set of four servers each running specific applications (e.g., one email server, one Web server). At different points in the week, a different server would become overloaded and provide slow response times for a specific application—the email server first thing Monday morning as people checked their email after the weekend, for example.
The solution was to install a load balancing switch in front of the servers and install all the major applications on all the servers. This way when the demand for one application peaks, there are four servers available rather than one. Because the demand for different applications peaks at different times, the result has been dramatically improved performance, without the need to buy new servers. The side benefit is that it is now simple to remove one server from operations at nonpeak times for maintenance or software upgrades without the users noticing (whereas in the past, server maintenance meant disabling an application (e.g., email) for a few hours while the server was worked on).
__________
SOURCE: “Load Balancing Boosts Network,” Communications News, November 2005, pp. 40–42.
When someone accesses a Web page of one of Akamai's customers, special software on the client's Web server determines if there is an Akamai server containing any static parts of the requested information (e.g., graphics, advertisements, banners) closer to the user. If so, the customer's Web server redirects portions of the request to the Akamai server nearest the user. The user interacts with the customer's Web site for dynamic content or HTML pages with the Akamai server providing static content. In Figure 11.15, for example, when a user in Singapore requests a Web page from yahoo.com, the main yahoo.com server farm responds with the dynamic HTML page. This page contains several static graphic files. Rather than provide an address on the yahoo.com site, the Web page is dynamically changed by the Akamai software on the yahoo.com site to pull the static content from the Akamai server in Singapore. If you watch the bottom action bar closely on your Web browser while some of your favorite sites are loading, you'll see references to Akamai's servers. On any given day, 15–20 percent of all Web traffic worldwide comes from an Akamai server.
Akamai servers benefit both the users and the organizations that are Akamai's clients, as well as many ISPs and all Internet users not directly involved with the Web request. Because more Web content is now processed by the Akamai server and not the client organization's more distant Web server, the user benefits from a much faster response time; in Figure 11.15, for example, more requests never have to leave Singapore.
11.4 CONTENT CACHING AT THE SALT LAKE CITY OLYMPIC GAMES
MANAGEMENT FOCUS
The 2002 Olympic Winter Games in Salt Lake City needed a network infrastructure that would deliver real-time results, athlete biographies, transportation information, competition schedules, medal counts, competition results, and more to thousands of users (media, Olympic athletes, and staff) at sporting venues, Olympic villages, administrative offices, media centers, and external Web sites. The network had to guarantee maximum reliability 24 hours a day, seven days a week.
The Salt Lake City Olympic Committee established a primary data center with two high-performance load balancing switches in a standby/failover configuration supporting a server farm (see Figure 11.14) so that if one switch failed, the standby switch would detect the failure and automatically take over. The load balancing capability of the switches ensured that incoming traffic was routed to the least busy server, thereby ensuring maximum performance.
The primary data center was connected via a pair of routers (again in a standby/failover configuration) through T-3 lines to a secondary data center with a similar structure that would be used in the event of problems with the primary data center. The primary data center was connected via a pair of T-1 lines to the Media Center, to the Athletes Village, and to each of the 10 Competition Venues.
The network at the Media Center, the Athletes Village, and Competition Venues had a similar standby paired router/paired switch configuration, with the addition of a content engine to reduce traffic over the T-1 lines to the primary data center.
The resulting network design ensured maximum reliability due to the paired circuits/routers/switches to all locations. The content engines also provided increased reliability and significantly reduced network traffic to the primary data center, thus reducing the capacity needed by the circuits and servers.
__________
SOURCE: “IKANO Deploys Cisco Content Networking Solutions,” www.cisco.com, 2004.
The client organization benefits because it serves its users with less traffic reaching its Web server; Yahoo! for example, need not spend as much on its server farm or the Internet connection into its server farm. In our example, the ISPs providing the circuits across the Pacific benefit because now less traffic flows through their network—traffic that is not paid for because of Internet peering agreements. Likewise, all other Internet users in Singapore (as well as users in the United States accessing Web sites in Singapore) benefit because there is now less traffic across the Pacific and response times are faster.
11.5.5 Green IT
Green IT is the design and use of information technology to improve environmental sustainability. Much of Green IT focuses on reducing the amount of power consumed by and heat produced by network devices (because increased heat means the increased need for air conditioning, which requires power). Some network devices (e.g., servers, switches, routers) are designed to reduce power consumption and heat production. For example, smaller devices tend to require less electricity than larger devices.
One of the most important steps in Green IT is server virtualization, which we discussed previously. Server virtualization reduces the number of physical servers and thus is likely to have a large impact. Fewer computers means less energy and less heat.
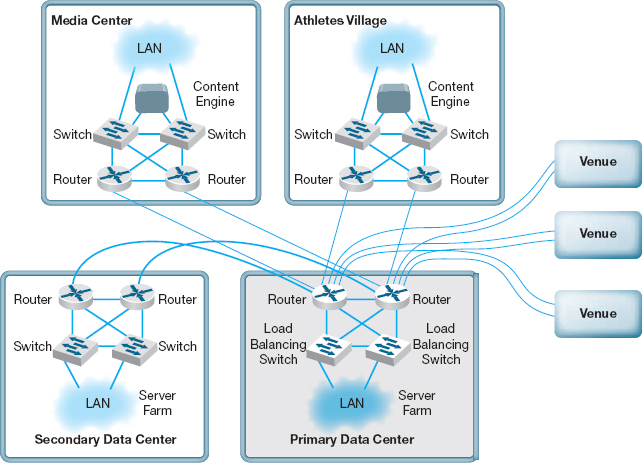
FIGURE 11.14 Olympic network. LAN = local area network
The use of content delivery is a similar Green IT strategy, as it means fewer less-used servers spread around the Internet.
Software can be installed that shuts off components within the device (e.g., a monitor or hard disk) after a certain time of inactivity to save energy. The newest Ethernet standard (IEEE 802.3az), for example, defines a change to the Ethernet protocol that permits NICs and switches to go into sleep mode to save energy when not transmitting. LANs are typically never used at 100 percent of capacity (most network circuits are active less than 10 percent of the time), so there is considerable potential to cut energy consumption.
Experts estimate that about 20 percent of the energy used in a typical office building is generated by IT. Thus, moving to green IT can save significant operating costs, as well as being better for the environment.
11.6 IMPLICATIONS FOR MANAGEMENT
Network design was at one time focused on providing the most efficient networks custom tailored to specific needs. Today, however, network design uses a building-block approach. Well-designed networks use a few common, standardized, network technologies over and over again throughout the network even though they might provide more capacity than needed. Under ideal circumstances, the organization will develop deep relationships with a very small set of vendors.
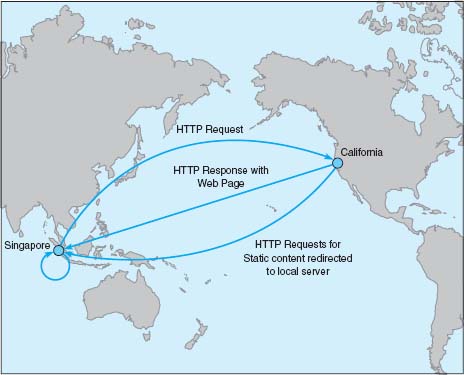
FIGURE 11.15 Network with content delivery
As the cost to operate and maintain networks gradually becomes more expensive than the cost to purchase network technologies in the first place, good network design commonly results in the purchase of more expensive equipment in order to save significantly more money in reduced network management costs over the life of the network. While there is a temptation to go with the lowest bidder and buy inexpensive equipment, in many cases this can significantly increase the lifecycle cost of a network. The use of sophisticated network design tools and network management tools has become a key part of almost all new networks installed today.
11.5 CONTENT DELIVERY AT BEST BUY
MANAGEMENT FOCUS
Best Buy operates more than 1150 retail electronic stores across the United States and Canada, and has an extensive online Web store offering more than 600,000 products. Its Web store hosts more than 4000 million visits a year, more than all of its 1150 physical stores combined.
Best Buy wanted to improve its Web store to improve customer experience and reduce operating costs. Akamai's extensive content delivery presence in North America enabled Best Buy to improve the speed of its Web transactions by 80 percent, resulting in substantial increases in sales. The shift to content delivery has also reduced the traffic to its own servers by more than 50 percent, reducing its operating costs.
__________
SOURCE: Akamai Helps Best Buy, Akamai case studies, akamai.com, 2008.
MANAGEMENT FOCUS
Avnet, Inc., located in Phoenix Arizona, is one of the largest distributors of electronic components, technology solutions, and computer products in the world. Through its supply chain, Avnet connects the world's leading technology manufacturers with customers in more than 70 countries. Avnet was ranked for two consecutive years as No.1 in its industry by Fortune magazine's list of “Most Admired Companies.” However, its success reaches beyond its specialization. Avnet is also one of the leaders in Green IT and was selected as the winner of InfoWorld's 2009 “Best Practices in Green Computing, Energy Efficiency and the Datacenter.”
According to the IT Director of the Data Center Operations, Bruce Gorshe, Avnet implemented many innovative solutions in the Data Center to be green—both with the IT itself and the building where the datacenter is located. First, by creating a heavily virtualized environment with 24 VMware ESX hosts, Avnet was able to reduce power consumption by 44 percent per image. Second, by developing a script that runs on all its desktops and laptops and places idle systems in hibernation during nonbusiness hours, the data center is able to reduce power consumption from 137 Watts to 1 Watt per computer. Third, re-foaming the data center ceiling and applying additional insulation allowed the cooling costs to go down by $7500 per year and also increased the longevity of the cooling system and roof. Finally, by switching to new more efficient lighting, related costs were reduced by 30 percent. This effort led to savings of more than $5 million in power supply for the data center. Thus, Green IT is not only good for the environment but also for the company that implements it.
__________
SOURCE: www.avnet.com, 2011.
SUMMARY
Traditional Network Design The traditional network design approach follows a very structured systems analysis and design process similar to that used to build application systems. It attempts to develop precise estimates of network traffic for each network user and network segment. Although this is expensive and time consuming, it works well for static or slowly evolving networks. Unfortunately, computer and networking technology is changing very rapidly, the growth in network traffic is immense, and hardware and circuit costs are relatively less expensive than they used to be. Therefore, use of the traditional network design approach is decreasing.
Building-Block Approach to Network Design The building-block approach attempts to build the network using a series of simple predefined building components, resulting in a simpler design process and a more easily managed network built with a smaller range of components. The basic process involves three steps that are performed repeatedly. Needs analysis involves developing a logical network design that includes the geographic scope of the network and a categorization of current and future network needs of the various network segments, users, and applications as either typical or high traffic. The next step, technology design, results in a set of one or more physical network designs. Network design and simulation tools can play an important role in selecting the technology that typical and high-volume users, applications, and network segments will use. The final step, cost assessment, gathers cost information for the network, usually through an RFP that specifies what equipment, software, and services are desired and asks vendors to provide their best prices. One of the keys to gaining acceptance by senior management of the network design lies in speaking management's language (cost, network growth, and reliability), not the language of the technology (Ethernet, ATM, and DSL).
Designing for Performance Network management software is critical to the design of reliable, high-performance networks. Device management software provides statistics about device utilizations and issues alerts when problems occur. System management software provides the same information, but also provides analysis and diagnosis to help the network manager make better decisions. Small networks often use device management software, while larger, more complex networks often use system management software. SNMP is a common standard for network management software and the managed devices that support it. Load balancing devices shift network traffic among servers in a server farm to ensure that no one server is overloaded with traffic. Content caching and content delivery are commonly used to reduce network traffic.
KEY TERMS
access layer
Akamai
agent
alarm
alarm storm
application management software
bandwidth limiter
bandwidth shaper
baseline
building-block process
capacity management
capacity planning
circuit loading
cluster
Common Management Interface Protocol (CMIP)
content caching
content delivery
content delivery provider
content engine
core layer
cost assessment
desirable requirements
device management software
distribution layer
geographic scope
green IT
latency
load balancing switch
logical network design
managed device
managed network
management information base (MIB)
mandatory requirements
needs analysis
network management software
physical network design
policy-based management remote monitoring (RMON)
request for proposal (RFP)
RMON probe
root cause analysis
server farm
server virtualization
service-level agreement (SLA)
Simple Network Management Protocol (SNMP)
simulation
system management software
technology design
traditional network design process
traffic analysis
turnpike effect
virtual server
wire speed
wish-list requirements
QUESTIONS
- What are the keys to designing a successful data communications network?
- How does the traditional approach to network design differ from the building-block approach?
- Describe the three major steps in current network design.
- What is the most important principle in designing networks?
- Why is it important to analyze needs in terms of both application systems and users?
- Describe the key parts of the technology design step.
- How can a network design tool help in network design?
- On what should the design plan be based?
- What is an RFP and why do companies use them?
- What are the key parts of an RFP?
- What are some major problems that can cause network designs to fail?
- What is a network baseline and when is it established?
- What issues are important to consider in explaining a network design to senior management?
- What is the turnpike effect and why is it important in network design?
- How can you design networks to improve performance?
- How does a managed network differ from an unmanaged network?
- Compare and contrast device management software, system management software, and application management software.
- What are SNMP and RMON?
- What is a traffic analysis and when is it useful?
- What is a service level agreement?
- How do device latency and memory affect performance?
- How does a load balancing switch work?
- How does content caching differ from content delivery?
- Why do you think some organizations were slow to adopt a building-block approach to network design?
- For what types of networks are network design tools most important? Why?
- How important is Green IT? Why?
EXERCISES
11-1. What factors might cause peak loads in a network? How can a network designer determine if they are important, and how are they taken into account when designing a data communications network?
11-2. Collect information about two network design tools and compare and contrast what they can and cannot do.
11-3. Investigate the latest versions of SNMP and RMON and describe the functions that have been added in the latest version of the standard.
11-4. Investigate and report on the purpose, relative advantages, and relative disadvantages of two network management software tools (e.g., Open-View, Tivoli).
11-5. Explore the network management software demo from Tivoli (www-306.IBM.com/software/tivoli/library/demos/twa-demo.html).
MINI-CASES
I. Computer Dynamics
Computer Dynamics is a microcomputer software development company that has a 300-computer network. The company is located in three adjacent five-story buildings in an office park, with about 100 computers in each building. Each building is approximately 90 feet long by 50 feet wide. They are set about 100 feet apart. The current network is poorly design for its current needs and must be completely replaced. Describe the network you would recommend and how it would be configured with the goal of building a new network that will support the company's needs for the next 3 years with few additional investments. Figure 11.16 provides a list of equipment and costs you can use to build your network. You will need to make some assumptions, so be sure to document your assumptions and explain why you have designed the network in this way.
II. Drop and Forge
Drop and Forge is a small manufacturing firm with a 60-computer network. The company has one very large manufacturing plant with an adjacent office building. The office building houses 50 computers, with an additional 10 computers in the plant. The current network is old and needs to be completely replaced. Describe the network you would recommend and how it would be configured. The goal is to build a new network that will support the company's needs for the next 3 years with few additional investments. Figure 11.16 provides a list of equipment and costs you can use to build your network. You will need to make some assumptions, so be sure to document your assumptions and explain why you have designed the network in this way.
III. Mary's Manufacturing
Mary's Manufacturing is a small manufacturing company that has a network with eight LANs (each with about 20 computers on them using switched 100Base-T) connected via 100Base-F over fiber-optic cable into a core switch (i.e., a collapsed BN). The switch is connected to the company's ISP over a fractional T1 circuit. Most computers are used for order processing and standard office applications, but some are used to control the manufacturing equipment in the plant. The current network is working fine and there have been no major problems, but Mary is wondering whether she should invest in network management software. It will cost about $5,000 to replace the current hardware with SNMP capable hardware. Mary can buy SNMP device management software for $2,000. Should Mary install SNMP? Why?
IV. AdviceNet
AdviceNet is a consulting firm with offices in Toronto, New York, Los Angeles, Dallas, and Atlanta. The firm currently uses the Internet to transmit data, but its needs are growing and it is concerned over the security of the Internet. The firm wants to establish its own private WAN. Consultants in all offices are frustrated at the current 56-Kbps modems they use for Internet access, so the firm believes that it needs faster data transmission capabilities. The firm has no records of data transmission, but it believes that the New York and Toronto offices send and receive the most data. The firm is growing by 20 percent per year and expects to open offices in Vancouver and Chicago within the next 1 or 2 years. Describe two alternatives for the network and explain what choice you would make under what assumptions.
V. Accurate Accounting
Accurate Accounting is a regional accounting firm that has several local offices throughout the state. The company is constructing a new office building for use as its main headquarters. The building is about 70 feet by 50 feet, with two floors. There are a total of 40 offices, with a total of 45 desktop computers. Describe the network you would recommend and how it would be configured. Figure 11.16 provides a list of equipment and costs you can use to build your network. You will need to make some assumptions, so be sure to document your assumptions and explain why you have designed the network in this way.
VI. Salt Lake City Olympics
Reread Management Focus 11.4. Do you think the Salt Lake City Olympic network was a good design? How might you have improved it? How might you have reduced costs?
VII. Donald's Distributing
Donald's Distributing is a regional trucking firm that is constructing a new office building (their only office). The building is about 140 feet by 90 feet. The network has 80 desktop computers and two servers. Describe the network you would recommend and how it would be configured. Figure 11.16 provides a list of equipment and costs you can use to build your network. You will need to make some assumptions, so be sure to document your assumptions and explain why you have designed the network in this way.
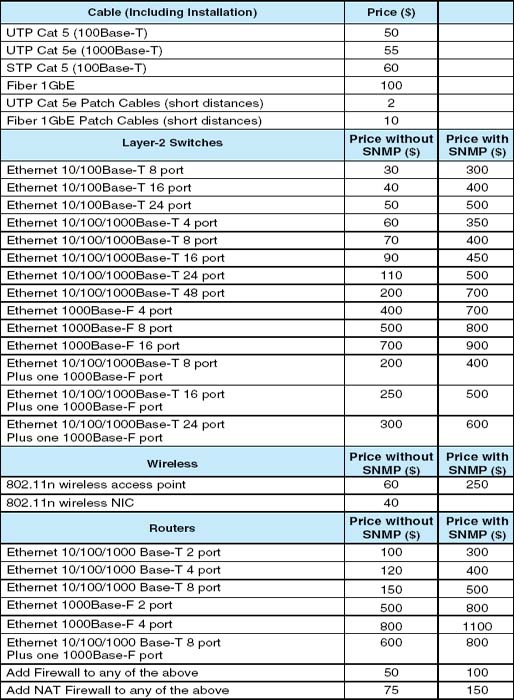
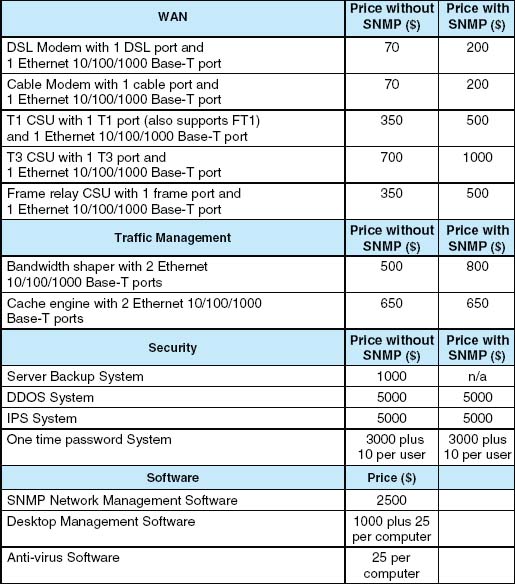
FIGURE 11.16 Network equipment price list
CASE STUDY
NEXT-DAY AIR SERVICE
See the Web site
HANDS-ON ACTIVITY 11A
Network Design Software
There are many different network design software tools. Some are simple drawing tools; others offer powerful network simulation modeling capabilities. One powerful tool that provides a free demo version that can be downloaded is SmartDraw.
The first step is to download and install the Smart-Draw software. The software is available at www.smartdraw.com.
SmartDraw comes with a variety of network icons and templates that can be used to quickly build network diagrams. Figure 11.17 shows the main drawing screen in SmartDraw and a network diagram.
Deliverable
- Select a network and draw it.
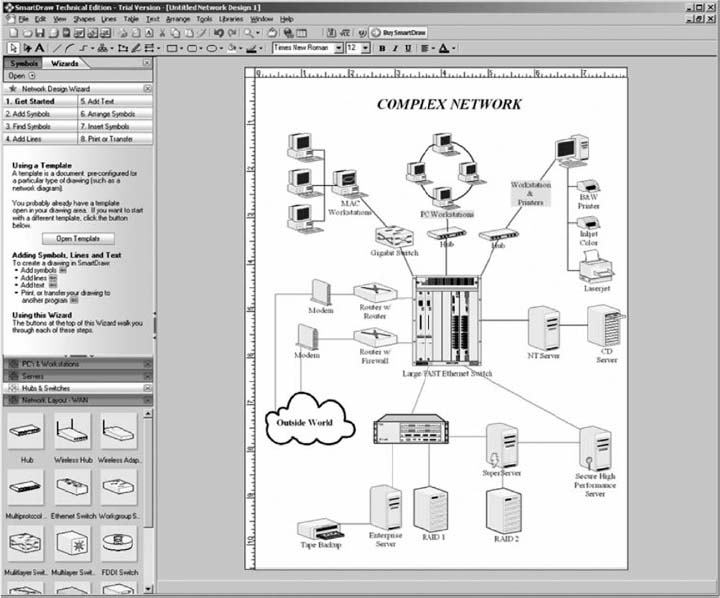
FIGURE 11.17 SmartDraw software
HANDS-ON ACTIVITY 11B
Monitoring AT&T's WAN
AT&T permits you to monitor their Global IP network. Go to ipnetwork.bgtmo.ip.att.net/pws and click on Look at your world wide network.
You'll see a screen like that in Figure 11.18 which shows the average delay (“latency”) of all the circuits at each of the major PoPs in their global IP network. You can select a city and see the round-trip delay (from the city to the other city and back again). Figure 11.18 shows the delays to and from Indianapolis. All are highlighted in green, which means the delays are below the desired maximum. They range from a low of 13 ms to St. Louis to a high of 60 ms to San Diego.
This also displays the percent of packets that have been lost in transit (either due to errors or overloading of circuits). All circuits are below the target maximum of 0.1 percent.
The tabs across the top of the screen (e.g., Network Delay, Network Loss, Averages) show summary data across the entire network.
Deliverables
- What is the current latency and packet loss between Dallas and Austin?
- What is the current latency and packet loss between Phoenix and New York?
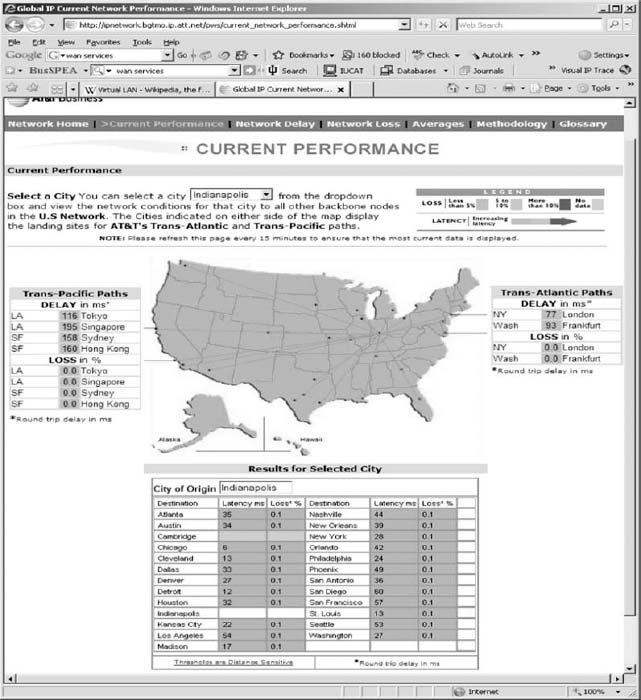
FIGURE 11.18 AT&T's global/IP network
1 It is important to understand that these three layers refer to geographic parts of the network, not the five conceptal layers in the network model, such as the application layer, transport layer, and so on.
2 Akamai (pronounced AH-kuh-my) is Hawaiian for intelligent, clever, and “cool.” See www.akamai.com.