
Chapter Ten
Design Fundamentals
- Introduction
- Introductory Case Study: Rock Lake
- The Design Process
- Design Factors
- Case Study: Chicago River Reversal
- Design Applications
- Outro
Learning Objectives
After reading this chapter, you should be able to:
- Describe the steps of the engineering design process.
- Demonstrate how the design process is applied to meet a need.
- Explain how constraints, regulations, standards, safety factors, design life, and risk affect the design process.
- Complete simplified designs for the major subdiscipline areas of infrastructure engineering.
Introduction
When asked the question “What do engineers do?” many children answer, “They build things.” A person with a vague understanding of engineering will likely respond, “They design things.” In many cases, both answers are correct. Without a doubt, the fundamental role of most engineers is design; however, as we have discussed in the previous chapter, design is not the only responsibility of an engineer, nor is it something that every engineer will do. Perhaps a better answer to the question is “engineers identify and solve problems.” This answer emphasizes that engineering is an all-encompassing discipline that includes much more than design alone.
In this chapter, we will start with a discussion of engineering design in general, and then present civil and environmental engineering design applications.

Introductory Case Study: Rock Lake
Property located along lakes and rivers typically has high market value because of recreational opportunities and aesthetics. These property values may decrease if water quality is impaired. Nutrients such as phosphorus can cause a decrease in water quality due to excessive algal growth (Figure 10.1) turning them pea-soup green in the summer. Residential, commercial, or industrial wastewaters may contain high concentrations of phosphorus. If the amount of phosphorus is high enough, water quality in a river or lake receiving these wastewaters will be impaired. Throughout this chapter, we will repeatedly refer to a hypothetical case study of Rock Lake, where wastewater from homes has caused an algal problem. Engineers solve problems, and before the solutions can be implemented, they must be designed.

Figure 10.1 A Photograph of an Intense Algal Bloom in a Lake.
Source: M. Penn.
To Engineer is Human
Henry Petroski, civil engineer and historian, has written many highly acclaimed books about engineering design including:
To Engineer is Human: The Role of Failure in Successful Design. New York: Vintage, 1992.
Success through Failure: The Paradox of Design. Princeton: Princeton University Press, 2008.
Invention by Design; How Engineers Get from Thought to Thing. Harvard: Harvard University Press, 1996.
The Design Process
ABET, Inc. (formerly the Accreditation Board for Engineering and Technology) uses this definition of design:
Engineering design is the process of devising a system, component, or process to meet desired needs. It is a decision-making process (often iterative), in which the basic sciences, mathematics, and the engineering sciences are applied to convert resources optimally to meet these stated needs.
Let's consider how this definition might apply to the design of a simple everyday item such as a pen. The designer must first determine the desired needs. For example, is the final product to be an inexpensive pen or an executive's pen? If you visit an office supply store, you will see dozens of different pens. Why so many? The answer is that there is a demand for many different types. What is different about them? Shape, material, color, life (disposable versus refillable), line width, and cost are among the major variables. An iterative decision-making process comes into play when you consider that many of these variables potentially conflict when designing a specified pen. The number of variables, and thus the challenge of design, increases dramatically as the “product” becomes more complex: from pens to alarm clocks to mobile phones to automobiles to skyscrapers.
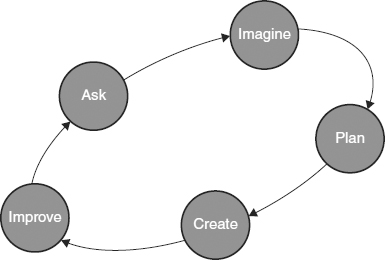
Figure 10.2 A Simplified Conceptualization of the Engineering Process.
Source: Adapted from the Museum of Science, Engineering Is Elementary Project.
Figure 10.2 is a conceptualization of the engineering design process, used by the organization Engineering is Elementary to introduce children to the field of engineering. We feel it is appropriate to use here, to help you envision engineering as a cyclical process. We start by identifying the problem (“Ask,” in Figure 10.2). Then we consider potential solutions (“Imagine”). Next we evaluate the solutions and choose the best one (“Plan”), and then implement the solution (“Create”). Often, further modifications are required as demands change or are re-evaluated (“Improve”), which leads us back to the first step in the process.
The Need for Design
You may not have thought of this before, but nearly everything around you was designed. The popular public radio program “Car Talk” centers around callers asking their car repair questions to two experienced (and humorous) mechanics. One of their favorite sayings about a “bad” car or component is that it was “unencumbered by the engineering design process”—sarcastically referring to the notion that it was not properly designed, in fact, implying that it was not designed at all!
More formally, the design process is defined to include the following steps:
- Identify a need (commonly referred to as the problem statement)
- Collect background information
- Develop alternative designs
- Evaluate various designs
- Select the best design
- Document the design
- Implement the solution
These seven steps are discussed in the following paragraphs. To help you understand the process, the steps are applied to the introductory case study. In this scenario, the Rock Lake Homeowner's Association approaches a local consulting engineering firm, and asks them to address the fact that the lake often turns green in the summer. The discolored water is caused by algal blooms, which causes the lake to become unsightly and occasionally foul smelling; but perhaps more importantly, the homeowners fear it will lower property values.
PROBLEM (NEED) IDENTIFICATION
Problem identification was previously discussed in Chapter 9, Engineering Analysis. As part of the design process, the need must be clearly specified, for a suitable design cannot be performed to effectively meet economic, social, and environmental needs without a clear objective. Often, design work (and thus product delivery), is prolonged because clarification of, or modification to, the original problem statement occurs. Depending on the project timeline, these changes can be quite problematic, especially if they occur after substantial preliminary design has been conducted.
The engineer studying the Rock Lake problem performed analysis to determine that the cause of the algal blooms is an excess of phosphorus in the lake. Phosphorus is a nutrient that, when present in high concentrations, allows the algae to grow very rapidly. Thus the problem can be redefined from preventing “green water” to reducing nutrient input.
Variations of Problem Identification
In many cases, a client has a clearly identified need and a desired approach (e.g., replacing concrete pavement on a city street with asphalt pavement). In other cases, the client may merely have identified a need (e.g., the wastewater treatment facility is not treating sewage to state standards). For some large projects (e.g., bridges, sports stadiums), clients offer a great deal of flexibility in the design approach. For such projects, large, reputable firms are invited to propose conceptual solutions to a panel (the majority of members being non-engineers).
Other Options for Controlling Algae
In addition to reducing nutrient input to the lake, other options exist to control algae. Copper sulfate can be added to the lake, but is expensive because repeated applications are required if the nutrient input is not reduced. In addition, there is concern over copper toxicity to desirable aquatic organisms. One very complex approach is biomanipulation, whereby attempts are made to control the biological assemblage of organisms in the lake (i.e., increasing the amount of organisms that feed upon algae). For the purposes of this chapter, only nutrient reduction approaches will be discussed.
COLLECTION OF BACKGROUND INFORMATION
Collection of information was also discussed in Chapter 9, but will be discussed further in this chapter with respect to design. Once a problem has been precisely and objectively defined, it is important to collect background information. What solutions have been implemented in the past to solve similar problems? “Starting from scratch” is often inefficient. Equally problematic is assuming that any solution must be based on previous solutions.
Many routine design aspects of engineering projects are simply adapted with minor changes from previous designs. In fact, it is common for entry-level engineers to be involved in this type of work to “learn the ropes.” As an engineer's skills and experience accumulate, he or she should be given increasingly challenging responsibilities. Young engineers can learn much from the collective experience of coworkers and from reviewing in-place solutions that were successfully implemented.
For the Rock Lake scenario, the engineer must determine the actual sources of the nutrient. Possible sources of nutrients include discharges of domestic wastewater, runoff of excess fertilizer, bird droppings, atmospheric deposition from rain and dust. By collecting and analyzing water samples from in and around the lake, it was determined that the primary source of nutrients is from the wastewater from individual homes. The homes surrounding the lake are currently served by individual septic systems, a very common method for wastewater treatment in rural areas. Septic systems consist of a tank in which solid particles settle out from the wastewater and degrade; the tank is followed by a drainfield from which the partly treated wastewater is allowed to seep into the soil, ultimately mixing with groundwater that flows into the lake. Research revealed that many of the septic systems are several decades old and while they are functioning to original specifications, the standards 30 years ago were not as stringent as those of today. The design of septic systems will be illustrated in the Environmental Engineering Design Application at the end of this chapter.
Just Deal With It
In many cases, one solution to a problem is the “do nothing” alternative, sometimes termed “no action.” This may be a defensible course of action if the costs (economic, environmental, or social) outweigh the benefits.
Creativity is an integral part of effective engineering design, and unfortunately it is a trait not associated with the stereotypical engineer, leading to this variation of the “Why did the chicken cross the road?” joke:
Why did the engineer cross the road?
He or she looked in the file and that's what the engineers did previously.
Employers are increasingly recruiting engineers that not only have strong technical skills, but are also creative and “global” thinkers (i.e., able to see a problem from many perspectives). The non-technical portion of undergraduate engineering degree requirements (humanities, fine arts, social sciences, history, etc.) is intended to develop these attributes. However, non-technical aspects of engineering are being increasingly incorporated into engineering courses as well. Indeed, a significant portion of this textbook focuses on nontechnical considerations.
Life-Long Learning
The importance of life-long learning (also termed professional development) cannot be understated. Engineers can get “stuck in a rut,” doing the same things over and over. By attending professional conferences, workshops, or short courses, and by reading professional journals, engineers can learn new approaches to problem solving. Many employers are very supportive of these activities for several reasons: (1) the company's capabilities (and thus profit potential) will increase as its employee skill set increases, (2) employees will be able to take on challenging work assignments and be less likely to become bored, which will help the company retain employees; (3) in many states, continuing education is required to maintain registration as a professional engineer (PE).
Note how the problem identification has progressed for this case study, from removing the green color from the lake to decreasing nutrient discharges into the lake to eliminating the domestic wastewater discharges. This refining of the problem is typical of many engineering projects.
DEVELOPMENT OF ALTERNATIVE DESIGNS
Engineers must think in terms of designs (plural) rather than design (singular). Rarely is there ever one correct solution. Typically, the client will meet regularly with the engineer initially to ensure that the problem is properly identified. But there is always potential for misinterpretation; thus, follow-up meetings are recommended. Engineers then develop several alternative designs to meet the stated objectives. To many engineers, this step is the most exciting, because it provides them with the opportunity to “pull all of the tools out of their toolbox.” Some of the designs might work, but can be ruled out for reasons such as cost—either initial cost (including capital cost) or lifetime costs (operation and maintenance, or O&M). In order to estimate the costs associated with an alternative design or to assess its feasibility, engineers must undertake preliminary engineering design.
After researching options, the engineer worked closely with the Rock Lake Homeowner's Association and proposed three possible alternatives to minimize the wastewater discharge to the lake. The three alternatives are illustrated in Figure 10.3:
Alternative A: replace all of the septic systems with new septic tanks and enlarged drainfields.
Alternative B: replace the septic systems with a sanitary sewer system and build a centralized wastewater treatment facility to treat the collected wastewater.
Alternative C: collect and pump the wastewater to a wastewater treatment facility at the nearby city.
Note that each of these alternatives will solve the problem—the next step is to select the “best” alternative.
EVALUATION OF DESIGNS
A proficient engineer not only can identify several possible solutions, but he or she has the knowledge to work with the client to determine the design that best meets their needs. Evaluation can take many forms. In some cases, especially with new technologies or new applications of existing technologies, prototypes (or pilots) are built and tested. In other cases, especially when pilots are prohibited by cost or short project timelines, computer modeling will be performed. When testing a design, all anticipated conditions should be considered. Many engineering failures result from improper testing or lack of consideration of potential situations in which the product will be used.
 Roadway Design Alternatives Case Study
Personal experience with automobiles may illustrate such “failures.” An engine design may be such that it is very compact, thus minimizing body size and maximizing gas mileage. But if the oil filter is surrounded by other components such that it cannot be readily accessed for changing the oil, the car's owner is not likely to be happy with the design.
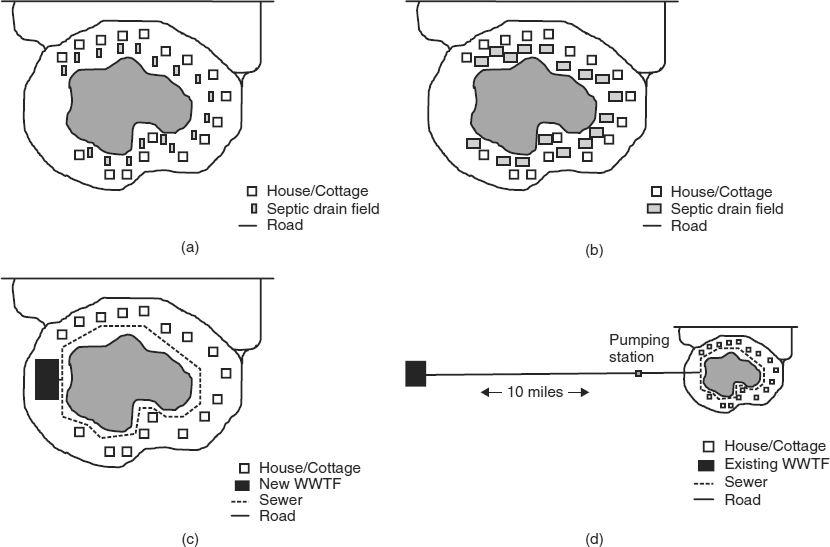
Figure 10.3 Illustration of Rock Lake Alternatives. (a) Original layout (b) Alternative A with improved (larger) drain fields. (c) Alternative B with new WWTF (d) Alternative C with conveyance to existing city WWTF (note change of scale).
Table 10.1 Decision Matrix for Rock Lake Alternatives Based on Ranking
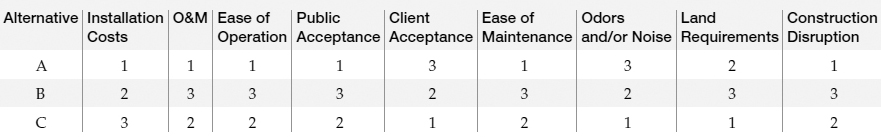
When comparing the three alternatives for Rock Lake, there are many competing variables. Importantly, initial (“upfront”) cost is not the only variable, nor is it necessarily the most important variable (although some clients may mistakenly think that it is). For example, the alternative that is the least expensive to install might have the highest operating cost; or, the alternative that has the lowest total cost may be the alternative that is the least likely to be readily accepted by the public. Additional expenses are often accepted by the client if the results are more aesthetically pleasing, safer, longer-lasting, or easier to operate.
A common method of comparing alternatives is to list all of the competing variables and arrange them in a matrix. For the Rock Lake project, variables include installation costs; operations and maintenance (O&M) costs; ease of operations; public acceptance; client acceptance; ease of maintenance; possibility of odors and noise; land requirements; and extent of disruption caused by construction. A spreadsheet was used to compile the matrix, and the results are shown in Table 10.1. In this matrix, each alternative was ranked for each variable; a score of 1 was assigned to the most favorable alternative, and a score of 3 was assigned to the least favorable alternative for a given criterion. Rankings may be objective, based on quantitative information (e.g., cost), or may be subjective (e.g., public acceptance).
SELECTION OF BEST DESIGN
Communication between the engineer and the client is critical to making sure that the best design is selected. For example, when presented with a real-life engineering problem, engineering students are typically very eager to apply their technical knowledge to solve the client's problem. Sometimes the students are “too eager” to solve the problem—they are convinced that their proposed solution is the best for the client, without allowing for input from the client.
Many engineering companies have acted in a similar manner. Especially in the field of consulting engineering, where the company is contracted by a client to solve a problem, the very nature of the client-engineer relationship is such that the engineer is more knowledgeable about the topic than the client. The client may underestimate the need for direct input, assuming the engineers are the experts. However, any engineered solution ultimately gets “handed over” to the client, and thus it is imperative that the client understands and accepts the solution, and that the solution meets current and future needs.
When presented to the Rock Lake Homeowner's Association, the decision matrix makes it relatively easy for the engineer and the non-engineering client to discuss the advantages and disadvantages of the different alternatives. Although in Table 10.1, Alternative A (replacing the existing septic tanks) has the most first place rankings, the client does not have a high opinion of continuing with a treatment practice that has failed in the past. Alternative C, although more expensive, has the advantage of being the “out of sight, out of mind” alternative, as witnessed by the favorable scores for Client Acceptance and Odors and Noise.
Table 10.2 Improved Matrix for Rock Lake Alternatives Based on Scoring (5 = Highest, 1 = Lowest)
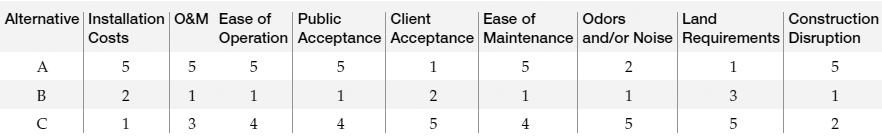
An improved matrix would include a scoring of each alternative for each variable (Table 10.2) rather than a ranking. This provides a more quantifiable basis for selection as it provides a degree of separation between alternatives. By ranking alone (e.g., 1, 2, 3) the relative difference between alternatives is not distinguishable, whereas a scoring of alternatives (e.g., 1 to 5, with 5 being the highest, most preferred rating) demonstrates that one alternative is not only preferred, but that it is perhaps much more preferred.
An additional improvement to the matrix would be to add a weighting factor to each variable (e.g., 0 to 1). The engineer and the client should work together to establish the weighting factors. This prevents incorrect assumptions by the engineer of the value that the client places on a variable, and prevents incorrect priorities by the client based on technical ignorance or misperceptions. By summing the value of each variable multiplied by its weighting factor, a total score for each alternate can be obtained (Table 10.3). When entered into a spreadsheet, weighting factors can be easily varied to see the impact on the total scores.
Table 10.3 Further Improvement of the Decision Matrix for Rock Lake Alternatives with Weighting Factors
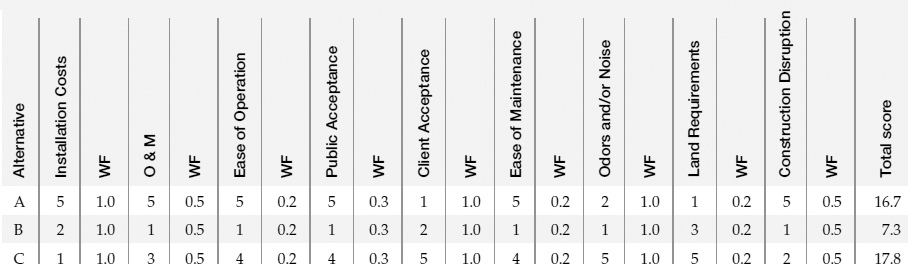
Note: Weighting factors are abbreviated as “WF” in this table.
From this decision matrix, Alternative C (highest score) can be established as the best design. Alternative B (lowest score) is clearly out of consideration. However, Alternative A has a score that is nearly as high as Alternative C. In such a case, when two alternatives have similar scores, revisiting the weighting factors may have merit.
DOCUMENTING THE DESIGN
Upon reaching an agreement with the client for the best design, the engineer must document the design in a final report. Additionally, intermediate reports are often prepared for clients to assist in the evaluation of alternatives. Details of the final report will vary depending on client requirements. Engineers also document the design through the specification of equipment and materials and design drawings needed to send the project out for construction bidding. Details must be accurate and easily interpreted such that the documents can be “handed over” to construction contractors, ideally without any need for clarification. Designs are typically reviewed and “stamped” by a licensed professional engineer. Documentation is also critical from a liability standpoint; if something “goes wrong” later, the question will arise as to whether the designer or the contractor is at fault. Final documentation also includes “as-built” drawings that incorporate changes that occurred during construction. Further documentation for the client includes operations and maintenance manuals.
Examples of Engineering Design Drawings
IMPLEMENTATION OF SOLUTION
In many ways, the implementation step of design is the most often overlooked yet most important step of the process. The best design is meaningless if it is not implemented in a manner so that the client ultimately uses it with satisfaction.
Don't Forget the End User(s)
A new multi-million dollar ice arena was constructed 15 miles from the authors' campus. A student that plays hockey was asked how he liked the new facility. “It's beautiful, but it was NOT designed for hockey players,” was his response. He is a goalie and has to carry two large bags of equipment. Apparently he has to open five different doors to get from the parking lot to the locker room! Spectators have to go through only two doors to get to their seats. Obviously, the designers were not hockey players.
Implementation is multi-faceted. It may involve any of the following: production, delivery, installation, training, operation, and maintenance. Each of these steps may vary in complexity depending on the scope of the project. An engineer's ability to foresee complications in any of these steps will lessen the likelihood of project failure or delay. Many of the implementation steps may require work with other companies (suppliers, subcontractors, etc.). Engineering firms work diligently to establish long-lasting and trusting relationships with suppliers and contractors.
Successful scheduling of implementation to ensure delivery to meet deadlines requires consideration of how each step of the process is interrelated and identification of critical components. As discussed in the Construction Engineering Analysis Application in the previous chapter, prioritization is very important. For example, ten parts from different suppliers may be needed to assemble a component, but if two of the ten are absolutely required before assembly can even begin, the scheduling must ensure their prioritized delivery. Flexibility is also important. In many civil and environmental construction projects, weather becomes a limiting factor, and must be accounted for when developing schedules.
Proper implementation of a design is the signature of its success. Only when a design is properly implemented will a client be fully satisfied. A satisfied client is obviously much more likely to hire an engineer in the future, and equally important, they are likely to speak favorably of the engineer to their peers, potentially leading to new clients.
Design Factors
Now that we have discussed the major steps of the design process, we will address some of the key factors that engineers must consider throughout the process.
DESIGN CONSTRAINTS
Without a doubt, life-cycle cost (capital and O&M over the expected life of the product) is typically the major constraint in any design. The client will be willing and able to spend a certain amount of money. For large projects, the money is often obtained as a loan, so additional costs are incurred due to interest payments over the borrowing period and the initial capital cost is indeed a major driver for decisions. For larger projects, preliminary engineering is performed to determine an estimate of the project cost, so that the client may determine whether or not undertaking the project is economically feasible. It would be short-sighted to begin a multi-million dollar project and proceed to the presentation of the best design, only to find out that the client cannot afford it.
In infrastructure engineering, the project site often provides many constraints. Listed below are several common examples:
- Size of the project site
- Need for buffer areas around the project
- Access to the site for both construction equipment and client requirements (e.g., a railway)
- Location of existing utilities (sewers, natural gas lines, water mains, electricity, etc.)
- Environmental factors (presence of wetlands, old dump sites, endangered species, etc.)
- Geologic setting (topography, soil depth, type of bedrock, etc.)
The engineer should conduct an extensive review of the site and determine which of the above (or other) constraints may impact design.
REGULATIONS
Engineering projects are required to meet many regulations established by federal, state, or local governments. The degree of regulatory requirements can vary substantially based on the type of project. Numerous permits are typically required and engineers spend a significant amount of time preparing applications for such permits. In many cases, construction work may not begin until permits have been granted, thus making this a critical step in the project timeline.
State-level regulations are referred to as codes, and can be thought of as rules that must be followed. State codes often specify both design criteria and performance criteria. Design criteria are objective requirements (e.g., pumps must be designed for a maximum flow of 10 gallons per minute). Performance criteria do not specify the type, size or shape of the material/components to be used, but rather set a target for performance (e.g., pumps must be designed to ensure that maximum expected flows can be conveyed). Design criteria significantly limit engineering options, whereas performance criteria allow engineers flexibility in design to meet the criteria. Engineers must be aware of all applicable codes on any project. While failure to meet code requirements does not guarantee that a design will not perform to meet client needs, it can result in penalties, delays, and loss of professional stature.
Situational Challenges
The Chicago River turns green once a year, but not because of algae blooms. The river is dyed green for the annual St. Patrick's Day Parade, an event that hosts over 15,000 marchers and draws in excess of 250,000 spectators. These large crowds create a temporary, but significant, stress on the infrastructure (especially with respect to street traffic).
St. Patrick's Day and the Chicago River
Many local governments establish ordinances that are more stringent than state or federal requirements. Again, it is critical that the engineer be aware of and understand all applicable local regulations. Examples of local ordinances include maximum building height, buffer requirements, setbacks from roadways or streams, lighting requirements, lot sizes, and parking provisions.
STANDARDS
In addition to federal, state and local regulations, many engineering subdisciplines have developed standards of practice. While there may be no direct legal requirement to follow these standards, they are developed by practicing engineers to serve as guidelines for design. Examples include Building Code Requirements for Structural Concrete (American Concrete Institute), Manual for Steel Construction (American Institute of Steel Construction), A Policy on Geometric Design of Highways and Streets (American Association of State Highway and Transportation Officials) and Recommended Standards for Wastewater Facilities (Great Lakes-Upper Mississippi River Board of State Public Health and Environmental Managers).
SAFETY FACTORS
Engineering work is inherently risky. The failure of a bridge or a drinking water treatment facility can lead to loss of human life, injury, and suffering. The conditions under which designed projects must function are highly variable. The very nature of civil engineering materials (steel, soil, pavement) contributes to the uncertainty. As a result, safety factors are often included in final designs. For example, the volume of a drinking water treatment process tank might be designed to be 100 cubic meters to meet state code. Common engineering practice might include a safety factor of 1.2, leading to a final designed volume of 120 cubic meters. By oversizing the tank, the engineer has provided a factor of safety so that it should meet treatment objectives in the event of unforeseen circumstances. Also, consider that bridges crossing waterways are required to have a certain amount of freeboard (the vertical distance between the bottom of the bridge deck and the top of the anticipated high water level); this freeboard is a type of safety factor which allows for the passing of ice and/or debris (e.g., fallen trees) and minimizes the risk of the bridge being overtopped by floodwaters. Geotechnical engineers use very large safety factors given the uncertainty inherent in the material (soil) with which they work. You will learn much more about safety factors in subsequent engineering courses.
In many cases, safety factors have been incorporated into codes or standards; it is important for the engineer to know if this is the case, because applying an additional safety factor may lead to overdesign and an unnecessary increase in cost. Safety factors also may vary depending on risk, where a higher factor will be applied if data to completely define the problem is lacking or of questionable quality.
ACCEPTABLE RISK
In many cases, designs are governed by an acceptable level of risk. For example, storm sewers that collect and convey stormwater are sized for a maximum design flow of water. If the runoff entering the sewers exceeds capacity, street flooding will occur. Engineers could size the pipes to convey any conceivable amount of water, but costs escalate as pipe size increases. Sewer pipes are often sized to handle storms with a 5 to 10 percent probability of occurring in a given year (in other words, there is a 90 to 95 percent probability that no street flooding will occur). The impact of street flooding is often minimal, isolated, and temporary.
On the other hand, levees and floodwalls are built to protect entire cities from floodwaters of rivers or storm surges of hurricanes. In these cases, the potential damage can be severe and tremendously expensive, which warrants greater expenditures to minimize risks. Floodwalls and levees are often designed to protect at the 0.5 to 1 percent probability level of overtopping. The costs to reduce this risk to an even lower level have been considered excessive in the past, but this is an issue of current debate in the profession.
It is very important that engineers communicate risk to the public. Citizens often assume that if a levee is in place that they are totally safe, when in fact, they are not. Billions of dollars are being spent redesigning and reconstructing the levees/floodwalls in New Orleans after the Hurricane Katrina disaster. The new system will protect at the 1 percent probability level. The Army Corps of Engineers is making great efforts to fully communicate this risk to the public.
DESIGN LIFE
The design life is the anticipated useful period (life) of a product or system. If properly designed and maintained and subjected to anticipated uses and conditions, the product/system should continue to meet client needs for at least the design life (and hopefully longer). The engineering extremes of design life range from temporary road diversions of a few weeks duration to 10,000 years for the Yucca Mountain Radioactive Waste Repository in Nevada. Design lives of civil and environmental projects are typically in the 20- to 100-year range (see Table 10.4).

As the design life increases, so does the uncertainty (and thus the risk) in predicting future conditions to which the design will be subjected over its lifetime. Inevitably, selecting a longer design life results in greater cost. Imagine designing a highway to last 100 years. An advantage of such a design would be that the pavement theoretically wouldn't have to be replaced for a century (which is three times longer than the 30-year design life of common pavements). However, the cost of constructing and designing a pavement capable of lasting this long would be extremely expensive, requiring current taxpayers to bear the entire financial burden of several generations in the future. Perhaps most importantly, we cannot adequately predict traffic volumes that will occur in 100 years. How many lanes would be required: two, four … six? If we underpredict the future demand, the highway would not meet requirements at its design life (imagine horrendous traffic jams) and it would have to be widened. If we overpredict future demand, we build an unnecessarily large and costly highway.
Table 10.4 Typical Design Lives of Various Components of Infrastructure Projects
| Project | Design life (years) |
| Commercial/Industrial buildings | 30–60 |
| Skyscrapers/Civic buildings | 120+ |
| Bridges | 30–100 |
| Dams | 50–100 |
| Drinking water treatment facilities —Concrete structures —Mechanical/Electrical |
60–70 15–25 |
| PVC pipelines | 75–100 |
| Pavements | 20–40 |
| Culverts | 20–75 |
| Retaining walls | 30–60 |
Proper maintenance is paramount to meeting and exceeding design life. It is very unlikely that a car engine will achieve 200,000 miles of use if the oil is not changed regularly. Likewise, civil and environmental engineering systems must be maintained. If a steel bridge is not painted at appropriate intervals, it will rust and weaken. If sewer pipes are not cleaned of debris and intruding tree roots, their capacity will greatly decrease and they may clog. The examples are endless. The engineer must work with the client and communicate not only the need for maintenance, but also the costs and implications of neglecting it.
Case Study: Chicago River Reversal
In the mid-1800s, much of Chicago's domestic sewage was discharged to the Chicago River. The Chicago River drained to Lake Michigan, which was the source of drinking water for the city. You may find this alarming, to imagine that a city would discharge its untreated waste into its drinking water source. However, the engineers of the day may have believed that enough dilution would occur to reduce the risk of disease, or perhaps they did not even consider the disease risk. Although you may consider this lack of consideration to be negligence on behalf of the engineers, you must remember that at the time, the link between wastewater-borne pathogens and drinking water related diseases such as cholera was only beginning to be understood.

With increasing awareness of the link between wastewater and water-borne diseases, engineers and city planners had identified a problem—a need to separate the wastewater discharge from the drinking water intake. Several alternatives existed, such as extending the intake for the drinking water treatment plant farther out into Lake Michigan. Another alternative was to discharge the wastewater far to the south and build a new drinking water intake farther to the north. Also considered was disposal of the sewage on land. Perhaps engineers considered building a wastewater treatment facility, but these were not common at that time. Another method considered was to reverse the flow of the Chicago River, such that it would flow out of Lake Michigan and empty into the Des Plaines River (see Figure 10.4 and Figure 10.5). Note that the Des Plaines River eventually flows into the Mississippi River, and thus this option would result in Chicago's untreated sewage being carried to the Gulf of Mexico rather than to Lake Michigan.
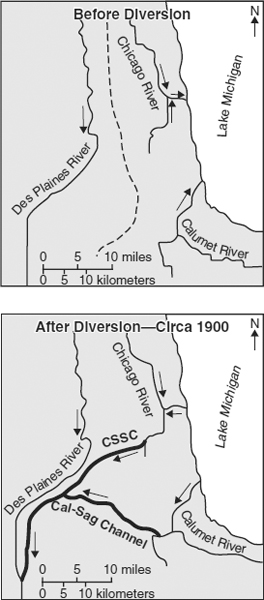
Figure 10.4 The Natural River System of the Chicago Area (Above) and the Engineered Canal System (Below) Including the Chicago Sanitary and Shipping Canal (CSSC) and the Cal-Sag Channel. The subcontinental divide (see Figure 10.5) is shown as dashed north-south line. Note the reversal of flow direction for the Chicago and Calumet Rivers.
Source: Adapted from U.S. Geological Survey, 1999.
You can imagine the many competing variables: cost, effectiveness, public acceptance, ability to meet regulatory requirements (of which there were very few at that time in history), etc. Technical feasibility was another variable. The reversal of a river surely would have appeared to many people as technically infeasible, but the river could be readily reversed by building a canal to connect the river to the Des Plaines River.
The river reversal option was chosen. It took 8 years and 8,500 workers to dig the 28-mile long canal from 1892 to 1900, without the aid of the heavy construction equipment that is available today. It is one of the largest public works project in history.
You might be surprised that the river reversal was the alternative that was chosen, as it seems so obvious today that this alternative was simply passing the problem onto the unfortunate people downstream, and in no way was protecting the environment. However, the reversal of the river was very effective, and combined with other technological advances of the time, helped dramatically decrease the incidences of water-borne diseases such as cholera. It is important to note, however, that the reversal of a river would very likely never be approved by regulatory agencies or accepted by the public today. In fact, there was substantial controversy surrounding the original plan, and additional controversy (and several lawsuits) regarding control of the amount of water flowing out of the lake. Note that such controversy is not uncommon for public projects. At any scale, each individual project has advantages and disadvantages, and as a result there are people who are in favor, and those that are opposed to the project.
This case study highlights many of the steps of the engineering design process, and emphasizes that “engineers identify and solve problems.” Moreover, the case study shows that engineers have had a dramatic influence on public health. Some have suggested that the 20-year addition to life expectancy during the 20th century can nearly all be attributed to the work of civil and environmental engineers. This dramatic increase in life expectancy is due to the widespread installation of sewage collection pipes, wastewater treatment, and drinking water treatment.
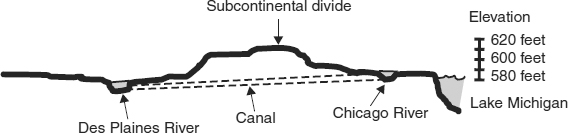
Figure 10.5 An East-West Cross-Section of the Area Shown in Figure 10.4. Vertical scale is exaggerated. The subcontinental divide is the ridge of highest elevation running north to south. Rivers to the east of the subcontinental divide flow into Lake Michigan and ultimately to the Atlantic Ocean via the St. Lawrence River. Rivers to the west of the divide flow to the Mississippi River and ultimately to the Gulf of Mexico. The canal diverts water across the natural divide.
Unfortunately, engineering solutions sometimes lead to future problems, and this is illustrated by the Chicago River reversal. For example, the placement of the canal established a direct hydrologic connection between the Great Lakes and the Mississippi River that did not previously exist. As a result, invasive species such as the Asian Carp (Figure 10.6) are free to travel up the river to the lakes and potentially disrupt the ecology; this is currently a major concern. In January 2010, the U.S. Supreme Court denied a request from several Great Lakes states to force the Army Corps of Engineers to shut navigational locks to prevent the carp from entering Lake Michigan. Scientists and engineers have installed electrical barriers in the canal to deter the carp from moving upriver, but the effectiveness of these devices is questioned.

Figure 10.6 An Invasive Species, the Asian Carp, is a Potential Threat to the Lake Michigan Ecosystem.
Source: U.S. Fish and Wildlife Service.
Further concerns have arisen with respect to very strict laws for water withdrawals from Lake Michigan. As water demand increases with population, there are more attempts to take water from Lake Michigan. Uncontrolled withdrawals could ultimately lead to a lowering of the lake's water level. Water withdrawals from all of the Great Lakes is strictly regulated by a commission representing the bordering states and provinces (Illinois, Indiana, Michigan, Minnesota, New York, Ohio, Pennsylvania, Wisconsin, and Ontario).
Design Applications
For the remainder of this chapter, we will present sample design tasks undertaken by five subdiscipline areas of civil and environmental engineering: construction engineering, environmental/water resources engineering, geotechnical engineering, structural engineering, and transportation engineering.
CONSTRUCTION ENGINEERING DESIGN APPLICATION–CUT AND FILL
Nearly all sites for which infrastructure components are designed require some amount of earthwork. The earthwork may take the form of excavating trenches or smoothing out irregularities in the land surface. In many instances, extensive earthwork is required to provide: a level site for a building pad, a corridor in which a roadway will be constructed, a level site for a parking lot, etc. Soil material may need to be excavated from a certain portion of the site (termed cut) and/or may need to be added to another portion of the site (termed fill).
For example, consider the building site shown in Figure 10.7. A level building pad needs to be created with the use of earth moving equipment for the proposed building. Since the site is not flat, a certain amount of cut and fill will be required. In other words, the low areas will need to be filled in and the high areas will need to be “dug out.” This can be understood by comparing two cross-sections.
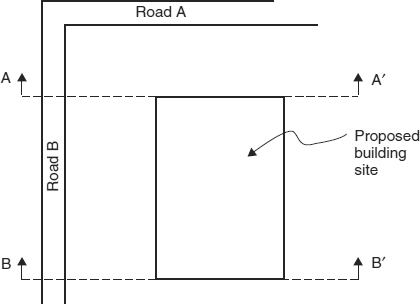
Figure 10.8 Cross-Section View, with Exaggerated Vertical Scale.
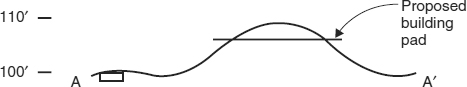
Figure 10.9 Cut and Fill Regions.
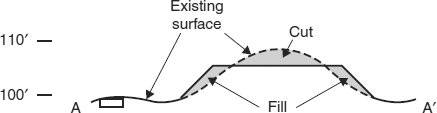
First, consider a profile (cross-section) of the land along the line labeled A-A′, as shown in Figure 10.8. The land elevations are shown using tic marks to the left of the drawing, and are expressed in feet (above some datum, often mean seal level, or MSL). Also shown in Figure 10.8 is the proposed building pad, to be constructed at an elevation of 105 feet. At the center of the building pad, earth will need to be excavated down to an elevation of 105 feet. At the edges of the building pad, backfill material will be needed to fill in the areas beneath the building pad but above the existing ground. Additionally, the soil will need to be sloped at a uniform slope away from the edge of the building pad. The proposed cut and fill plan is illustrated in Figure 10.9.
To estimate the quantity of cut and fill (a volume) for this site, we will introduce a method called the average end area method. First, consider that the shaded cut and fill regions in Figure 10.9 have an associated area, say in square feet.
Given a second cross-section, along B-B′, the volume of cut and fill between the two cross-sections can be estimated. Using the average end area method, the volume of cut (or fill) is calculated using Equation 10.1:
where
V = volume of cut (or fill)
A1 = the cross-sectional area of the cut (or fill) at the first cross-section
A2 = the cross-sectional area of the cut (or fill) at the second cross-section
L = the distance between the two cross-sections.
numerical example 10.1 Cut and Fill Volume
Assume that the area of cut in Figure 10.9 is 500 square feet and that a cross-section along B-B′ shows a cut area of 50 square feet. If the two cross-sections are separated by 100 feet, estimate the volume of cut.
solution
The volume of cut can be estimated by using Equation 10.1.
![]()
Just as engineers need to quantify the volume of cut and fill, they are also interested in whether the volumes of cut and fill balance. It is desirable that the volume of cut is approximately equal to the volume of fill for a given project; in such a case, the volume of cut and fill are said to be balanced. If a site has excess cut, the contractor must find a place to dispose of this cut material. If the site has excess fill, additional fill material must be trucked in from off site. Thus in cases of excess fill or cut, additional expenses are incurred.
Consider the case of building a new 5-mile road through existing irregular terrain. Imagine that to ensure accuracy in the volumes of cut and fill, you would need to obtain cross-sections every 50 feet and perform volume calculations between them. Clearly, this is a tedious and time-consuming process, as the roadway consists of more than 500 cross-sections. Computer software is used to perform these calculations, but the user should always verify the calculations by hand, using a simple method such as the end-area method, to ensure that the computer-generated values are realistic (i.e., to ensure that mistakes did not occur with data entry).
Cut and Fill Video
ENVIRONMENTAL ENGINEERING DESIGN APPLICATION—SEPTIC SYSTEMS
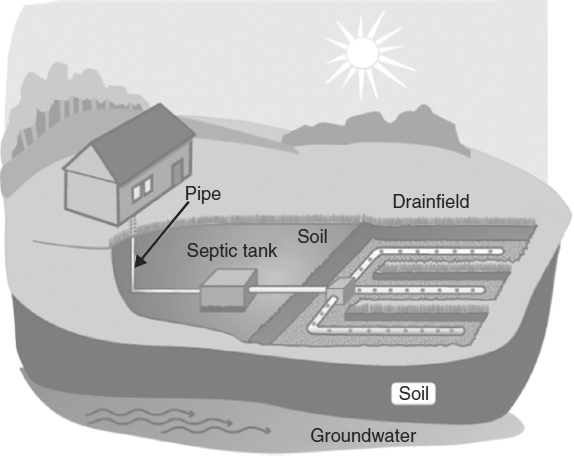
Municipalities collect wastewater from homes, industries, stores, etc., using sewers that convey the wastewater to treatment facilities. In rural areas, because of low population densities, it is not feasible to install sewer systems. As a result, rural homes, schools, and other facilities typically have on-site treatment of wastewater using septic systems. The Environmental Protection Agency (EPA) estimates that 25 percent of all homes in the nation use septic systems. A typical residential septic system is shown in Figure 10.10. The typical septic system includes a septic tank for collecting settling solids and a drainfield.
A drainfield is a distribution system of pipes that releases the partially treated wastewater from the septic tank into the soil.
Treatment occurs in the drainfield by two primary mechanisms: decomposition by bacteria and adsorption (attaching) of contaminants to soil particles.
Figure 10.10 Cut-Away View of a Typical Residential Septic System.
Source: EPA, 2005.
A site assessment is required to determine the type of soil at the site. If the soil is too sandy, or if the groundwater table is close to the land surface, the septic tank effluent may percolate too quickly into the groundwater below.
Without sufficient natural soil treatment, neighboring drinking water wells may be at risk of contamination. If the soil contains too many fines (silt and clay), the septic tank effluent will not percolate down through the soil and can accumulate in the drainfield, potentially pooling at the ground surface and producing a health hazard. In the Geotechnical Engineering Analysis Application in Chapter 9, you learned about soil size distributions and soil textures. This information may be used to determine whether or not a site is appropriate for a septic system. In some cases, sites are not appropriate. When purchasing rural land for a future home site, the buyer should always confirm that the site is suitable for a septic system. If it is not, more costly options such as a holding tank may be required.
Wastewater that is discharged after treatment is termed effluent.
Typical design considerations for septic systems are:
- What volume is required for the septic tank to achieve proper settling?
- What are the dimensions of the drainfield?
A holding tank is a storage tank for wastewater. It must be frequently pumped out at significant expense.
SEPTIC TANK DESIGN A typical septic tank is shown in Figure 10.11. While the primary treatment objective is to collect settleable solids, additional treatment also occurs. Fats, oils, and greases (collectively termed scum) float on water, and the PVC tees at the inlet and outlet of the tank are designed to trap these substances. Biological decomposition of organic wastes also occurs in the tank. All three of these treatment processes are fundamental to municipal wastewater treatment, and are performed in more highly engineered systems at larger wastewater treatment facilities. Proper “operation” of a septic tank requires that accumulated sludge must be periodically removed to avoid septic system failure.
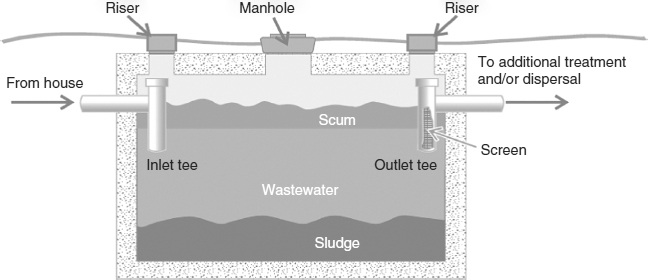
Figure 10.11 Cross-Section of a Septic Tank.
Source: EPA, 2005.
The size of a septic tank is based on the concept of detention time, τ, which is the average amount of time that water remains in the tank. Detention time is calculated using Equation 10.2:
where
V = tank volume
Q = flowrate
Equation 10.2 can be rearranged to solve for the necessary tank volume:
Requirements for septic tank detention time vary from state to state, depending on design codes. A typical value is 24 hours. The flowrate of wastewater depends on water usage in a home. Typically, state codes provide a value for wastewater flowrate per person (or per capita), which can be multiplied by the number of bedrooms (assuming two parents in one bedroom and one child per additional bedroom) to get the total flowrate.
Typical residential wastewater generation is 50 to 60 gallons per person per day. However, if we designed for the average flow, we would be underestimating the flow of approximately half of all homes. However, if we design for extreme flows (e.g., 200 gallons per person per day), most homeowners would end up with tanks that were larger (and more costlier) than necessary. Another consideration is that new homes often have more water efficient appliances, toilets, etc. A value of 70 gallons per capita per day is often recommended, but state or local codes may provide specific requirements.
numerical example 10.2 Septic Tank Sizing
Determine the tank size for a three-bedroom home.
solution
For design purposes, a three-bedroom home (for four residents) is expected to generate 280 gallons per day. For a 24-hour (1-day) detention time, a 280-gallon tank would be required, as determined by Equation 10.3:
![]()
However, as mentioned previously, solids (or sludge) settle in the bottom of the tank. This effectively decreases the storage volume of the tank for water above the sludge. As the effective volume decreases, the detention time (and thus treatment efficiency) also decreases. It is common to double the size of the tank to account for sludge accumulation. Thus our required tank size will be 560 gallons.
Septic tanks are supplied by manufacturers in incremental sizes (e.g., 500, 750, 1,000 gallons). To special-order a 560-gallon tank would cost more than a stocked 750-gallon tank; therefore, we will round up to the next largest size and choose the 750-gallon tank. (Note that this practice of altering designs to meet supplier specifications is routine in engineering.)
DRAINFIELD DESIGN A drainfield has two key design criteria: total area (square feet) and shape (length × width). The area is based on the soils at the site. The shape is determined by lot size, location relative to the home, requirements for separation (or setbacks) from lot lines, and other factors. Many state codes have specific requirements for drainfield area based on soil type. One such design standard is the application rate (AR), the maximum flowrate of septic tank effluent to seep through a given area of soil. Typical values for application rates of septic tank effluent range from 0.2 to 1.0 gallons per square feet per day. Drainfields are often constructed of parallel pipes in trenches. Total drainfield area is a function of trench area and the spacing between parallel trenches (often 8 to 10 feet from center to center of parallel pipes). Trench width is often 5 feet, and pipe lengths are often required to be less than or equal to 100 feet (to minimize maintenance problems). Trenches are typically several feet deep and are dug parallel to topographic contours (i.e., they are “level”). Trenches are backfilled with gravel once the slotted drainpipes are installed, and covered with topsoil for seeding. Filter fabric is placed between the gravel and the topsoil to prevent fine particles from the soil from washing down into the gravel and clogging the drainpipes.
The trench area is calculated using Equation 10.4:
where
A = trench area
Q = flowrate
AR = application rate
Trench length is calculated by dividing the trench area by the trench width.
numerical example 10.3 Drainfield Sizing
Determine the size for a drainfield to follow the septic tank sized in the previous example, given that AR = 0.4 gallons per square feet per day. Also, given a trench width of 5 feet, a maximum trench length of 100 feet, and the fact that trenches are to be spaced 10 feet on centers, provide a possible layout for the trenches.
The trench area can be obtained from Equation 10.4:
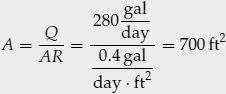
By dividing the total area by the trench width (5 feet), we obtain a total trench length of 140 feet. Since the maximum trench length is 100 feet, the system would likely be designed as two 70-foot trenches, or three 47-foot trenches (or perhaps even four 35-foot trenches depending on site layout).
The drainfield layout for three 47-foot trenches is shown in Figure 10.12.
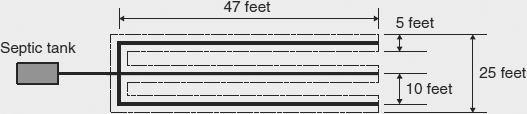
Figure 10.12 Plan View of Drainfield Layout.
GEOTECHNICAL ENGINEERING DESIGN APPLICATION—FOOTINGS
Footings are used to distribute the weight of the foundation and its overlying structure to the underlying soil or rock. A spread footing, on which the foundation wall rests, is illustrated in Figure 10.13. Various types of soil and rock have differing abilities to support a load. If too much weight is applied to a unit area of soil, the soil will compress, resulting in unwanted settlement. Evenly distributed settlement will result in a lowering of the elevation of the structure. Uneven, or differential, settlement may result in the tilting of a structure (e.g., the Leaning Tower of Pisa in Italy, or the bridge in Figure 10.14) or the formation of cracks in foundation walls (Figure 10.15), which compromise structural integrity. Properly designed and constructed footings prevent settlement.
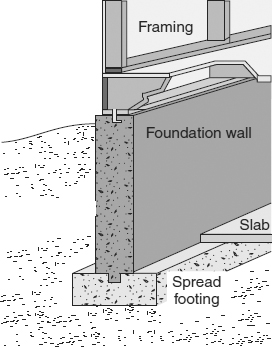
Figure 10.13 Diagram of a Spread Footing.
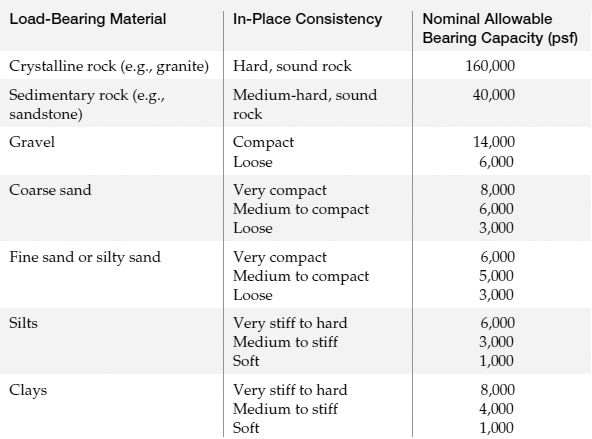
The strength of a soil is characterized by its bearing capacity (also referred to as its load capacity) and is expressed as a force per unit area. The bearing capacities (in pounds per square foot, psf) of various geologic materials are shown in Table 10.5. Actual values may be determined by geologic testing of the material at a building site to ensure proper design. Note that the bearing capacity is significantly dependent on how much the soil is compacted.
The lower the bearing capacity, the more susceptible a soil is to compaction, and thus settlement, and the larger the footing area requirement to spread the weight of the structure and its foundation.
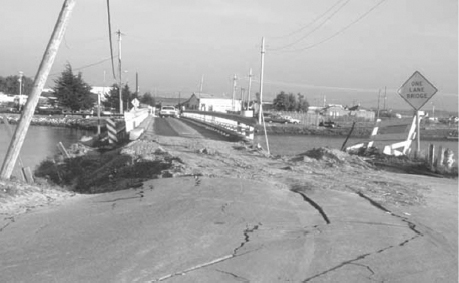
Figure 10.14 Differential Settlement of the Foundation (Abutment) of a Bridge.
Note that the right side of the bridge entrance is lower than the left.
Source: U.S. Geological Survey.
A simplified approach to footing design follows.
Step 1: Determine footing area.
where
Afooting = footing area
W = structure weight
q = bearing capacity
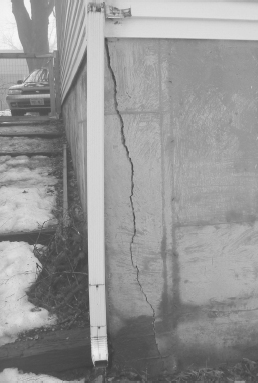
Figure 10.15 A Cracked Foundation Wall Caused by Differential Settlement. The crack extends from the bottom of the concrete wall to the top, and is wider at the top. The right side of the wall settled more than the left, placing the wall in tension. As a result of the crack, the structural integrity of the wall is compromised. The portion of the wall to the right of the crack is tilting (rotating at the base of the wall) toward the viewer.
Source: M. Penn.
Table 10.5 Bearing Capacities of Soils and Rocks
Step 2: Determine footing width:
where
B = footing width
P = perimeter length of foundation wall
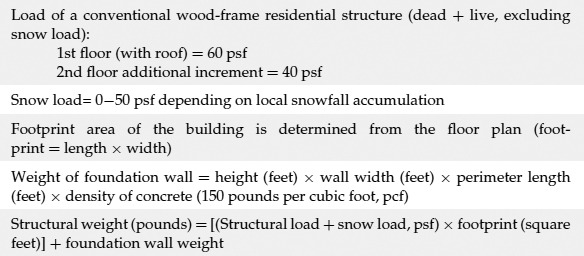
The weight of the structure is the sum of the dead load (structural components such as foundation wall, floors, joists, roofing), the occupancy live load (furnishings, appliances), and the snow load on the roof, if applicable, which can be quite substantial in areas receiving heavy snowfalls (e.g., 40 psf in Minnesota). Some “rules of thumb” values that can be used for preliminary calculations are found in Table 10.6.
Table 10.6 Typical Values for Footing Calculations
numerical example 10.4 Footing Width Determination
Determine the footing width for a two-story 3,200 square feet home to be built on a silty sand site in Minnesota. Foundation walls are made of 8 inch-thick concrete and are 8 feet tall. Assume a snow load of 40 psf.
solution
The building footprint is obtained by assuming that each story is of equal area.
![]()
The dimensions of the floor plan can be obtained by assuming a square floor plan. Consequently, the dimensions are 40 feet × 40 feet. Given these dimensions, the perimeter length of the foundation walls is determined to be 160 feet (=4 sides × 40 feet per side).
Given this information and the rules of thumb in Table 10.6, the weight of the structure can be calculated. We will assume that the roof area is equal to the footprint area.
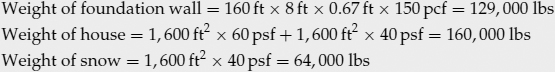
Thus, the total weight to be supported by footings equals 353,000 pounds. Given this weight, the footing area and width can be calculated using Equation 10.5 and Equation 10.6, respectively. From Table 10.5, the bearing capacity of the soil is 4,000 psf.
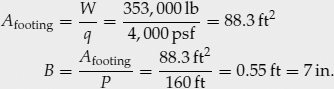
Note that this width is less than the wall width (8 inches), and thus, for this application, no footing may be required. However, if the soil had a load bearing capacity of only 2,000 psf, the footing width would double to 14 inches. Thus the footing width required for a given structural load is inversely proportional to the load bearing capacity of the soil. Often, safety factors in the range of 1.5 to 2.5 are applied, so that the design footing width will be larger than the calculated footing width.
The design of footings must also take into account the strength of the concrete itself; that is, the concrete footing must be strong enough to support the overlying load. You will learn about the strength of concrete and the reinforcement of concrete with steel in subsequent civil engineering courses. Depending on the type and scale of the structure and the soil at a site, footing designs may be much more complex and require additional geotechnical and structural knowledge.
MUNICIPAL ENGINEERING DESIGN APPLICATION—LAND DEVELOPMENT
One common design task for engineers involved in land development is to divide up a piece of land into parcels. The parcels may be developed for any number of clients, including commercial, business, retail, and residential. For this application, we will consider the dividing of land into residential building lots.
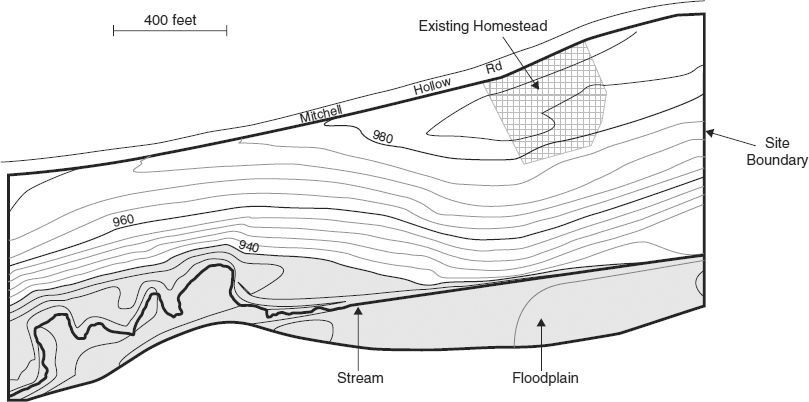
Consider a site to be developed as shown in Figure 10.16. It is nearly 28 acres in size, and is bounded by a road to the north and a stream to the south. The site slopes down to a creek, and the 100-year floodplain is identified in Figure 10.16. You should be able to verify this size using an engineering scale.
How to Use an Engineering Scale
The manner in which land is divided into parcels will depend on many site constraints. For this site, specific constraints are defined as follows:
- Most parcels are to be sized between one-fourth and one-third of an acre.
- Roads are to be 40 feet wide.
- Cul-de-sacs, if used, are to have a diameter of 90 feet.
- The newly created subdivision should provide no more than two access points to the existing Mitchell Hollow Road.
- Houses will have a footprint of about 2,000 square feet.
- Each parcel must have 60 feet of frontage on the road. Frontage is defined as the full length of a parcel measured alongside the road on which it borders.
Figure 10.16 Proposed Land to be Developed. Topographic contour interval is 4 feet.
- Portions of the floodplain can be included in parcels, but houses cannot be built within the floodplain.
- 5 percent of the developable land must be left open for parks/recreation/nature areas.
- In addition, the subdivision of the land into parcels should minimize the number of odd-shaped lots.
There are many feasible ways of dividing the land into parcels. One possible solution is shown in Figure 10.17, which contains 65 lots. For this solution, the developer chose to not include the floodplain in any of the parcels; rather, this area will be set aside as a nature area/parkland.

Figure 10.17 Sample Residential Layout.
STRUCTURAL ENGINEERING DESIGN APPLICATION—BRIDGES

Many bridges are considered among the greatest achievements of civil engineers (e.g., the Brooklyn Bridge in New York City shown in Figure 10.18, which was built in 1883). The structural design of bridges is very complex, but a simplified process (for educational purposes only) for truss bridges has been incorporated into the West Point Bridge Design software that is available for download.
West Point Bridge Design Software
Truss bridges serve as a classic example to demonstrate how bridge structures balance forces. Structural members of a truss, depending on design, may be under tension or compression. Depending on the distribution of the load being supported, the size of the structural members (and their connections) must be appropriately designed.
The West Point Bridge Design software allows you to analyze compression and tension of a truss bridge using different sizes, cross-sectional shapes, and materials for the truss members. The best design provides a structurally sound bridge for the least cost (including not only materials, but also construction and maintenance).
In addition to functionality (span length, number of traffic lanes, clearance height for boat traffic above high water level, etc.), aesthetics often plays a key role in bridge design. Large bridges are icons of a city or region, and often significant additional expenditures are made for aesthetic reasons (Figure 10.19).
TRANSPORTATION ENGINEERING DESIGN APPLICATION—INLET SPACING
One task facing transportation engineers is to ensure that rainwater is effectively and safely conveyed out of the traffic lanes. For this reason, most roads are crowned in the middle; that is, the highest point of a road's cross-section is in the center of the roadway. The most typical cross slope is 2 percent (i.e., 2 inches per 100 inches).
Figure 10.18 Brooklyn Bridge.
Source: Copyright © Klaas Lingbeek-van Kranen/iStockphoto.

Figure 10.19 The Juscelino Kubitschek Bridge in Brazil.
Source: Copyright © OSTILL/iStockphoto.


After water is conveyed to the edge of the road by the road's crown, the water is conveyed in gutters along the road's edge. A curb serves to keep the water in the gutter's channel. As the water travels in the gutter, the flow increases as additional water from the roadway is collected. Consequently, the gutter flow of water will begin to spread out into the roadway. An inlet is installed in the gutter to intercept this flow and to convey the water to a sub-surface storm sewer network or into a receiving stream or ditch.
The most common type of an inlet is a combination inlet (Figure 10.20), a combination of a grate set into the bottom of the gutter and an opening in the side of the curb. If the grate does not clog with debris, then stormwater will be captured by the grate as long as the flowrate does not exceed the grate capacity. If the grate clogs, the curb opening will capture less of the stormwater and the excess stormwater will bypass to the next inlet.
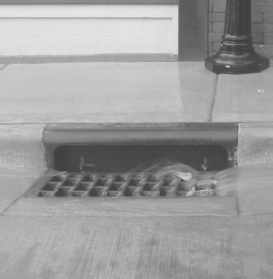
Figure 10.20 Stormwater Entering a Combination Inlet.
Source: M. Penn.
Inlets must be spaced such that the spread of water does not become too large. One common standard for stormwater inlet spacing is to ensure that the width of one travel lane (e.g., 12 feet) is open to allow for emergency vehicles to pass. This standard applies to a storm of a certain rainfall intensity (often expressed in inches per hour). This intensity is typically set equal to the known intensity of a 10-year storm for a given locale.
Spread is the distance from the curb to the edge of the flowing water in the street.
To determine the spacing of inlets, an inlet must be located such that it prevents the spread from becoming too large. The flowrate that will cause this allowable spread to occur can be estimated using Manning's Equation (Equation 9.2 in Chapter 9). Once this flow is known, the amount of contributing area (watershed) that will generate this amount of flow can be estimated using the Rational Method (Equation 9.1 in Chapter 9). It is this contributing area that dictates the spacing. These concepts are best illustrated with an example.
numerical example 10.5 Inlet Location
Consider a 36-foot wide roadway that is crowned in the center with a 2.0 percent slope. The roadway, along with a 6.0-inch high curb, is shown schematically in Figure 10.21. Also note that the roadway has a longitudinal slope (along the roadway centerline, into the page) of 1.0 percent (0.010 foot/foot). A ridge runs parallel to each side of the roadway, such that 100 feet of land on each side of the road contributes runoff to the road. Determine the location of the “first” inlet (i.e., the first inlet from the top, or crest, of the 1.0 percent road centerline). We will use a rainfall intensity of 4.0 inches/hour for our analysis.
solution
The spread for the cross-section in Figure 10.21 is 12 feet, which allows for a 12-foot lane to remain open during the design rain event. Given this spread and the cross-section geometry, we can use Manning's Equation to estimate the flow that this cross-section can convey.
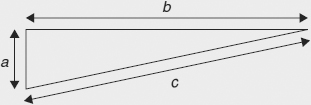
Recall Manning's Equation (Equation 9.2 ![]() . The area (A) and hydraulic radius (Rh) for the channel can be obtained from Figure 10.22, which is an exaggerated drawing of the flow cross-section. The length b is equal to the allowable spread (12 feet). The length a is equal to the height of water at the curb, and can be calculated knowing the cross slope (2.0 percent, or 2 feet of rise per 100 feet of run). Thus, a is equal to 0.24 feet (12 feet × 0.02 foot/foot). From this information, the cross-sectional area of the triangle in Figure 10.22 is the area of a triangle (0.5 ·b·h = 1.44 ft2). The wetted perimeter is equal to the sum of a and c, and given the small angle formed by b and c, the length of c is essentially equal to b. Thus, the wetted perimeter is equal to 12.24 feet† and the hydraulic radius (A/P) is found to be 0.12 feet. By inserting the values of A, Rh, So (0.010 foot/foot), and n (0.016) into Manning's Equation, we calculate the flowrate to be 3.3 cfs. This is the flow conveyed by one of the flow cross-sections depicted in Figure 10.21.
. The area (A) and hydraulic radius (Rh) for the channel can be obtained from Figure 10.22, which is an exaggerated drawing of the flow cross-section. The length b is equal to the allowable spread (12 feet). The length a is equal to the height of water at the curb, and can be calculated knowing the cross slope (2.0 percent, or 2 feet of rise per 100 feet of run). Thus, a is equal to 0.24 feet (12 feet × 0.02 foot/foot). From this information, the cross-sectional area of the triangle in Figure 10.22 is the area of a triangle (0.5 ·b·h = 1.44 ft2). The wetted perimeter is equal to the sum of a and c, and given the small angle formed by b and c, the length of c is essentially equal to b. Thus, the wetted perimeter is equal to 12.24 feet† and the hydraulic radius (A/P) is found to be 0.12 feet. By inserting the values of A, Rh, So (0.010 foot/foot), and n (0.016) into Manning's Equation, we calculate the flowrate to be 3.3 cfs. This is the flow conveyed by one of the flow cross-sections depicted in Figure 10.21.
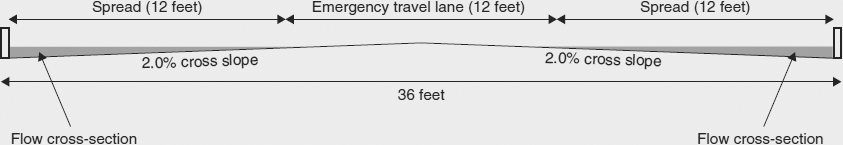
Figure 10.21 Schematic of Roadway Cross Slope (Exaggerated Vertical Scale) and Spread of Accumulated Stormwater.
Figure 10.22 Channel Cross-Section.
To determine the inlet spacing that will preclude the spread from being greater than 12 feet, the length of roadway that will produce a flow of 3.3 cfs must be determined. This can be calculated by solving the Rational Method (Equation 9.1: Qp = CiA) for area (A), and then calculating the length of roadway that corresponds to this area. The intensity, i, is given as 4.0 inches/hour and we will assume that C for the roadway and adjoining land area is 0.50 (corresponding to the high end of “single family residential” values in Table 9.1 in Chapter 9). Therefore, the Rational Method equation can be solved for area, A.
![]()
This value represents a rectangular area of land and roadway that contributes runoff to an inlet. This rectangle has a width of 118 feet (corresponding to one-half of the roadway plus the distance from the back of the curb to the ridge line). Consequently, the length of the rectangle is 322 feet (320 feet expressed to the correct number of significant figures), and this length represents the distance from the crest of the roadway to the first inlet. Note that inlets are required on both sides of a crowned roadway.
†Note that in the case of intermediate calculations, an “incorrect” number of significant figures should be used in order for the final answer to be correctly calculated. Otherwise, if intermediate calculations are rounded off, this could result in error being propagated through the calculations.
This example illustrates the concepts involved in spacing inlets and has necessarily made many simplifying assumptions. For example, the longitudinal slope typically changes along the length of the roadway depending on topography. You might be wondering what the spacing of the next inlet should be. Most likely it will be closer, given that the first inlet will not collect all of the flow, but will bypass a certain amount of it because the spread of water extends into the roadway beyond the capture zone of the inlet.
Outro
For most engineers, their primary responsibility is, in fact, design work. The design process allows the engineer to methodically develop and evaluate solutions to problems while accounting for design constraints. The details of final designs require technical skills that you will develop in subsequent courses, and throughout your career. Bringing the designs to fruition requires excellent communication skills and attention to detail during implementation.
chapter Ten Homework Problems
- 10.1 For the area of land shown in Figure 10.16, create an alternative lot layout. Use lots that are approximately 1 acre in size. Your final design should meet all other constraints used for the lot layout in Figure 10.17. What is the roadway length for your layout? How does it compare to the roadway length in Figure 10.17? (One of the common goals of residential land development is to minimize the ratio of roadway length to the number of parcels.)
- 10.2 Reconsider the road cross-section in Figure 10.21. How much more flow could be conveyed by that cross-section if the allowable spread was 14 feet instead of 12 feet?
- 10.3 Reconsider Numerical Example 10.5. How would the distance to the first inlet vary if the longitudinal slope was only 0.0010 foot/foot?
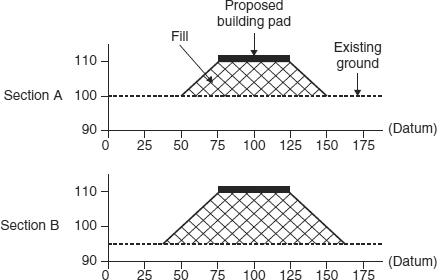
- 10.4 A site is to be graded such that a level building pad will be installed at an elevation of 110 feet. Cross-sections of the existing ground are provided in Figure 10.23. Section A and Section B are 150 feet apart. Note that the vertical scale is different from the horizontal scale; this is often done in engineering to exaggerate the variation in the vertical direction. How much fill is needed between Section A and Section B?
Figure 10.23 Cross-Sections for Homework Problem 10.4.
Elevations and distances are in feet. - 10.5 Repeat Homework Problem 10.4, except consider that the building pad is at an elevation of 105 feet. Assume that the base widths for the fill area are the same as for Homework Problem 10.4.
- 10.6 At what elevation should the building pad of Homework Problem 10.4 be placed in order to balance the cut and fill volume?
- 10.7 Determine the footing width for a one-story 800 square feet conventional wood-frame house with a 2:1 length-to-width ratio to be constructed on a site in a warm climate (i.e., no snow load) with the following soil:
- Compact coarse sand
- Loose fine sand
- Stiff clay
- Soft silt
- 10.8 A rectangular concrete septic tank is 3 feet wide × 5 feet long × 3 feet high. The outlet tee is located 0.5 feet below the top of the tank. Sludge solids accumulate in the bottom of the tank at a rate of 4 inches/year. Wastewater enters the tank with a flowrate of 200 gallons/day.
- What is the detention time of wastewater in the tank without sludge accumulation?
- What is the detention time of wastewater in the tank after two years of sludge accumulation?
- 10.9 Size a septic tank for a house with a maximum occupancy of six people. State all assumptions.
- 10.10 Design a drainfield layout for the previous problem for a soil with an application rate of:
- 1.0 gallons/square foot/day
- 0.5 gallons/square foot/day
- 0.25 gallons/square foot/day
- 10.11 Why is it important for an infrastructure engineer to communicate the importance of maintenance to a client?
- 10.12 What are the steps of the design process?
- 10.13 How does a decision matrix help the engineer and client decide the best design?
- 10.14 What is the basic engineering principle upon which foundation footing designs are based?
- 10.15 Document an example on your campus where a decision was made to spend more money than otherwise necessary in order to incorporate aesthetics in the design of an infrastructure component.
- 10.16 Suggest an aesthetic improvement to an infrastructure component of your campus. What additional design considerations and potential cost increases would be necessary for this improvement?
- 10.17 The Hoover Dam Bypass project has recently been completed. Read the Executive Summary (available at www.wiley.com/college/penn) of the Environmental Impact Statement. Of the three bypass alternatives proposed, was the least cost alternative the preferred alternative? What other criteria in addition to cost were considered?
- 10.18 Consider one of the following components located on your campus, as selected by your instructor. List the competing variables that may have been considered in the design of that item. What were the design constraints? What regulations apply to the component? What is a typical design life? How would you define “failure” of the component? What risks are involved if the component fails? Use the Internet to conduct your research unless your instructor suggests alternative sources (e.g., your university library or a textbook from a subdiscipline area).
- Environmental/water resources
- culvert
- detention pond
- Structural
- bridge
- Transportation
- intersection
- parking lot
- Geotechnical
- retaining wall
- Environmental/water resources
- 10.19 For one or more items (as selected by your instructor) in Homework Problem 10.18, list several alternative designs that engineers might have considered before implementing the final design. Make sure to consider some non-technical solutions.
- 10.20 Use Internet resources to investigate the concept of LID (low impact design) with regard to residential and commercial land development. Write a one-page paper in which you describe the pros and cons of LID and state whether you think the pros outweigh the cons, or vice versa. List all sources.
- 10.21 Choose a national civil engineering landmark (available at www.wiley.com/college/penn) and perform research to identify the design constraints associated with the project.
Key Terms
- application rate
- average end area
- bearing capacity
- combination inlet
- crest
- crowned
- cut
- dead load
- design criteria
- design life
- design process
- detention time
- drainfield
- effluent
- fill
- footing
- frontage
- holding tank
- inlet
- load capacity
- occupancy live load
- performance criteria
- problem statement
- scum
- setbacks
- snow load
- spread
References
Environmental Protection Agency (EPA). 2005. A Homeowner's Guide to Septic Systems. EPA-832-B-02-005.
Museum of Science. Engineering is Elementary. http://www.mos.org/eie/engineering_design.php, accessed August 8,2011.
United States Geological Survey (USGS). 1999. Illinois. Fact Sheet 014-99.
United States Army Corps of Engineers (USACE). 1992. Bearing Capacity of Soils, Engineering Manual. 1110-1-1905.