
The Gaussian Copula
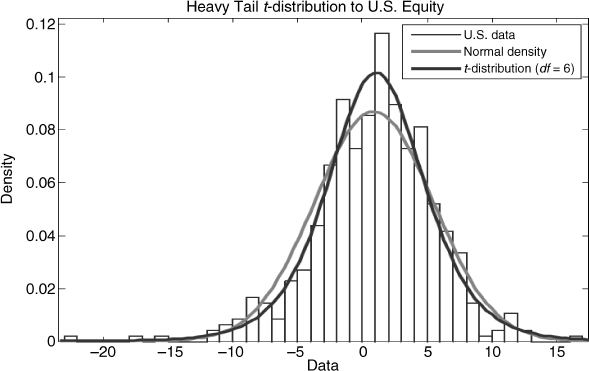
The idea of studying portfolio risk in a world in which returns may follow different distributions, perhaps depending on the asset class, is an intriguing one. After all, there is ample evidence to suggest that returns, in general, are not well modeled by the normal density (fat tails, excess kurtosis, negative or positive skew, and so forth). The following example shows the empirical distribution of U.S. equity returns over the period 1970 to 2009 fit to both the normal and t-distribution with six degrees of freedom. The t-distribution maximizes the likelihood of the observed data. Notice that while the normal density would tend to overestimate mid-range losses, it also tends to underestimate tail losses and that there is also an asymmetry embodied in the lower tail of the distribution of returns. Chapter 13 models the distribution of the tail directly, using extreme value theory.
Therefore, while we may reject normality in favor of an alternative distributional assumption, these alternatives are generally the result of empirical models fit to specific return streams using maximum likelihood methods, which would suggest that return distributions will vary across asset classes. High yield credit, for example, is likely to have fatter tails than investment grade bonds, and bond returns, in general, will behave differently from equity returns. Moreover, it is also likely that asset return distributions are sensitive to the business cycle as well as shock, for example, financial crises. The point is that the assumption of normality may be overly restrictive and the cost of that restriction could be quite high from the perspective of risk management.
The problem we face is that while we can generate a multivariate distribution of returns conditional on a vector of means, a correlation matrix, and the individual asset volatilities as in the preceding example, we have no method at this point of being able to combine different marginal distributions into a coherent joint distribution. In the credit default example discussed earlier, the three bonds were assumed to all have a multivariate normal distribution. In the immediately preceding discussion, however, we are entertaining the notion of possibly three different distributions. In general, we may have k assets with wide-ranging marginal distributions (log normal, beta, gamma, t, and so forth). It is mathematically intractable to solve for the joint distribution in these cases. This is where copulas come in.
A copula is a function that joins together marginal distributions into a multivariate distribution. In a theorem proposed by Sklar (Rachev 2003), it was proved that for any set of marginal distributions, there exists a copula that joins these into a multivariate distribution. Sklar's theorem was published in 1959. Since then, a large literature on copulas has formed and interest in copulas has increased dramatically since the onset of the credit crisis in 2008. Copula functions have now become standard fare in several software packages, including Matlab. I will state this result for the bivariate case but leave the mathematical details to a set of recommended references. (A comprehensive survey can be found in Rachev 2003.) Sklar's theorem states that given two distinct marginal distributions on the random variables x and y, given by F(x) and G(y), and a joint distribution on x and y given by H(x,y), then there exists a copula C such that H(x,y) = C(F(x), G(y)). I will develop the Gaussian copula and apply it in the discussion that follows.
To fix ideas, let's refer to the monthly returns data on U.S. equity and non-U.S.-developed equity spanning 1970 to 2009 and presented in the chapter spreadsheet under the copula tab. Our objective is to model tail risk, VaR, and ETL by constructing a viable model of the underlying dynamics between these two returns series. We can then use this model to simulate bivariate returns for these two asset classes in subsequent work. Figure 12.4 is a scatterplot of the returns, which have a Pearson correlation of 63 percent over this period. Here are some summary statistics on these returns:
| U.S. | Non-U.S. | |
| 0.89 | 0.98 | μ |
| 4.58 | 5.06 | σ |
| –9.76 | –10.80 | VaR (1%) |
Figure 12.4 U.S. versus Non-U.S. Equity Returns
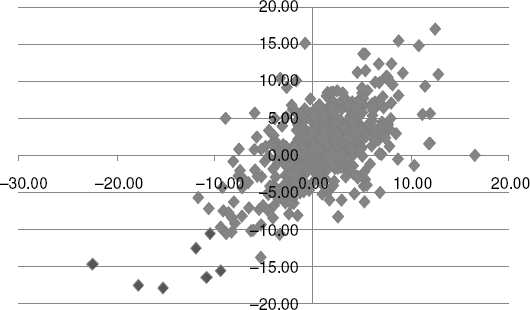
The monthly returns are 89 bps and 98 bps, respectively, with monthly volatilities 4.58 percent and 5.06 percent. The 1 percent VaR is computed using μ – 2.326σ, where Prob(z < –2.31) = 0.01. The seven dots located in the far lower left denote the joint occurrence of returns exceeding the VaR cutoffs. These seven events occur in a sample size of 480.
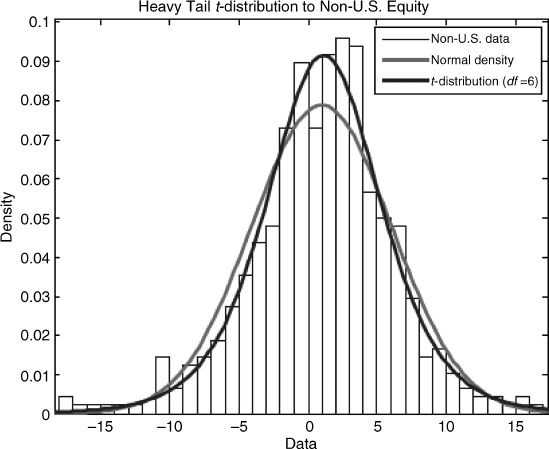
Let us now fit these returns empirically to a t-distribution using the method of maximum likelihood (I used Matlab's dfittool function to do this). The marginal distribution for U.S. equity was already shown earlier with six degrees of freedom. The maximum likelihood distribution for non-U.S. equity was likewise t-distributed with six degrees of freedom and is presented directly here.
Let's spend a little time analyzing these two distributions. On the copula spreadsheet, we summarize the tail experience for both the t-distribution (with six degrees of freedom) and the normal distribution. The one percentile cutoffs are –3.143 (t) and –2.326 (normal). Columns M to P contain a few cases for which observed returns fell below the first percentile. These results are summarized here:
| U.S. | Non-U.S. | |
| 3 | 4 | t-dist(df=6) |
| 0.60% | 0.80% | |
| 8 | 7 | normal |
| 1.70% | 1.50% |
Under the normal distribution, for example, the incidence of extreme U.S. equity returns is about 1.7 times expected (8/480 = 1.7 percent) and 1.5 times expected for non-U.S. equity. This is evidence supporting the propensity of the normal assumption, when improperly applied, to lead to underestimates of risk. Under the t-distribution, on the other hand, the incidence of extreme returns is less than expected but still closer to the 1 percent expected incidence. In any case, we note that these observations are based on a single sample.
The objective is to use a copula to generate a joint distribution using these two marginal t-distributions, each with six degrees of freedom. We can follow the six-step procedure given previously but with a few modifications:
Spearman correlations are used because the copula does not preserve the Pearson product-moment correlations in the transformation of the marginal distributions. We therefore use the rank order correlations in place of the Pearson correlations, since rank order is preserved under the transformation. Note that we could use Kendall's τ instead of Spearman.
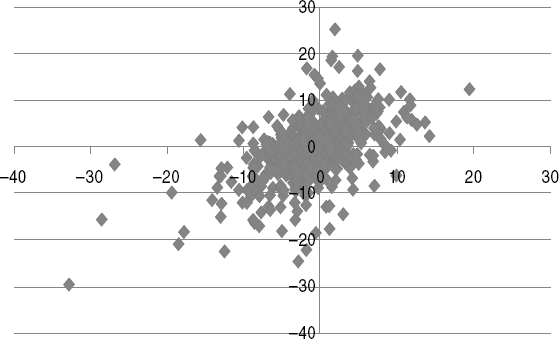
We can review the copula construction process by reviewing the spreadsheet. Columns R and S on the spreadsheet generate two vectors of 480 random draws from the standard normal density. Columns U and V premultiply these draws by the Cholesky decomposition of the covariance matrix. These are values under the normal distribution, which are then evaluated as probabilities using the normal (NORMDIST)—this is the matrix u in step 4. The copula then transforms these uniform values using the TINV(u,6) function, producing a multivariate set of random returns consistent with the covariance given by V and, specifically, the Spearman correlations. The scatterplot provided in Figure 12.5 seems to match the original returns quite well. Pressing F9 will refresh the spreadsheet.
Figure 12.5 Gaussian Copula for U.S. versus Non-U.S. Simulated Returns
Suppose now that we invest in an equal-weighted portfolio of U.S. and non-U.S. equity. The returns to this portfolio are given in column AC on the spreadsheet and the ranks are provided in column AD. There are 480 realizations from the experiment. Pressing F9 generates another sample. Columns AF and AG provides the results from one such simulation. These portfolio returns are ranked in ascending order. Rows 1 to 25, for example, correspond to the tail comprising the 5 percent lowest returns (given in green). The average of these returns is –12.52 percent. This is the expected tail loss (ETL), where the tail is defined by the 5 percent VaR, which under t(df = 6) is equal to –10.0221. The VaR says that this portfolio is expected to lose at least –10.0221 percent 5 percent of the time. The ETL, which is a coherent risk measure, is equal to –12.52 percent and gives the expected loss based upon the returns that exist in the tail, the largest loss on this particular simulation being –21.36 percent. In principle, we could generate a sampling distribution of ETL and study the statistical properties of this distribution under the structure imposed by our copula. Thus, the copula permits the introduction of virtually any marginal distribution. A large negative shock, for example, may lead us to adopt even fatter tail t-distributions (lowering the degrees of freedom parameter) or perhaps substituting more skewed distributions from the beta family. The resultant structures produce scatterplots like those in Figures 12.4 and 12.5 12.5, which are reminiscent of observed returns but with specific marginal distributions. It is also straightforward to expand the dimension to include many assets.