1
Mid‐IR Spectral Range
1.1 Definition of the Mid‐IR
Infrared radiation was unknown before the year 1800 when Friedrich Wilhelm Herschel – a German‐born musician, who moved to England to work as a music band conductor, but later became obsessed with astronomy and eventually landed the position of the King's Astronomer − discovered infrared radiation. He made this finding while exploring sunlight, dispersed into its colors by a glass prism, with the aid of a liquid thermometer with a blackened bulb to absorb radiation (a prototype of a modern microbolometer). His experimentation led to the conclusion that there must be an invisible form of light beyond the visible spectrum [1].
Further experiments showed that this invisible radiation is electromagnetic radiation with a lower frequency than the red in the visible spectrum. Modern science further divides the infrared spectral region into near‐infrared, mid‐infrared, and far‐infrared.
According to the Encyclopedia Britannica, the “middle infrared” (mid‐infrared or mid‐IR) region of the electromagnetic spectrum covers, in wavelength, the portion between 2.5 and 50 μm (6–120 THz in frequency or 200–4000 cm−1 in wavenumbers).1 (The wavenumber is the inverse of the vacuum wavelength, λ, expressed in cm−1; it is also equal to the optical frequency divided by the speed of light, ν/c.)
However, the definitions of the “mid‐IR” vary substantially in the technical literature, depending on a field‐specific community. For example, the detector‐based community subdivides the IR into four spectral bands, based on transmission windows of the atmosphere,2 as can be seen in Figure 1.1: shortwave infrared (SWIR), 1–3 μm; mid‐wave infrared (MWIR), 3–5 μm; longwave infrared (LWIR), 8–14 μm; and very‐long wave infrared (VLWIR), 14–30 μm.

Figure 1.1 Transmission spectrum of a 100‐m path in the “standard” atmosphere (spectral resolution 4 cm−1). The plot uses data from the HITRAN database (US model, mean latitude, summer, and zero elevation) [2]. The labels indicate the molecules that are responsible for transmission dips in the corresponding spectral regions.
Also, it is not uncommon in the current literature to refer to mid‐IR as “multi‐terahertz range,” especially when the authors generate few‐cycle mid‐IR transients combined with electro‐optic methods of their detection, which is typical for terahertz science.
This book loosely defines the mid‐IR range as 2–20 μm. This definition allows, on the short‐wavelength side, to encompass a few categories of solid‐state and fiber lasers, as well as certain types of microresonator‐, nonlinear fiber‐, and waveguide‐based sources. On the long‐wavelength side, 20 μm is a suitable practical limit set by the atmospheric transparency.
Heat energy is often transferred in the form of infrared radiation, which is given off from an object as a result of atomic and molecular motion. The mid‐IR region overlaps with the spectral range of heat (blackbody) radiation at temperatures close to room temperature. Based on the Planck's law, the peak of the infrared radiation (in terms of power per unit wavelength) emitted by a human body at 310 K is at λ ≈ 9.35 μm. Overall, our body emits 52 mW of mid‐IR radiation per square centimeter; that radiation can be easily detected by a thermal microbolometer‐based camera, as shown in Figure 1.2.
However, this book is about coherent laser sources, and the difference between the diffuse light of a heated body and a monochromatic laser‐like beam is that the latter has a well‐defined frequency and phase.
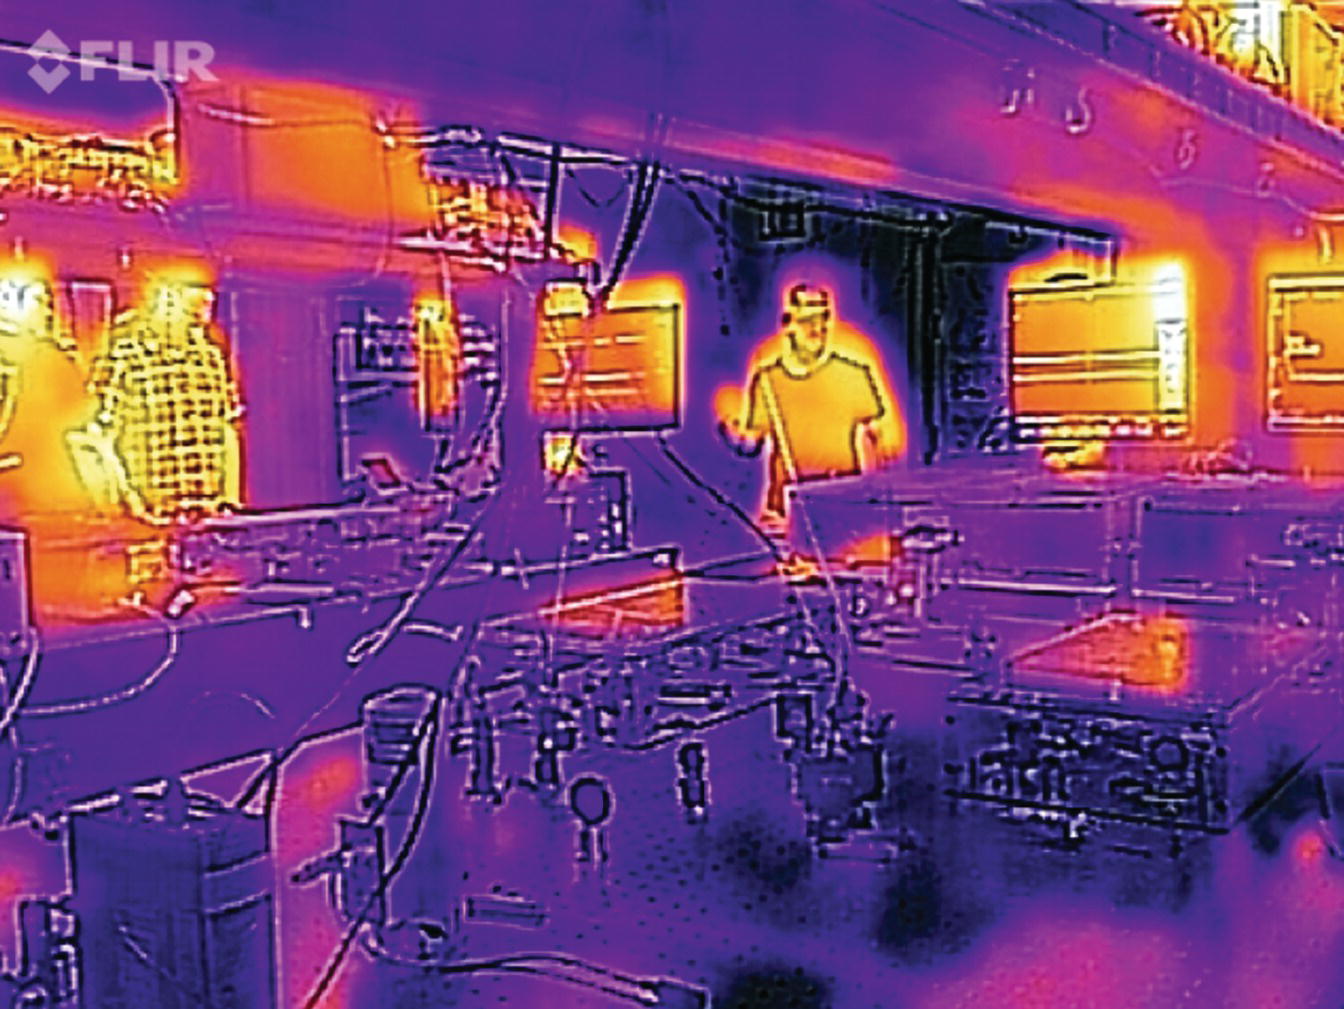
Figure 1.2 This is what the author's laboratory looks like in the mid‐IR at 8–12 μm.
1.2 The World's Second Laser
Interestingly, the world's second laser – after the Maiman's ruby laser – was a mid‐IR solid‐state laser based on trivalent uranium‐doped calcium fluoride (U3+:CaF2) [3]. It was operating at a wavelength λ = 2.49 μm and was developed by Peter Sorokin and Mirek Stevenson at the IBM research labs, in the same year as the Maiman's ruby laser, 1960.
The laser was pumped by a pulsed flashlamp and was cooled by liquid helium. The energy‐level diagram of U3+:CaF2 is shown in Figure 1.3. Broadband pumping in the visible part of the spectrum causes transitions to excited U3+ bands. These pumping transitions are followed by rapid, nonradiative transitions to the two metastable upper laser levels. The thick arrow shows the 2.49‐μm laser transition observed by the authors. The laser oscillation takes place in a transition from a metastable state to a level that is approximately 515 cm−1 above the ground state. At liquid helium temperatures, this state is depopulated by at least a factor of 1010 relative to the ground state. Hence, this was the first demonstration of a four‐level solid‐state laser.

Figure 1.3 Energy‐level diagram of trivalent uranium in calcium fluoride [3]. Broadband pumping light applied in the blue and green visible spectrum causes transitions to excited bands. These pumping transitions are followed by rapid, nonradiative transitions to the two metastable upper laser levels. The thick arrow shows the 2.49 μm laser transition observed by the authors.
Source: reproduced from figure 1 of [3], with permission of APS.
Furthermore, the 1960 work by Sorokin and Stevenson coined a few significant keywords used in this book: trivalent metal cation, and the 4‐level system.
1.3 Internal Vibrations of Molecules
Molecules typically have a characteristic absorption spectrum in the mid‐IR, which is often used for identifying their structure. This results from the fact that mid‐IR frequencies coincide with the strongest main‐tone vibrational (strictly speaking, rotational–vibrational) frequencies of most of the molecules. In the gas phase, molecules possess dozens of distinct, sharp, and strong absorption features (with the exception of symmetric diatomic molecules like nitrogen, N2, whose vibrations are not infrared active). This makes the mid‐IR range especially important for chemical sensing, molecular spectroscopy, and molecular fingerprinting. Figure 1.4 shows a rotational–vibrational band of the CO molecule, located between 4.5 and 5 μm in wavelength. The band is represented by a regular sequence of sharp and extremely strong absorption peaks. For example, a 1‐mm path of pure CO gas at 1 atm pressure would absorb >99.5% of the incoming mid‐IR light, given that the light is tuned to one of the resonances. In theory, these resonances can even serve as a reference for high‐precision molecular clocks for time and frequency metrology.
Figure 1.4 Rotational–vibrational absorption band of the CO molecule at 4.5–5 μm. The plot uses data from the HITRAN database [2].
Characteristic vibrational transitions in the mid‐IR are also present in the solid and liquid phases of matter, and also in 2D materials with exotic properties, such as graphene [4].
References
- 1 Herschel, W. (1800). Experiments on the refrangibility of the invisible rays of the sun. Philos. Trans. R. Soc. Lond. 90: 284.
- 2 Gordon, I.E., Rothman, L.S., Hill, C., Kochanov, R.V., Tan, Y., Bernath, P.F., Birk, M., Boudon, V., Campargue, A., Chance, K.V., Drouin, B.J., Flaud, J.‐M., Gamache, R.R., Hodges, J.T., Jacquemart, D., Perevalov, V.I., Perrin, A., Shine, K.P., Smith, M.‐A.H., Tennyson, J., Toon, G.C., Tran, H., Tyuterev, V.G., Barbe, A., Császár, A.G., Devi, V.M., Furtenbacher, T., Harrison, J.J., Hartmann, J.‐M., Jolly, A., Johnson, T.J., Karman, T., Kleiner, I., Kyuberis, A.A., Loos, J., Lyulin, O.M., Massie, S.T., Mikhailenko, S.N., Moazzen‐Ahmadi, N., Mu¨ller, H.S.P., Naumenko, O.V., Nikitin, A.V., Polyansky, O.L., Rey, M., Rotger, M., Sharpe, S.W., Sung, K., Starikova, E., Tashkun, S.A., VanderAuwera, J., Wagner, G., Wilzewski, J., Wcisło, P., Yu, S., and Zak, E.J. (2017). The HITRAN 2016 molecular spectroscopic database. J. Quant. Spectrosc. Radiat. Transf. 203: 3.
- 3 Sorokin, P.P. and Stevenson, M.J. (1960). Stimulated infrared emission from trivalent uranium. Phys. Rev. Lett. 5: 557.
- 4 Mak, K.F., Ju, L., Wang, F., and Heinz, T.F. (2012). Optical spectroscopy of graphene: from the far infrared to the ultraviolet. Solid State Commun. 152: 1341.