
19.2 Example Analysis
In this example, a corporation is planning on locating a new factory in one of several locations within a city. A general map of Medium City is shown in Figure 19.1. Approximately 50,000 people live in this city. The city has the following:
- three fire stations;
- one hospital;
- a community college;
- two grade schools;
- one high schools;
- one junior high schools;
- three minor factories;
- a train yard;
- a shopping mall.
Figure 19.1 General layout of the Medium City.
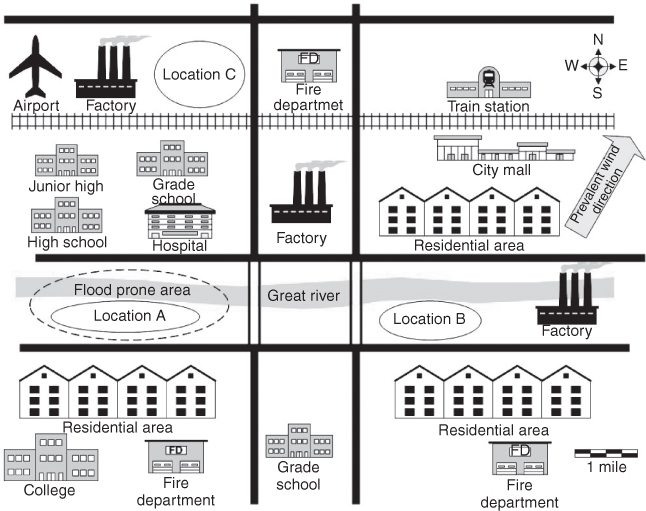
These are located on the map. The bulk of the city sits more than 12 ft above the river, but the western side of the city is only 6 ft above the river. The river flows west to east. In addition to the flood hazard, the city can experience tornados, high winds, thunderstorms, and hail storms and has a moderate Earthquake risk. The prevalent wind direction is from southwest to northeast.
The factory will manufacture food flavorings. It will employ 2000 workers. It will use four chemicals to manufacture the flavorings. These chemicals are listed in Table 19.1.
Table 19.1 List of Chemicals
| Hazardous | Quantity to be | |
| Chemical | nature | stored on site |
| Chemical A | Highly flammable, high vapor pressure (gas at room temperature), highly toxic | 10,000 gal |
| Chemical B | Combustible, solid at room temperature, highly toxic | 20,000 lb |
| Chemical C | Combustible, liquid at room temperature, low toxicity | 5,000 gal |
| Chemical D | Nonflammable, solid at room temperature, nontoxic | 10,000 lb |
There are several potential risks associated with the placement of the factory. The risks are both to the city from the factory and to the factory from the location in the city.
The risks to the factory from the placement of the factory in the city include but are not limited to the following:
- flooding hazard;
- weather hazards;
- response time from the fire department if the travel distance is too great.
The risks to the city from the factory include but are not limited to the following:
- fire and explosion hazards;
- toxic releases;
- traffic increases.
Also listed on the map are the three possible sites for the new plant. For each location, risk assessment tools can be used to help elicit the risks for each potential site. The site with the least risks both to the city from the factory and to the factory from the site can be selected once the risks are determined. Preliminary hazard analysis (PHA) is a tool that can be used in this process.
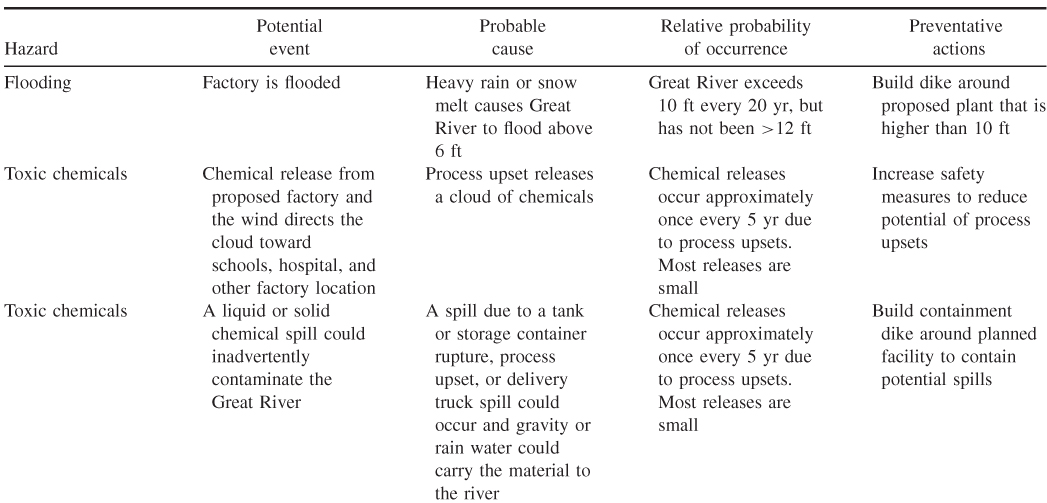
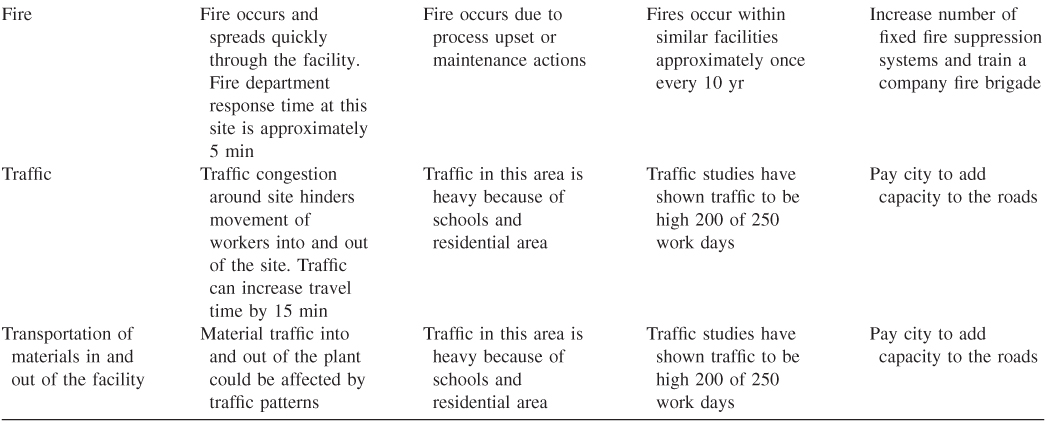
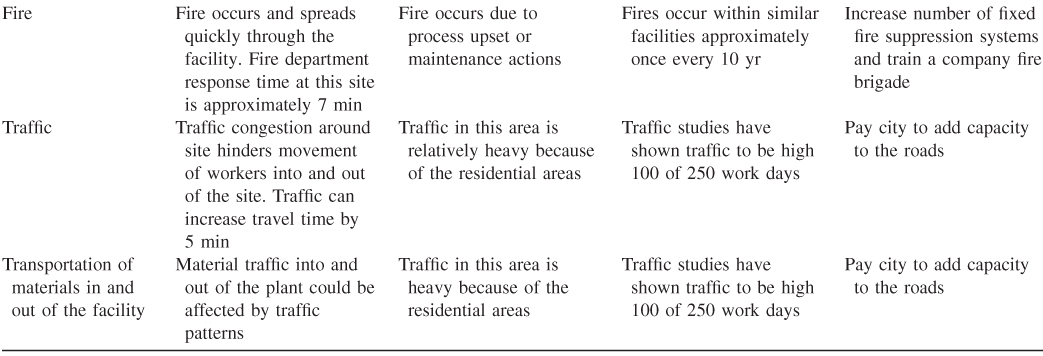
19.2.1 Preliminary Hazard Analysis for Site A
Table 19.2 lists the hazards for site A.
Table 19.2 Preliminary Hazard Analysis for Site A
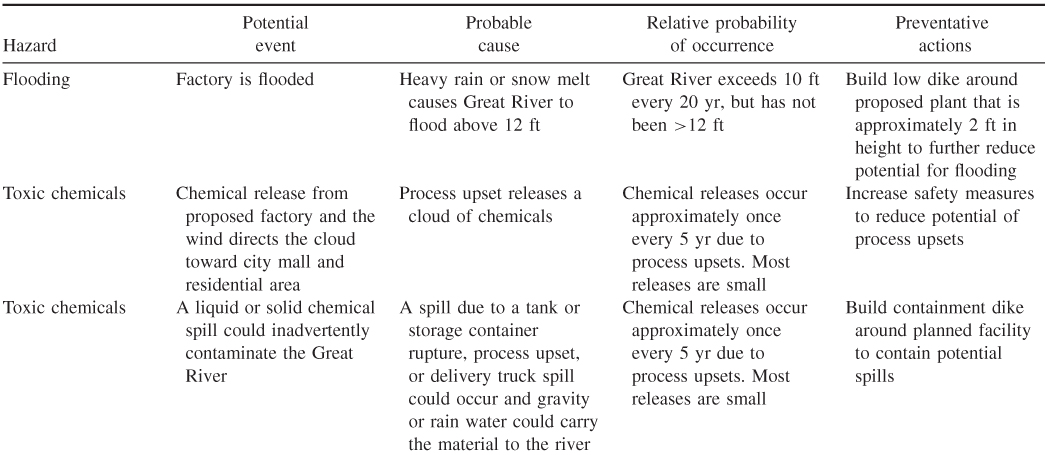
19.2.2 Preliminary Hazard Analysis for Site B
Table 19.3 lists the hazards for site B.
Table 19.3 Preliminary Hazard Analysis for Site B
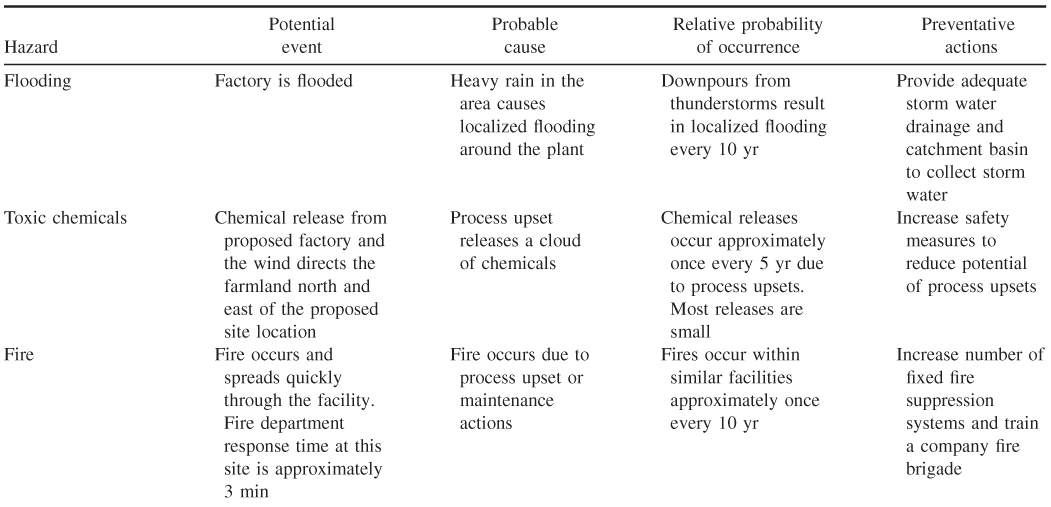
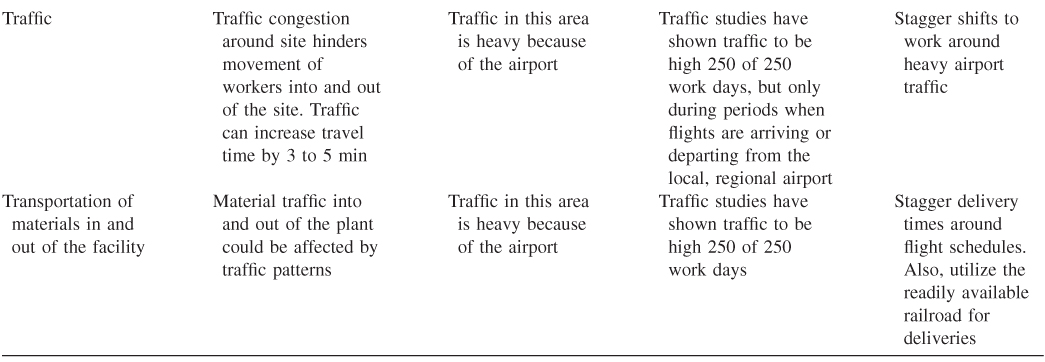
19.2.3 Preliminary Hazard Analysis for Site C
Table 19.4 lists the hazards for site C.
Table 19.4 Preliminary Hazard Analysis for Site C
From these analyses, site C is selected. It poses the least amount of risk to the factory from the city and from the factory to the city.
Other risk assessment tools can also be used. For instance, failure mode and affect analysis (FMEA), event trees, and fault trees, along with other methods can be used to perform these analyses. Also, a probabilistic analysis can be added, if probabilities can be assigned to the various events.
Figure 19.2 shows how a fault tree for a potential chemical release event from this proposed factory for location A might look. Figure 19.3 shows the fault tree for a similar event for location C. Using the probabilities in Table 19.5 for the various basic events, one can calculate the risk for a chemical release event that would affect the schools and the hospital shown on the map in Figure 19.1.
Figure 19.2 Fault tree for chemical release event for location A.
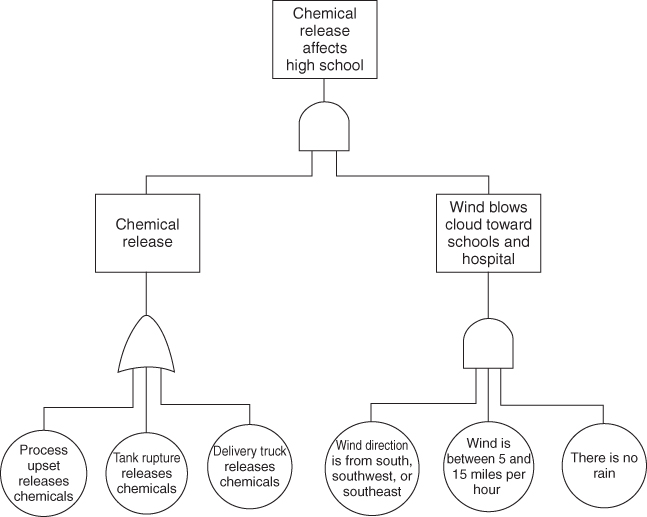
Figure 19.3 Fault tree for chemical release event for location C.
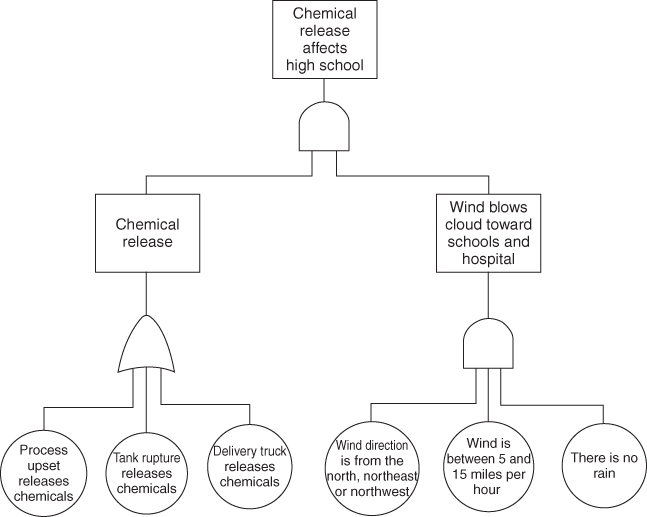
Table 19.5 Probabilities for Basic Events
| Basic events | Probability |
| Process upset | 1 in 5 yr or 1 every 1825 d |
| Storage tank rupture | 1 in 10 yr or 1 in every 3650 d |
| Delivery truck leaking | 1 in 2 yr or 1 in 730 d |
| Wind blowing from south, southwest, or southeast | 10 mo/yr or 1 in 0.83 yr (not blowing from this direction = 0.017) |
| Wind blowing between 5 and 15 mi/h | 1 mo/yr or 1 in 0.08 |
| No rain | 9 mo/yr or 0.75 |
Next, the probability of the conditions existing that might cause a chemical release affecting a school or the hospital are calculated for both locations A and B. These calculations are shown in Table 19.6.
Table 19.6 Chemical Release Spill Calculations
| Location | Probability |
| Location A | (0.20 + 0.10 + 0.50) × (0.83 × 0.083 × 0.75) = 0.041 or 1 in 24 yr |
| Location C | (0.20 + 0.10 + 0.50) × (0.16 × 0.083 × 0.75) = 0.0079 or 1 in 126 yr |
These calculations show that there is more than five times less likelihood the wind would blow a chemical release from location C as from location A.
In this example, both the qualitative and quantitative risk assessments show that location C is the better location from a risk perspective.