Appendix A
Appendix

Figure A.1 Probability density function for two sinusoids.

Figure A.2 Probability density function for three sinusoids.

Figure A.3 Probability density function for four sinusoids.

Figure A.4 Probability density function for ten sinusoids.

Figure A.5 Probability density function for 30 sinusoids.

Figure A.6 CTDE in relation to additional  and
and  values.

Figure A.7 Relative throughput for  code based Autonomic Cooperative Behaviour in AWGN Channel.

Figure A.8 Relative throughput for  code based Autonomic Cooperative Behaviour in Rayleigh channel.
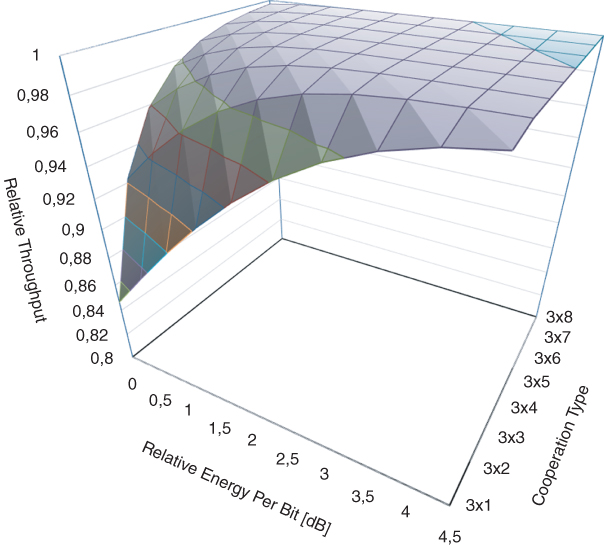
Figure A.9 Relative throughput for  code based ACB in AWGN channel.

Figure A.10 Relative throughput for  code based Autonomic Cooperative Behaviour in Rayleigh channel.

Figure A.11 Relative throughput for  code based Autonomic Cooperative Behaviour in AWGN channel.

Figure A.12 Relative throughput for  code based Autonomic Cooperative Behaviour in Rayleigh channel.

Figure A.13 Relative throughput for  code based Autonomic Cooperative Behaviour in AWGN channel.

Figure A.14 Relative throughput for  code based Autonomic Cooperative Behaviour in Rayleigh channel.

Figure A.15 Relative throughput for  code based Autonomic Cooperative Behaviour in AWGN channel.
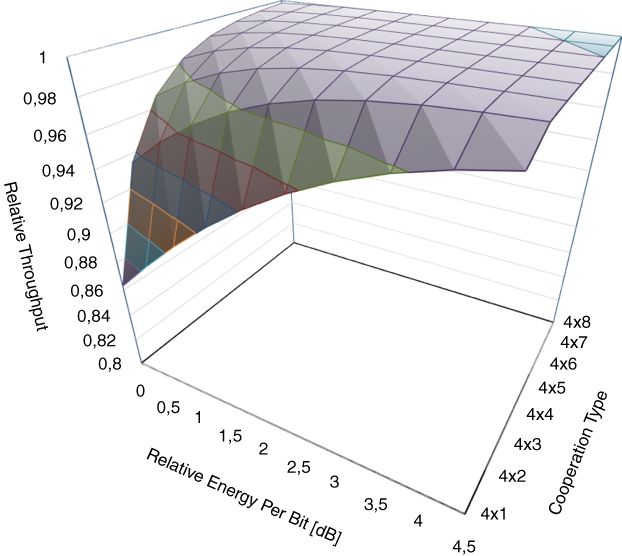
Figure A.16 Relative throughput for  code based Autonomic Cooperative Behaviour in Rayleigh channel.

Figure A.17  equivalent distributed space-time block encoder in AWGN channel.

Figure A.18  equivalent distributed space-time block encoder in AWGN channel.

Figure A.19  equivalent distributed space-time block encoder in AWGN channel.

Figure A.20  equivalent distributed space-time block encoder in AWGN channel.

Figure A.21  equivalent distributed space-time block encoder in AWGN channel.

Figure A.22 Autonomic switching at bit error rate threshold of 0.0010.

Figure A.23 Autonomic switching at bit error rate threshold of 0.0100.

Figure A.24 Autonomic switching at bit error rate threshold of 0.0250.

Figure A.25 Autonomic switching at bit error rate threshold of 0.0750.

Figure A.26 Relative throughput for layout A1.

Figure A.27 Relative throughput for layout A2.

Figure A.28 Relative throughput for layout A3.

Figure A.29 Relative throughput for layout A4.

Figure A.30 Relative throughput for layout B1.

Figure A.31 Relative throughput for layout B2.

Figure A.32 Relative throughput for layout B3.

Figure A.33 Relative throughput for layout B4.

Figure A.34 Relative throughput for layout C1.

Figure A.35 Relative throughput for layout C2.
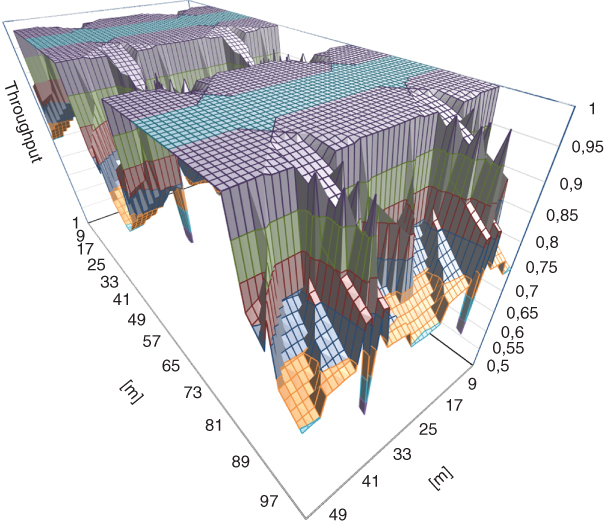
Figure A.36 Relative throughput for layout C3.

Figure A.37 Relative throughput for layout C4.

Figure A.38 Layout A1 in relation to layout B1.

Figure A.39 Layout A2 in relation to layout B2.

Figure A.40 Layout A3 in relation to layout B3.

Figure A.41 Layout A4 in relation to layout B4.

Figure A.42 Layout B1 in relation to layout C1.

Figure A.43 Layout B2 in relation to layout C2.

Figure A.44 Layout B3 in relation to layout C3.

Figure A.45 Layout B4 in relation to layout C4.

Figure A.46 Layout C1 in relation to layout A1.

Figure A.47 Layout C2 in relation to layout A2.

Figure A.48 Layout C3 in relation to layout A3.

Figure A.49 Layout C4 in relation to layout A4.

Figure A.50 Layout A1 combined with relative throughput.

Figure A.51 Layout A2 combined with relative throughput.

Figure A.52 Layout A3 combined with relative throughput.
Figure A.53 Layout A4 combined with relative throughput.