
Chapter 13
Introduction to Software Architecture
What's In This Chapter?
- Why designing visually is important
- Microsoft's approach to a modeling strategy
- Modeling tools in Visual Studio 2012
In this introductory chapter, you learn about some main themes around software architecture and design—domain-specific languages (DSLs), model-driven development (MDD), and the Unified Modeling Language (UML)—and how they apply to Visual Studio Ultimate 2012.
This chapter then gives a brief overview of the architecture tools in Visual Studio 2012, including the support for the most common UML diagrams. Many of these tools are expounded on in later chapters of this part of the book.
Finally, this chapter wraps up with a brief glimpse at some of the changes and new features added to the architecture tools in Visual Studio 2012. New dependency graph features and better graph performance have been included to enhance your experience with the architecture tools.
Let's begin by first establishing the case for undertaking visual modeling—or visual design—in the first place.
Designing Visually
Two elementary questions immediately come to mind. Why design at all, rather than just code? Why design visually?
To answer the first question, consider the common analogy of building complex physical structures, such as bridges. Crossing a small stream requires only a plank of wood—no architect, no workers, and no plans. Building a bridge across a wide river requires a lot more—a set of plans drawn up by an architect so that you can order the right materials, planning the work, communicating the details of the complex structure to the builders, and getting a safety certificate from the local authority. It's the same with software. You can write a small program by diving straight into code, but building a complex software system requires some forethought. You must plan it, communicate it, and document it to gain approval.
Therefore, the four aims of visual design are as follows:
- To help you visualize a system you want
- To enable you to specify the structure or behavior of a system
- To provide you with a template that guides you in constructing a system
- To document the decisions you have made
Traditionally, design processes such as the Rational Unified Process have treated design and programming as separate disciplines, at least in terms of tools support. You use a visual modeling tool for design, and a separate integrated development environment (IDE) for coding. This makes sense if you treat software development like bridge building, and assume that the cost of fixing problems during implementation is much higher than the cost of fixing those problems during design.
For bridges, that is undoubtedly true. But in the realm of software development, is it really more costly to change a line of code than it is to change a design diagram? Moreover, just as bridge designers may want to prototype aspects of their design using real materials, so may software designers want to prototype certain aspects of their design in real code.
For these reasons, for several years now the trend has been toward tools that enable visual design and coding within the same environment, with easy switching between the two representations, thus treating design and coding as essentially two views of the same activity. The precedent was set originally in the Java space by tools such as Together-J and, more recently, in the .NET space by IBM-Rational XDE. Microsoft embraced this approach fully with Visual Studio 2010 Ultimate, and has continued to enhance the experience with Visual Studio Ultimate 2012.
Now, let's tackle the second question. If the pictorial design view and the code view are alternative, but equivalent, representations, then why design visually at all? The answer to that question is simple: A picture is worth a thousand words. To test that theory, just look at the figures in this chapter and imagine what the same information would look like in code. Then imagine trying to explain the information to someone else using nothing but a code listing.
Many people think modeling tools are only for use on large-scale projects that make use of the waterfall software development lifecycle. That is not the case at all. Agile development is very popular now, and several different agile methods, including Kanban and Scrum, are used for all sorts of development projects, small to large. The modeling tools in Visual Studio 2012, including the UML diagrams, dependency diagrams, and Architecture Explorer, can be used just as effectively by a team following an agile methodology. Remember, just because you are “agile” doesn't mean you don't need to understand your code base and what you are trying to build. “Agile” doesn't mean “Undocumented.” It just means that you only document enough so that everyone understands what they have to do. And the modeling tools and diagrams in Visual Studio 2012 help you do that.
Microsoft's Modeling Strategy
Microsoft's Visual Studio 2012 modeling strategy is based on a three ideas:
- Model-driven development (MDD)
- Domain-specific languages (DSLs)
- The “Code Understanding” experience
Together these topics comprise Microsoft's vision for how to add value to the software development process through visual modeling.
Understanding Model-Driven Development
As a software designer, you may be familiar with the “code-generation” features provided by UML tools such as Rational Rose and IBM-Rational XDE. These tools typically do not generate “code” at all, but merely create “skeleton code” for the classes you devise. So, all you get is one or more source files containing classes populated with the attributes and operation signatures that you specified in the model.
The methods that are generated for each class by UML code-generation tools typically have complete signatures but empty bodies. This seems reasonable enough because, after all, the tool is not psychic. How would it know how you intend to implement those methods? Well, actually, it could know.
UML practitioners spend hours constructing dynamic models such as state charts and sequence diagrams that show how objects react (to method invocations) and interact (invoke methods on other objects). Yet, that information, which could be incorporated into the empty method bodies, is lost completely during code generation.
Why do UML tools generally not take account of the full set of models during code generation? In part, it's because software designers do not provide information on the other models with sufficient precision to be as useful as auto-generated method bodies. The main reason for that is because the notation (UML) and tools simply do not allow for the required level of precision.
What does this have to do with MDD? Well, MDD is all about getting maximum value out of the modeling effort by taking as much information as possible from the various models right through to implementation.
Although the example of UML dynamic modeling information finding its way into implemented method bodies was useful in setting the scene, don't assume that MDD is only (or necessarily) about dynamic modeling. If you've ever constructed a UML deployment model and then tried to do something useful with it—such as generate a deployment script or evaluate your deployment against the proposed logical infrastructure—you will have seen how wasted that effort has been, other than to generate some documentation.
So, what's the bottom line? Because models are regarded as first-class development artifacts, developers write less conventional code, and development is, therefore, more productive and agile. In addition, it shows all the participants—developers, designers, analysts, architects, and operations staff—that modeling actually adds value to their efforts.
Understanding Domain-Specific Languages
UML fails to provide the kind of high-fidelity domain-specific modeling capabilities required by automated development. In other words, if you want to automate the mundane aspects of software development then a one-size-fits-all generic visual modeling notation will not suffice. What you need is one or more Domain-Specific Languages (DSLs) (or notations) highly tuned for the task at hand—whether that task is the definition of web services, the modeling of a hosting environment, or traditional object design.
The DSL idea is not new, and you may already be using a DSL for database manipulation (it's called SQL) or XML schema definition (it's called XSD).
Visual Studio Ultimate 2012 embraces this idea by providing the capability to create DSLs for specific tasks. DSLs enable visual models to be used not only for creating design documentation, but also for capturing information in a precise form that can be processed easily, raising the prospect of compiling models into code.
In that context, “your own problem domain” need not be technology-focused (such as how to model web services or deployment infrastructures) but may instead be business-focused. You could devise a DSL that is highly tuned for describing banking systems or industrial processes.
The “Code Understanding” Experience
Modeling is not just about building diagrams that help you understand requirements, architecture, and high-level design. It can also be about helping you gather a better understanding of the details of your code base. In Visual Studio Ultimate 2012, a majority of the work done on the architecture tools has been to enhance what is called the “Code Understanding” experience.
Think of the Code Understanding experience as the ability to understand both the new code you need to write, as well as the existing code you need to support. As a developer, you may need a better understanding of your code, how it fits into the wider system, and the frameworks that it is using, so that your team can more easily create tests, debug code, and add new features. The UML diagrams within Visual Studio 2012 can provide that information. Layer diagrams can show you the different layers of your application and help you to enforce code rules.
You may run into the situation where you need to understand why a certain module has a dependency on another module. Dependency graphs are a great way to see how the different assemblies and modules in your solution interact and depend on each other. Understanding these dependencies can make it easier to refactor code to remove dependencies on deprecated features.
So, when thinking about modeling and visualization, don't just assume those tools are for making pretty pictures of your requirements. You can also use these tools to drill down into your code base to help you solve problems.
The Architecture Tools in Visual Studio Ultimate 2012
In Visual Studio 2010 Ultimate, the architecture tools underwent a huge transformation from Visual Studio 2008. Although there are some new tools in Visual Studio Ultimate 2012, by and large the modeling diagrams and tools that you used in Visual Studio 2010 work the same in 2012. All of these diagrams and tools can be used to help you more fully understand the software system being built. These tools enable you to create models at different levels of detail, depending on your need.
This section provides a very brief overview of each of the modeling diagrams. The chapters that follow in the book provide an in-depth look into each diagram type.
As mentioned previously, Visual Studio 2012 fully supports UML, specifically UML 2.1.2. Only five UML diagrams are supported out-of-the-box:
- Use case diagrams
- Activity diagrams
- Sequence diagrams
- Component diagrams
- Class diagrams
There are other tools and diagrams, not related to UML, included with Visual Studio Ultimate 2012. The Architecture Explorer can be used to understand the architecture of existing code, or of managed assemblies. Dependency graphs are used to provide a graphical view of the information from Architecture Explorer, as well as directly from your solution. Layer diagrams can be used to describe the logical architecture of your system and can even be used during the build process to enforce architecture considerations on the code base.
Use Case Diagrams
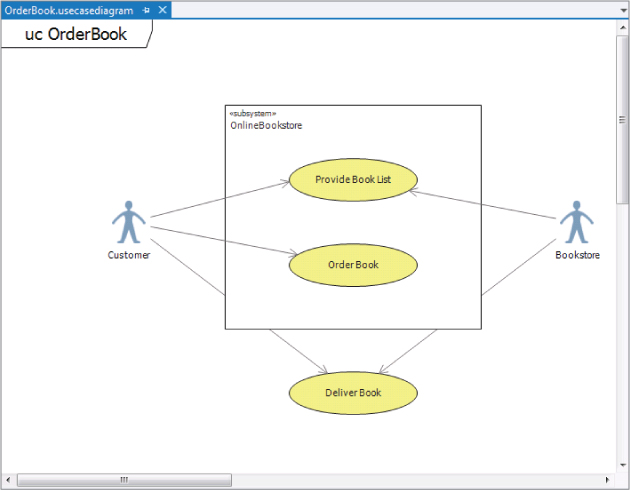
A use case diagram is a summary of who uses your application and what they can do with it. It describes the relationships among requirements, users, and the major components of the system.
Use case diagrams show the relationships between users (actors) and use cases within a system or application. They provide an overall view of how a system is used and the various roles and actions that take place within the system. Figure 13.1 shows an example of a use case diagram.
Activity Diagrams
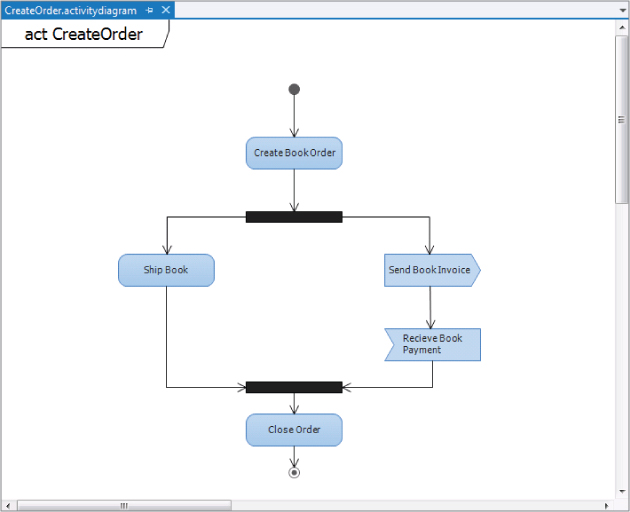
Use case diagrams can be broken down into activity diagrams. An activity diagram shows the software process as the flow of work through a series of actions. It can be a useful exercise to draw an activity diagram showing the major tasks that a user will perform with the software application. Figure 13.2 shows an example of an activity diagram.
Sequence Diagrams
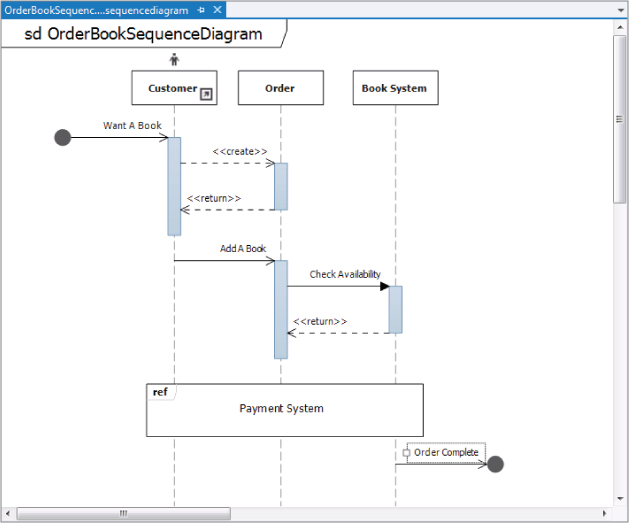
Sequence diagrams display interactions between different objects. This interaction usually takes place as a series of messages between the different objects. Sequence diagrams can be considered an alternate view to the activity diagram. A sequence diagram can show a clear view of the steps in a use case. Figure 13.3 shows an example of a sequence diagram.
Component Diagrams
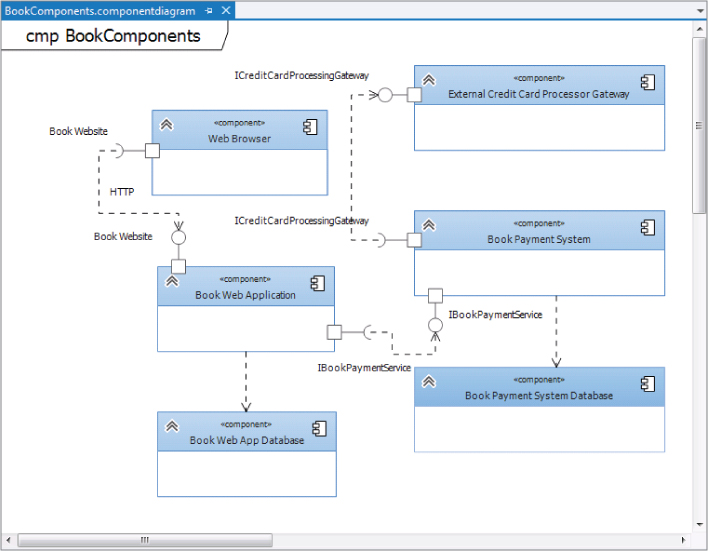
Component diagrams help visualize the high-level structure of the software system. They show the major parts of a system and how those parts interact and depend on each other. One nice feature of component diagrams is that they show how the different parts of the design interact with each other, regardless of how those individual parts are actually implemented. Figure 13.4 shows an example of a component diagram.
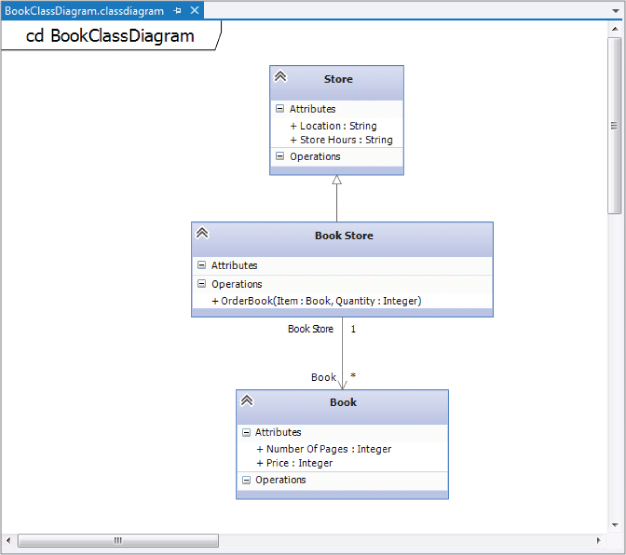
Class Diagrams
Class diagrams describe the objects in the application system. They do this without referencing any particular implementation of the system itself. This type of UML modeling diagram is also referred to as a conceptual class diagram. Figure 13.5 shows an example of a class diagram.
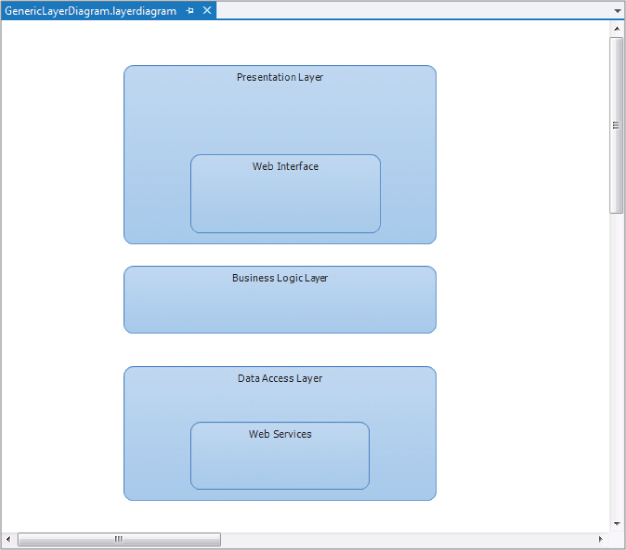
Layer Diagrams
Layer diagrams are used to describe the logical architecture of your system. A layer diagram organizes the objects in your code into different groups (or layers) that describe the different tasks those objects perform. Layers can also be composed of sublayers, which you can use to describe smaller, discrete tasks in the parent layer. In addition, you can use layer diagrams to show dependencies between different aspects of your code. Figure 13.6 shows an example of a layer diagram.
Architecture Explorer
The Architecture Explorer tool provided by Visual Studio 2012 helps in understanding the existing architecture of a code base. This tool enables you to drill down into an existing code base, or even into compiled managed code, to help you understand how the application works, without having to open a single code file.
The Architecture Explorer can also lead into the world of dependency graphs, which are a type of view in Visual Studio Ultimate 2012 that makes it easy to understand code that is new or unfamiliar. Dependency graphs make use of the Directed Graph Markup Language (DGML) to show the relationships between different areas of code in an easy-to-understand, graphical fashion.
What's New with Architecture Tools in Visual Studio Ultimate 2012
Although the previous section may make you think that there is nothing new about the architecture tools, that is not the case. In addition to the UML modeling diagrams and the Architecture Explorer that you had access to in Visual Studio 2010 Ultimate, Visual Studio 2012 provides new tools to help with your architecture needs. This section describes some of the new features available with regard to the architecture tools in Visual Studio 2012.
Architecture Menu Options
The architecture main menu option in Visual Studio 2012 has a couple of new features. The first is the ability to generate dependency graphs directly for a solution or an include file. The two menu options are Generate Dependency Graph For Solution and Generate Dependency Graph For Include File.
The For Solution option generates a dependency graph for the entire open solution and works for both managed and native code. The For Include File generates a dependency graph based on an include file, and, as you would expect, works only for native code.
Another new feature is the XMI Import feature. This feature was originally an add-on for Visual Studio 2010 from the Visual Studio Feature Packs, which has now been integrated directly into the product. XMI Import enables you to add UML elements from other tools to UML diagrams in Visual Studio Ultimate 2012 by importing them as XML Metadata Interchange (XMI) files. Using this feature, you can import UML sequence diagrams, class diagrams, and use case diagrams, and then view and use those diagrams.
XMI Export is not supported from Visual Studio Ultimate 2012 by default. However, there is an XMI Export source-code sample available with the VS VMSdk samples that can be used to create a custom XMI export option. More information on the SDK can be found at http://aka.ms/VS12VMSDK.
Dependency Graph Enhancements
There was a big investment in Visual Studio Ultimate 2012 to make dependency graphs better. One of the biggest gripes with dependency graphs in Visual Studio 2010 was they were very slow, and that graphing a large amount of information was painful and could lead to “out of memory” errors. This has been addressed in Visual Studio 2012 with the addition of the code index. The code index is a local database that contains information related to your dependency graphs. When you generate a dependency graph for the first time, Visual Studio creates a code index that contains all the dependencies that it finds. This helps improve the performance of future operations because when changes occur to the code base, only the affected code is reindexed. The code index also helps to fix the “out of memory” errors found in the previous version.
The addition of the code index means that dependency graphs are rendered faster and are easier to drill into and out of. Another new feature is the ability to do incremental layouts. In Visual Studio 2010, when you wanted to make a change to a dependency graph, you had to lay out the entire graph from scratch. With the new incremental layout feature, only the relevant portions of the graph are redrawn, making the graph visualization faster.
Visual Studio Visualization and Modeling SDK
You can use the Visual Studio Visualization and Modeling SDK (VsVmSDK) to create model-based development tools that can integrate into Visual Studio. You can use this toolset to create domain-specific languages as well as to extend the UML models and diagrams within Visual Studio 2012. The VsVmSDK was originally available with Visual Studio 2010 and has been enhanced for Visual Studio 2012.
One of the new features available in the toolset is a code index SDK, which enables you to create a tool that can bulk index assemblies into the code index, thereby speeding up dependency graph generation. The SDK also contains Team Build tasks that can index assemblies during the build process. More information on the SDK can be found at http://aka.ms/VS12VMSDK.
Summary
This chapter began by establishing the case for doing design—specifically visual design—in the first place. The discussion highlighted the three pillars that support that vision—namely, MDD, DSLs, and the “Code Understanding” experience.
This chapter concluded with a brief look at some of the UML diagrams that are available in Visual Studio 2012, as well as some of the new architecture tool features, such as the enhancements to dependency graphs.
Chapter 14 looks at how these UML diagrams are used and implemented in Visual Studio Ultimate 2012. These diagrams are extremely useful from a modeling perspective, especially for communicating what the project is trying to accomplish, and how the different systems will interact.