
Chapter 20
Profiling and Performance
What's In This Chapter?
- Understanding the profiling features in Visual Studio 2012
- Understanding available profiling types
- Using Performance Explorer to configure profiling sessions
- Profiling reports and available views
- Profiling JavaScript
Wrox.com Code Downloads for this Chapter
The wrox.com code downloads for this chapter are found at www.wrox.com/remtitle.cgi?isbn=1118314081 on the Download Code tab. The files are in the Chapter 20 download folder and individually named as shown throughout this chapter.
One of the more difficult tasks in software development is determining why an application performs slowly or inefficiently. Before Visual Studio 2005, developers were forced to turn to external tools to effectively analyze performance. Now, however, Visual Studio includes profiling tools that are fully integrated with both the IDE and other Visual Studio features.
This chapter introduces Visual Studio 2012's profiling tools. Note that the profiling features discussed in this chapter are available in Visual Studio Premium 2012 or higher.
You find out how to use the profiler to identify problems such as inefficient code, overallocation of memory, and bottlenecks. You learn about the two main profiling options — sampling and instrumentation — including how to use each, and when each should be applied. In Visual Studio 2012, there are two sampling options: one for CPU sampling and the other for memory allocation sampling. This chapter examines both options. This chapter also briefly reviews the profiling method, introduced in Visual Studio 2010, to see thread contentions using concurrency profiling.
After learning how to run profiling analyzers, you find out how to use the detailed reporting features that enable you to view performance metrics in a number of ways, including results by function, caller/callee inspection, call tree details, and other views.
Not all scenarios can be supported when using the Visual Studio 2012 IDE. For times when you need additional flexibility, you can use the command-line options for profiling applications, which are covered in this chapter. This enables you to integrate profiling with your build process and to use some advanced profiling options.
Introduction to Performance Analysis
Profiling is the process of observing and recording metrics about the behavior of an application. Profilers are tools used to help identify application performance issues. Issues typically stem from code that performs slowly or inefficiently, or code that causes excessive use of system memory. A profiler helps you to more easily identify these issues so that they can be corrected.
Sometimes, an application may be functionally correct and seem complete, but users quickly begin to complain that it seems “slow.” Or, perhaps you're only receiving complaints from one customer who finds a particular feature takes “forever” to complete. Fortunately, Visual Studio 2012 profiling tools can help in these situations.
A common use of profiling is to identify hotspots, sections of code that execute frequently, or for a long duration, as an application runs. Identifying hotspots enables you to turn your attention to the code that provides the largest benefit from optimization. For example, halving the execution time of a critical method that runs 20 percent of the time can improve your application's overall performance by 10 percent.
Types of Profilers
Most profiling tools fall into one (or both) of two types: sampling and instrumentation.
A sampling profiler takes periodic snapshots (called samples) of a running application, recording the status of the application at each interval, including which line of code is executing. Sampling profilers typically do not modify the code of the system under test, favoring an outside-in perspective.
Think of a sampling profiler as being like a sonar system. It periodically sends out sound waves to detect information, collecting data about how the sound refracts. From that data, the system displays the locations of detected objects.
The other type, an instrumentation profiler, takes a more invasive approach. Before running analysis, the profiler adds tracing markers (sometimes called probes) at the start and end of each function. This process is called instrumenting an application. Instrumentation can be performed in source code or, in the case of Visual Studio, by directly modifying an existing assembly. When the profiler is run, those probes are activated as the program execution flows in and out of instrumented functions. The profiler records data about the application and which probes were hit during execution, generating a comprehensive summary of what the program did.
Think of an instrumentation profiler as the traffic data recorders you sometimes see while driving. The tubes lie across the road and record whenever a vehicle passes over. By collecting the results from a variety of locations over time, an approximation of traffic flow can be inferred.
A key difference between sampling and instrumentation is that sampling profilers observe your applications while running any code, including calls to external libraries (such as the .NET Framework). Instrumentation profilers gather data only for the code that you have specifically instrumented.
Visual Studio Profiling
Visual Studio 2012 offers powerful profiling tools that you can use to analyze and improve your applications. The profiling tools offer both sampling and instrumented approaches. Like many Visual Studio features, profiling is fully integrated with the Visual Studio IDE and other Visual Studio features, such as work item tracking, the build system, version control check-in policies, and more.
The profiling tools in Visual Studio are based upon two tools that have been used for years internally at Microsoft. The sampling system is based on the Call Attributed Provider (CAP) tool, and the instrumentation system is based on the Low-Overhead Profiler (LOP) tool. Microsoft did not simply repackage existing internal tools and call it a day. They invested considerable development effort to add new capabilities and to fully integrate them with other Visual Studio features.
Using the Profiler
The Visual Studio developers have done a good job making the profiler easy to use. You follow four basic steps to profile your application:
Each step is described in the following sections.
Creating a Sample Application
Before describing how to profile an application, create a sample application that you can use to work through the content of this chapter. Of course, this is only for demonstration, and you can certainly use your own existing applications instead.
Create a new C# Console Application and name it DemoConsole. This application demonstrates some differences between using a simple class and a structure.
First, add a new class file called WidgetClass.cs with the following class definition:
namespace DemoConsole
{
    public class WidgetClass
    {
        private string _name;
        private int _id;

        public int ID
        {
            get { return _id; }
            set { _id = value; }
        }

        public string Name
        {
            get { return _name; }
            set { _name = value; }
        }

        public WidgetClass(int id, string name)
        {
            _id = id;
            _name = name;
        }
    }
}
Also, add the System.Collections namespace to the file. Now, slightly modify that class to make it a value type. Make a copy of the WidgetClass.cs file named WidgetValueType.cs and open it. To make WidgetClass into a structure, change the word class to struct. Now, rename the two places you see WidgetClass to WidgetValueType and save the file.
You should have a Program.cs already created for you by Visual Studio. Open that file and add the following two lines in the Main method:
     ProcessClasses(2000000);
     ProcessValueTypes(2000000);
Add the following code to this file as well:
     public static void ProcessClasses(int count)
     {
         ArrayList widgets = new ArrayList();
         for (int i = 0; i < count; i++)
             widgets.Add(new WidgetClass(i, "Test"));
         string[] names = new string[count];
         for (int i = 0; i < count; i++)
             names[i] = ((WidgetClass)widgets[i]).Name;
     }
     public static void ProcessValueTypes(int count)
     {
         ArrayList widgets = new ArrayList();
         for (int i = 0; i < count; i++)
             widgets.Add(new WidgetValueType(i, "Test"));
         string[] names = new string[count];
         for (int i = 0; i < count; i++)
             names[i] = ((WidgetValueType)widgets[i]).Name;
     }
    }
}
You now have a simple application that performs many identical operations on a class and a similar structure. First, it creates an ArrayList and adds two million copies of both WidgetClass and WidgetValueType. It then reads through the ArrayList, reading the Name property of each copy and storing that name in a string array. You'll see how the seemingly minor differences between the class and structure affect the speed of the application, the amount of memory used, and its effect on the .NET garbage collection process.
Creating a Performance Session
To begin profiling an application, you must first create a performance session. This is normally done using the Performance Wizard, which walks you through the most common settings. You may also create a blank performance session or base a new performance session on a unit test result. Each of these methods is described in the following sections.
Using the Performance Wizard
The easiest way to create a new performance session is to use the Performance Wizard. In Visual Studio 2012, there is a menu item called Analyze, which is where the Performance Wizard and other profiler menu items are located. Select Analyze ⇒ Launch Performance Wizard. A three-step wizard guides you through the creation of your session.
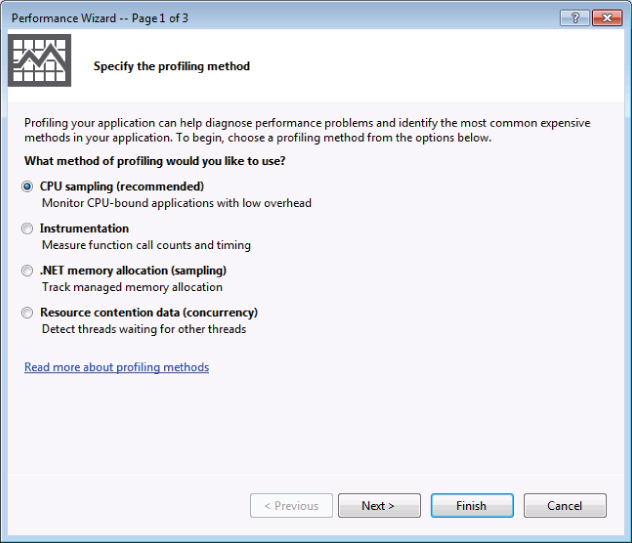
The first step, shown in Figure 20.2, is to select the profiling method.
As mentioned earlier, Visual Studio 2012 has the following four profiling options:
- CPU Sampling
- Instrumentation
- .NET Memory Allocation (sampling)
- Resource contention data (concurrency)
CPU Sampling is the recommended method to get started, and is chosen by default, as you see in Figure 20.2.
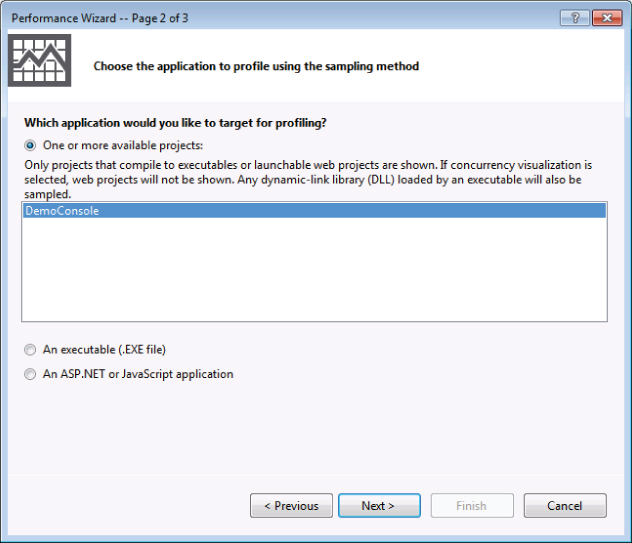
The second step, shown in Figure 20.1, is to select the application you are profiling. In this case, you are profiling the recently created DemoConsole application. You should see the DemoConsole application listed under One or More Available Projects. If there are multiple applications listed there, you can select more than one to profile.
As you see in Figure 20.1, with Visual Studio 2012 you can also profile an executable (or .exe file) or an ASP.NET/JavaScript application. If you choose to profile an executable then you must provide the path for the executable with any command-line arguments and the start-up directory. If you choose to profile an ASP.NET application then you must supply the URL for the web application. Select the DemoConsole application as the target for profiling.
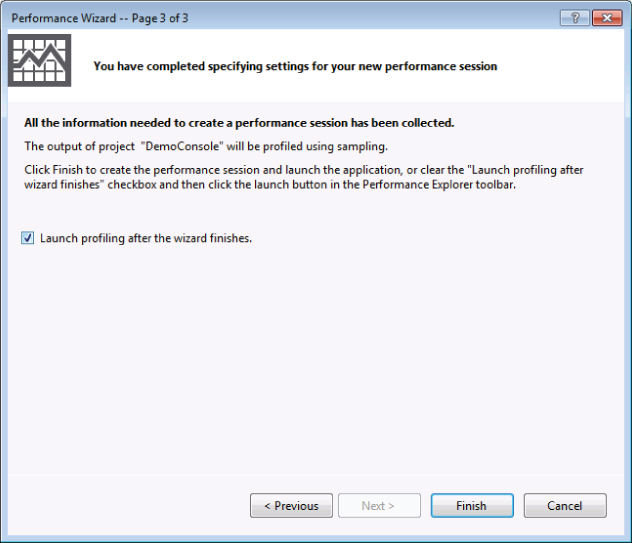
The final step in the wizard summarizes the selections in Step 1 and Step 2. Note that, in Visual Studio 2012, the profiling session is set to start after the wizard is finished. This is because the Launch Profiling After the Wizard Finishes checkbox is enabled by default, as shown in Figure 20.3. To just save the settings and start a profiling session at a later time, disable this checkbox and click Finish.
Although you can now run your performance session, you may want to change some settings. These settings are described later in this chapter in the “Setting General Session Properties” section.Adding a Blank Performance Session
There may be times (for example, when you're profiling a Windows Service) when manually specifying all of the properties of your session would be useful or necessary. In those cases, you can skip the Performance Wizard and manually create a performance session.
Create a blank performance session by selecting Analyze ⇒ Profiler ⇒ New Performance Session. You see a new performance session, named Performance1, in the Performance Explorer window. This window is described in detail later in this chapter in the section “Using the Performance Explorer.”
After creating the blank performance session, you must manually specify the profiling mode, target(s), and settings for the session. As mentioned previously, performance session settings are described later in this chapter in the section “Setting General Session Properties.”
Creating a Performance Session from a Unit Test
The third option for creating a new performance session is from a unit test. Refer to Chapter 18 for a full description of the unit testing features in Visual Studio 2012.
There may be times when you have a test that verifies the processing speed (perhaps relative to another method or a timer) of a target method. Perhaps a test is failing because of system memory issues. In such cases, you might want to use the profiler to determine what code is causing problems.
To create a profiling session from a unit test, first run the unit test. Then, in the Test Results window, right-click the test and choose Create Performance Session from the context menu. Visual Studio 2012 then creates a new performance session with the selected unit test automatically assigned as the session's target. When you run this performance session, the unit test is executed as normal, but the profiler is activated and collects metrics on its performance.
Using the Performance Explorer
After you have created your performance session, you can view it using the Performance Explorer. The Performance Explorer, shown in Figure 20.4, is used to configure and execute performance sessions and to view the results from the performance sessions.
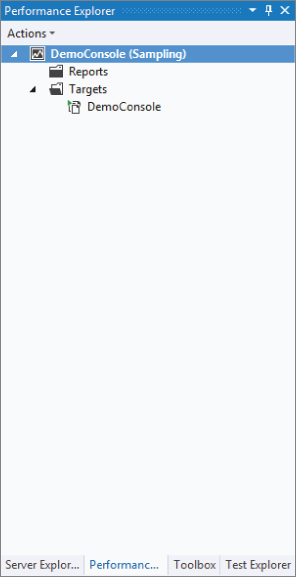
The Performance Explorer features two folders for each session: Targets and Reports. Targets specifies which application(s) are profiled when the session is launched. Reports lists the results from each of the current session's runs. These reports are described in detail later in this chapter.
Performance Explorer also supports multiple sessions. For example, you might have one session configured for sampling and another for instrumentation. You should rename them from the default PerformanceX names for easier identification.
If you accidentally close a session in Performance Explorer, you can reopen it by using the Open option of the File menu. You are likely to find the session file (ending with .psess) in your solution's folder.
Setting General Session Properties
Whether you used the Performance Wizard to create your session or added a blank one, you might want to review and modify the session's settings. Right-click the session name (for example, DemoConsole) and choose Properties. You see the Property Pages dialog for the session. It features several sections, described next.
General Property Page
Figure 20.5 shows the General page of the Property Pages dialog.
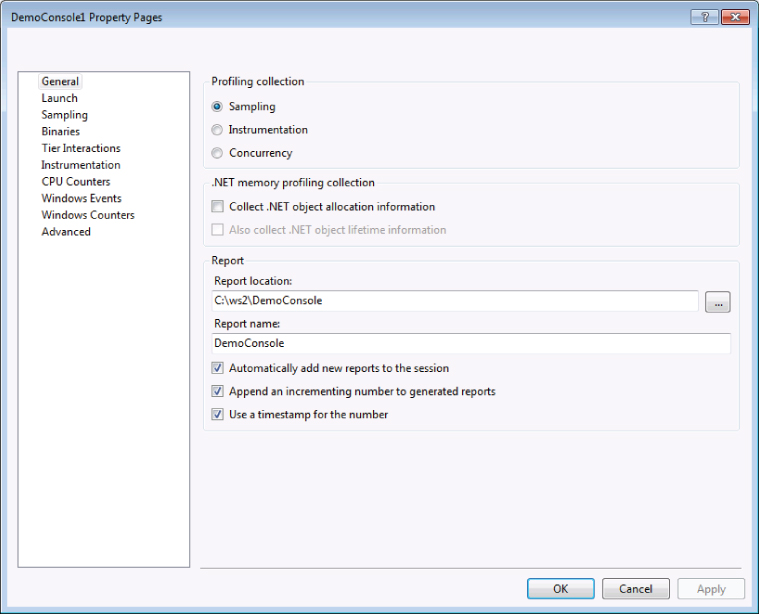
The Profiling Collection panel of this dialog reflects your chosen profiling type (that is, Sampling, Instrumentation, or Concurrency).
The .NET Memory Profiling Collection panel enables the tracking of managed types. When the first option, Collect .NET Object Allocation Information, is enabled, the profiling system collects details about the managed types that are created during the application's execution. The profiler tracks the number of instances, the amount of memory used by those instances, and which members created the instances. If the first option is selected, then you can choose to include the second option, Also Collect .NET Object Lifetime Information. If selected, additional details about the amount of time each managed type instance remains in memory is collected. This enables you to view further effects of your application, such as its effect on the .NET garbage collector.
The options in the .NET Memory Profiling Collection panel are off by default. Turning them on adds substantial overhead and causes both the profiling and report-generation processes to take additional time to complete. When the first option is selected, the Allocation view of the session's report is available for review. The second option enables display of the Objects Lifetime view. These reports are described later in this chapter in the section “Reading and Interpreting Session Reports.”
In the Data Collection Control panel, you can toggle the launch of data collection control while the profiling is launched. If you have checked the Launch Data Control Collection checkbox, then, during the profiling session, you see the Data Collection Control window. Using this window, you can specify marks that could become handy while analyzing the report after the profiling session is completed. You do that by choosing the Marks view while viewing the report.
Finally, you can use the Report panel to set the name and location for the reports that are generated after each profiling session. By default, a timestamp is used after the report name so that you can easily see the date of the session run. Another default appends a number after each subsequent run of that session on a given day. (You can see the effect of these settings in Figure 20.15 later in this chapter, where multiple report sessions were run on the same day.)
For example, the settings in Figure 20.5 run a sampling profile without managed type allocation profiling, and the data collection control is launched. If run on January 1, 2012, it produces a report named DemoConsole120101.vsp. Another run on the same day produces a report named DemoConsole120101(1).vsp.
Launch Property Page
Although the sample application has only one binary to execute and analyze, your projects might have multiple targets. In those cases, use the Launch property page to specify which targets should be executed when the profiling session is started or “launched.” You can set the order in which targets will be executed using the “move up” and “move down” arrow buttons.
Targets are described later in this chapter in the section “Configuring Session Targets.”
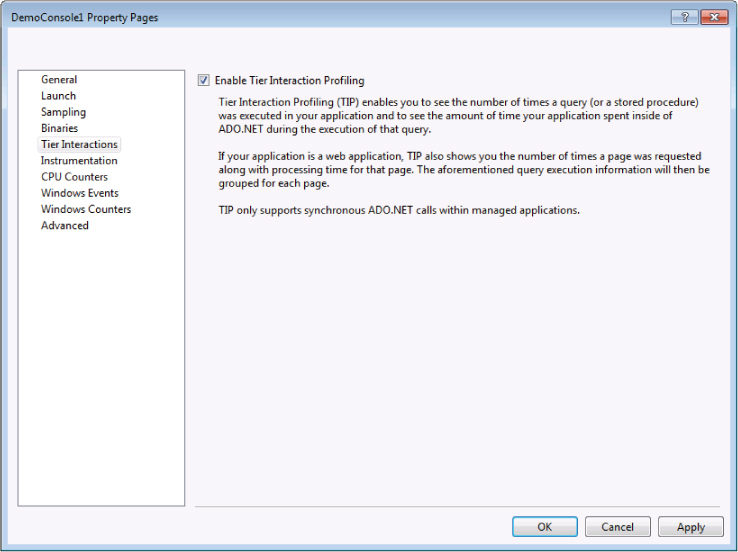
Tier Interaction Proprety Page
Tier Interaction profiling is a capability initially introduced in Visual Studio 2010. This method captures additional information about the execution times of functions that interact with the database.
Multi-tier architecture is commonly used in many applications, with tiers for presentation, business, and database. With Tier Interaction profiling, you can now get a sense of the interaction between the application tier and the data tier, including how many calls were made and the time of execution.
As of this writing, Tier Interaction profiling only supports the capturing of execution times for synchronous calls using ADO.NET. It does not support native or asynchronous calls.
To start collecting tier interaction data, select the Enable Tier Interaction Profiling checkbox, as shown in Figure 20.7.
After you run the profiling with this selection turned on, you are presented with the profiling report. Select the Tier Interactions view from the Current View dropdown list, shown in Figure 20.6. This example shows the results of running the profiling on the “Fabrikam Fiber” sample application. This application is available in the demo virtual machine for Visual Studio 2012 available for download from Microsoft.
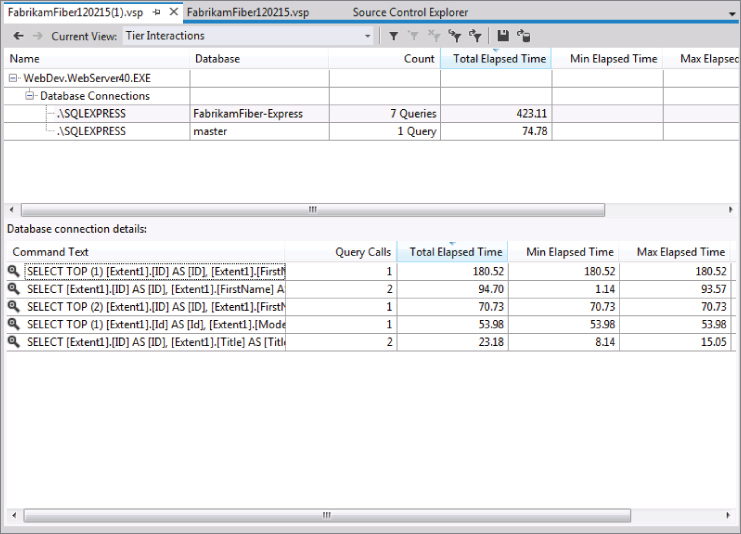
This view shows the associated database connections, and how many queries were called from the web application. For example, seven queries were made to the FrabrikamFiber-Express database
The bottom window shows the details of the queries that were called, and the number of times each of these queries was called. This view also includes information on the timing of these queries. You can quickly see that the information captured about the interaction between the application tier and data tier can come in handy in debugging performance and bottleneck issues associated with the interaction between these two tiers.
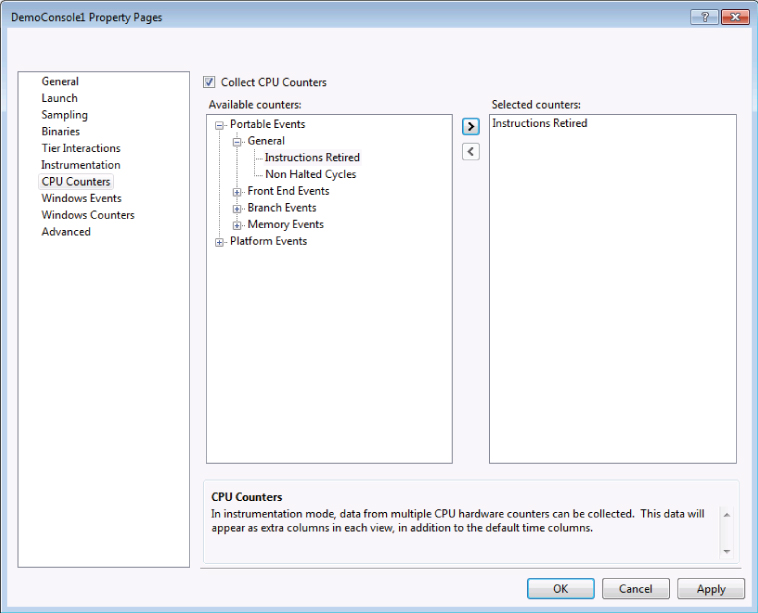
CPU Counters Property Page
The CPU Counters property page (shown in Figure 20.8) is used to enable the collecting of CPU-related performance counters as your profiling sessions run. Enable the counters by checking the Collect CPU Counters checkbox. Then, select the counters you want to track from the Available Counters list, and click the right-pointing arrow button to add them to the Selected Counters list.
Windows Events Property Page
The Windows Events property page enables you to collect additional trace information from a variety of event providers. This can include items from Windows itself, such as disk and file I/O, as well as the .NET CLR. If you're profiling an ASP.NET application, for example, you can collect information from IIS and ASP.NET.
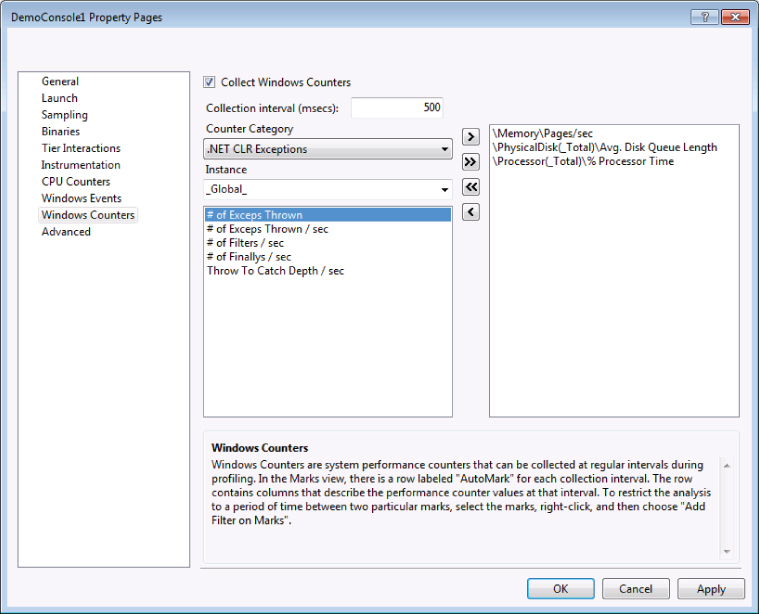
Windows Counters Property Page
The Windows Counters property page (shown in Figure 20.9) is used to enable the collection of Windows counters. These are performance counters that can be collected at regular intervals. Enable the counters by checking the Collect Windows Counters box. Then, select the Counter Category you want to choose from. Select the counters from the list, and click the right-pointing arrow button to add them to the list on the right.
Configuring Session Targets
If you used the Performance Wizard to create your session, you already have a target specified. You can modify your session's targets with the Performance Explorer. Simply right-click the Targets folder and choose Add Target Binary. Or, if you have a valid candidate project in your current solution, choose Add Target Project. You can also add an ASP.NET website target by selecting Add Existing Web Site.
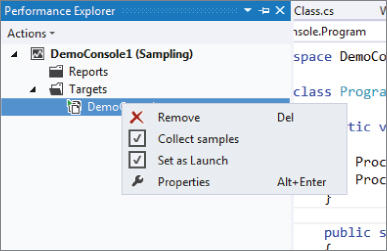
Each session target can be configured independently. Right-click any target and you see a context menu like the one shown in Figure 20.10.
If the session's mode is instrumentation, an Instrument option is also available instead of the Collect Samples option. This indicates that when you run this session, that target will be included and observed.
The other option is Set as Launch. When you have multiple targets in a session, you should indicate which of the targets will be started when the session is launched. For example, you could have several assembly targets, each with launch disabled (deselected), but one application .exe that uses those assemblies. In that case, you mark the application's target with the Set as Launch property. When this session is launched, the application is run, and data is collected from the application and the other target assemblies.
If you select the Properties option, you see a Property Pages dialog for the selected target (shown in Figure 20.11). Remember that these properties only affect the currently selected target, not the overall session.
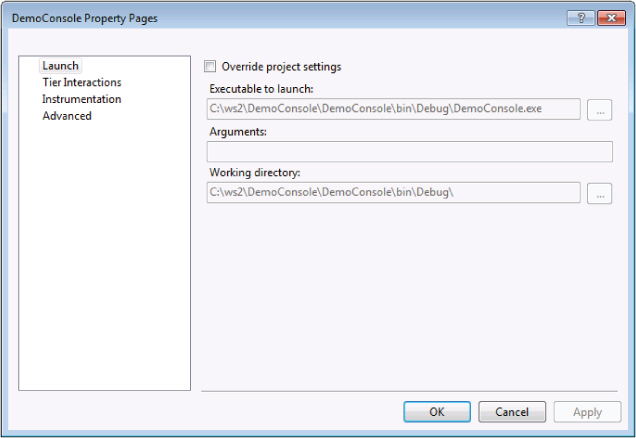
If you choose Override Project Settings, you can manually specify the path and name of an executable to launch. You can provide additional arguments to the executable and specify the working directory for that executable as well.
The Tier Interactions property page shows up here if you have chosen the tier interaction for the performance session.
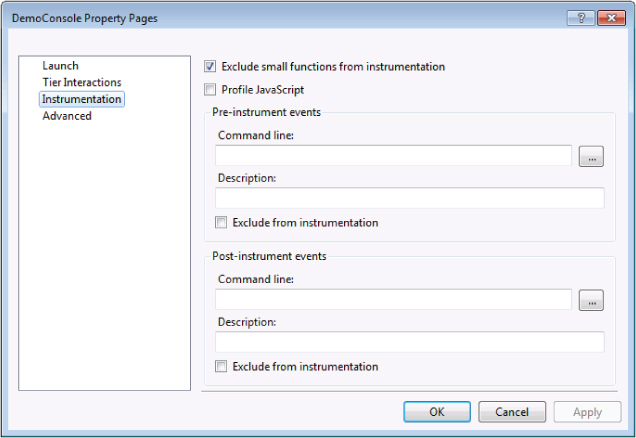
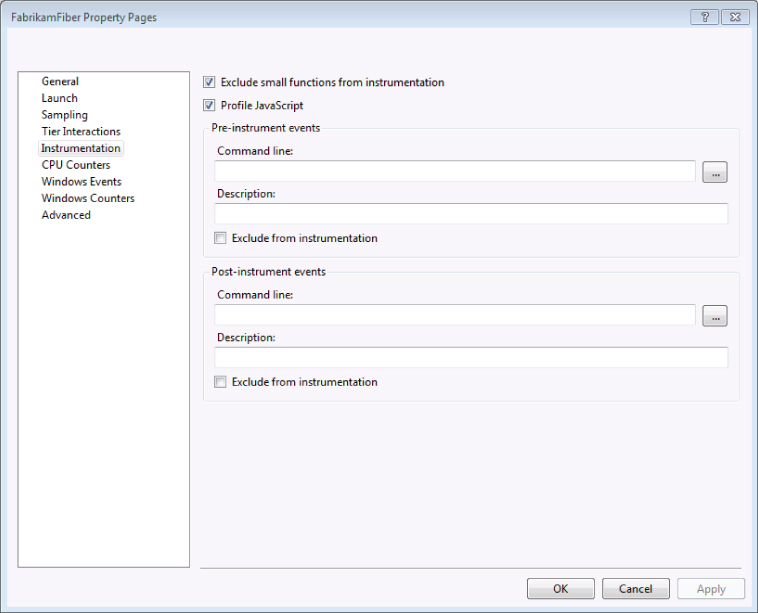
The Instrumentation property page (shown in Figure 20.12) has options to run executables or scripts before and/or after the instrumentation process occurs for the current target. You may exclude the specified executable from instrumentation as well.
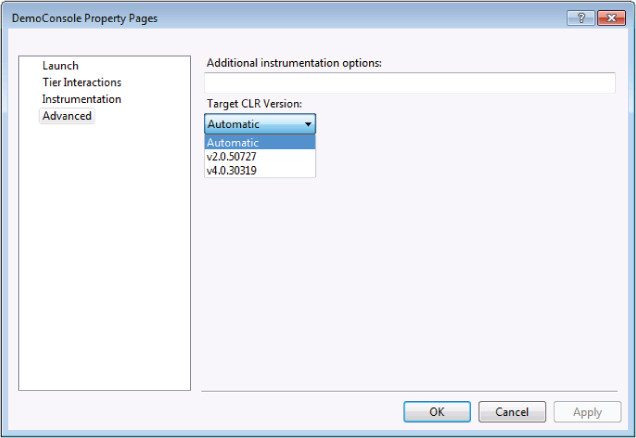
The Advanced property page is identical to the one under the General project settings. It is used to supply further command-line options to VSInstr.exe, the utility used by Visual Studio to instrument assemblies when running an instrumentation profiling session.
The Advanced property page is where you specify the .NET Framework run-time to profile, as shown in Figure 20.13. As you see in the figure, the machine being used for demonstration purposes here has .NET 2.0 and .NET 4.0 Beta installed; hence, those two options can be seen in the dropdown list.
Configuring a Sampling Session
Sampling is a very lightweight method of investigating an application's performance characteristics. Sampling causes the profiler to periodically interrupt the execution of the target application, noting which code is executing and taking a snapshot of the call stack. When sampling completes, the report includes data such as function call counts. You can use this information to determine which functions might be bottlenecks or critical paths for your application, and then create an instrumentation session targeting those areas.
Because you are taking periodic snapshots of your application, the resulting view might be inaccurate if the duration of your sampling session is too short. For development purposes, you could set the sampling frequency very high, enabling you to obtain an acceptable view in a shorter time. However, if you are sampling against an application running in a production environment, you might want to minimize the sampling frequency to reduce the effect of profiling on the performance of your system. Of course, doing so requires a longer profiling session run to obtain accurate results.
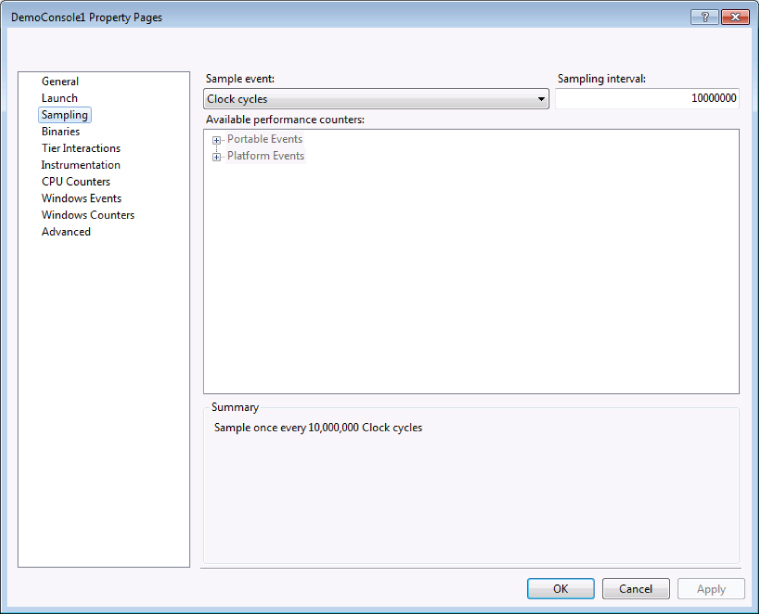
By default, a sampling session interrupts the target application every 10 million clock cycles. If you open the session property pages and click the Sampling page, as shown in Figure 20.14, you may select other options as well.
You can use the Sampling Interval field to adjust the number of clock cycles between snapshots. Again, you might want a higher value (resulting in less frequent sampling) when profiling an application running in production, or a lower value for more frequent snapshots in a development environment. The exact value you should use will vary depending on your specific hardware and the performance of the application you are profiling.
If you have an application that is memory-intensive, you may try a session based on page faults. This causes sampling to occur when memory pressure triggers a page fault. From this, you are able to get a good idea of what code is causing those memory allocations.
You can also sample based on system calls. In these cases, samples are taken after the specified number of system calls (as opposed to normal user-mode calls) has been made. You may also sample based on a specific CPU performance counter (such as misdirected branches or cache misses).
Configuring an Instrumentation Session
Instrumentation is the act of inserting probes or markers in a target binary, which, when hit during normal program flow, cause the logging of data about the application at that point. This is a more invasive way of profiling an application, but because you are not relying on periodic snapshots, it is also more accurate.
When you're configuring an instrumentation session (refer to Figure 20.2 for the profiling method options), three additional property pages can be of use: Instrumentation, Binaries, and Advanced. The Instrumentation tab is identical to the Instrumentation property page that is available on a per-target basis, as shown in Figure 20.12. The difference is that the target settings are specific to a single target, whereas the session's settings specify executables to run before/after all targets have been instrumented.
The Binaries property page is used to manage the location of your instrumented binaries. By checking Relocate Instrumented Binaries and specifying a folder, Visual Studio takes the original target binaries, instrument them, and place them in the specified folder.
For instrumentation profiling runs, Visual Studio automatically calls the VSInstr.exe utility to instrument your binaries. Use the Advanced property page to supply additional options and arguments (such as /VERBOSE) to that utility.
Configuring a .NET Memory Allocation Session
The .NET memory allocation profiling method interrupts the processor for every allocation of managed objects. The profiler collects details about the managed types that are created during the application's execution. (See Figure 20.2 for the profiling method options.) The profiler tracks the number of instances, the amount of memory used by those instances, and which members created the instances.
When you check the Also Collect .NET Object Lifetime Information option in the General properties page (Figure 20.5), additional details about the amount of time each managed type instance remains in memory is collected. This enables you to view further effects of your application, such as its effect on the .NET garbage collector.
Configuring a Concurrency Profiling Session
Concurrency profiling is a method that was introduced in Visual Studio 2010. Using this method, you can collect the following two types of concurrency data:
- Resource contention — This captures information every time a function in the application is waiting for a resource because of a synchronous event.
- Thread execution — This captures information on thread contention, processor utilization, execution delays, and other system events.
Executing a Performance Session
After you have configured your performance session and assigned targets, you can execute (or launch) that session. In the Performance Explorer window (Figure 20.4), right-click a specific session, and choose Start Profiling.
Because Performance Explorer can hold more than one session, you designate one of those sessions as the current session. By default, the first session is marked as current. You can invoke the current session by selecting the Actions ⇒ Start Profiling menu command.
You may also run a performance session from the command line. For details, see the section “Command-Line Profiling Utilities,” later in this chapter.
When a session is launched, you can monitor its status via the output window. You see the output from each of the utilities invoked for you. If the target application is interactive, you can use the application as normal. When the application completes, the profiler shuts down and generates a report.
When profiling an ASP.NET application, an instance of Internet Explorer is launched, with a target URL as specified in the target's URL to Launch setting. Use the application as normal through this browser instance, and Visual Studio monitors the application's performance. After the Internet Explorer window is closed, Visual Studio stops collecting data and generates the profiling report.
Managing Session Reports
When a session run is complete, a new session report is added to the Reports folder for the executed session. The “Setting General Session Properties” section earlier in this chapter (as well as Figure 20.5) provides more details about how to modify the report name, location, and other additional properties in the General property page description.
As shown in Figure 20.15, the Reports folder holds all of the reports for the executions of that session.
Double-click a report file to generate and view the report. Or, you can right-click a report and select Open to view the report within Visual Studio (as shown in Figure 20.15).
In Visual Studio 2012, you can also compare two performance reports. With this capability, you can compare the results from a profiling session against a baseline. This will help, for example, in tracking the results from profiling sessions from one build to the next. To compare reports, right-click a report name and select Compare Performance Reports.
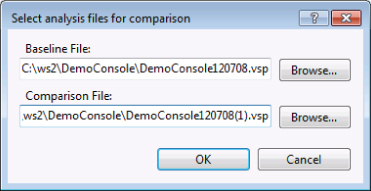
This opens a dialog in which you can select the baseline report and the comparison report, as shown in Figure 20.16.
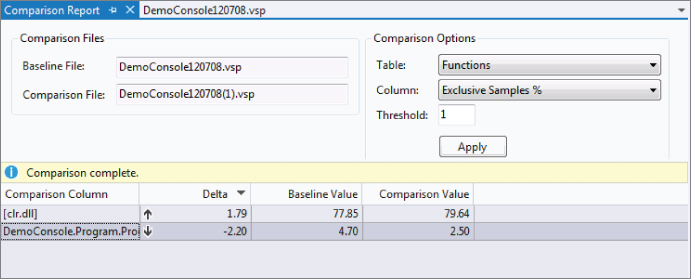
Choose the Baseline File and the Comparison File and then click OK. This generates an analysis that shows the delta between the two reports, and an indicator showing the directional move of the data between these two reports (Figure 20.17). This gives you a clear sense of how the application profile is changing between two runs.
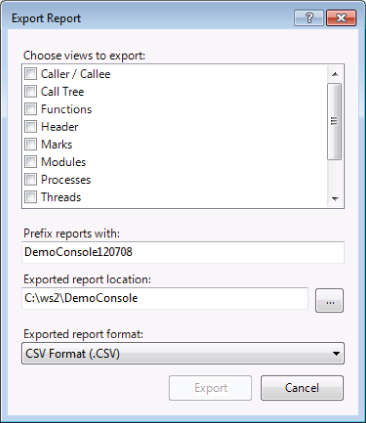
Another useful option to consider when you right-click a report is Export Report Data. When you select this option, it displays the Export Report dialog box shown in Figure 20.18. You can then select one or more sections of the report to send a target file in XML or comma-delimited format. This can be useful if you have another tool that parses this data, or for transforming via XSL into a custom report view.
Reading and Interpreting Session Reports
A performance session report is composed of a number of different views. These views offer different ways to inspect the large amount of data collected during the profiling process. The data in many views are interrelated, and you see that entries in one view can lead to further detail in another view. Note that some views have content only if you have enabled optional settings before running the session.
The amount and kinds of data collected and displayed by a performance session report can be difficult to understand and interpret at first. The following sections examine each section of a report, describing its meaning and how to interpret the results.
In any of the tabular report views, you can select which columns appear (and their order) by right-clicking in the report and selecting Choose Columns. Select the columns you want to see, and how you want to order them, by using the move buttons.
Report Information and Views
The specific information displayed by each view depends on the settings used to generate the performance session. Sampling and instrumentation produce different contents for most views, and including .NET memory profiling options affects the display as well. Before exploring the individual views that make up a report, it is important to understand some key terms.
Elapsed time includes all of the time spent between the beginning and end of a given function. Application time is an estimate of the actual time spent executing your code, subtracting system events. Should your application be interrupted by another during a profiling session, elapsed time includes the time spent executing that other application, but application time excludes it.
Inclusive time combines the time spent in the current function with time spent in any other functions that it may call. Exclusive time removes the time spent in other functions called from the current function.
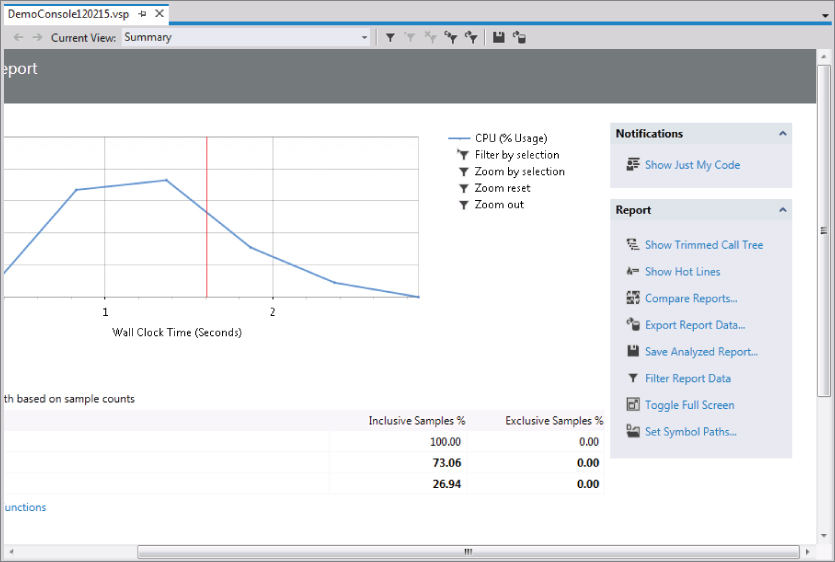
Summary View
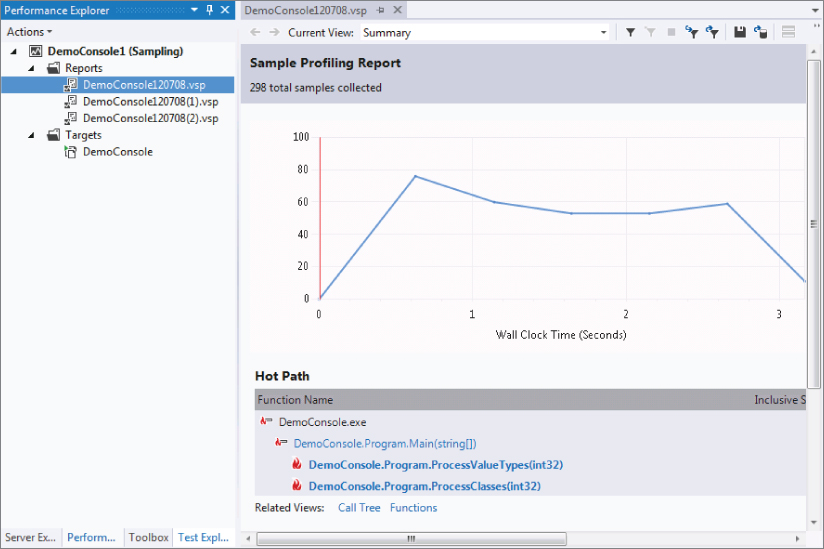
When you view a report, Summary view is displayed by default. There are two types of summary reports, depending on whether you ran a sampling or instrumented profile. Figure 20.19 shows a Summary view from a sampling profile of the DemoConsole application.
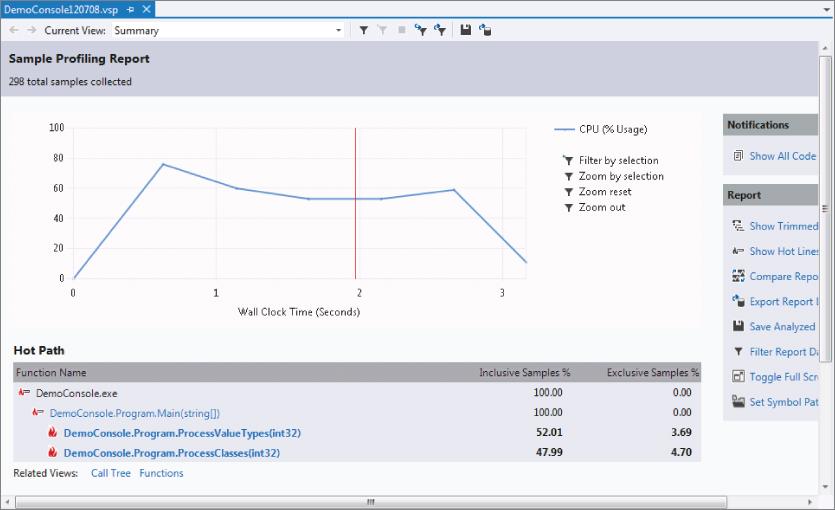
The Summary view in Visual Studio 2012 has three data sections (on the left of the screen), one Notifications section (in the top right of the screen), and a Report section (in the lower-right portion of the screen), as shown in Figure 20.19.
The first data section you see in the Summary view is the chart at the top showing the percentage of CPU usage. This chart provides a quick visual cue into any spikes you have in CPU usage. You can select a section of the chart (for example, a spike in the chart), and then you can either zoom in by selecting the Zoom by Selection link to the right of the chart, or you can filter the data by selecting the Filter by Selection link, also to the right of the chart.
The second section in the Summary view is the Hot Path. This shows the most expensive call paths. (They are highlighted with a flame icon next to the function name.) It's not a surprise that the call to ProcessClasses and to ProcessValueTypes were the expensive calls in this trivial example.
The third data section shows a list of Functions Doing Most Individual Work. A large number of exclusive samples here indicate that a large amount of time was spent on that particular function.
For the DemoConsole application, this view isn't showing a lot of interesting data. At this point, you would normally investigate the other views. For example, you can click one of the methods in the Hot Path to take you to the function details page, but because the DemoConsole application is trivial, sampling to find hotspots is not as useful as the information you can gather using instrumentation. Let's change the profiling type to instrumentation and see what information is revealed.
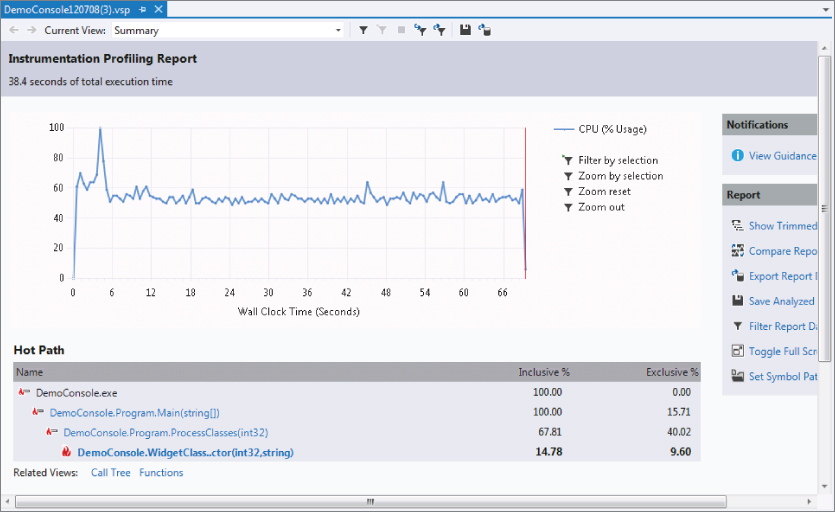
In Performance Explorer, right-click the DemoConsole profile and select Properties. Change the Profiling Collection option to Instrumentation, and click OK to close the properties window. Right-click the DemoConsole profile and select Start Profiling to start profiling, this time using instrumentation. Note that instrumentation profiling takes longer to run. When profiling and report generation are complete, you see a Summary view similar to that shown in Figure 20.21.
The Summary view of an instrumented session has three sections similar to the Summary view of a sampling session.
You can also get to the Call Tree view (which is examined shortly) or Functions view using the shortcut link provided below the Hot Path information.
The Summary view has an alternate layout that is used when the .NET Memory Profiling Collection options are enabled on the General page of the session properties. Figure 20.20 shows this view.
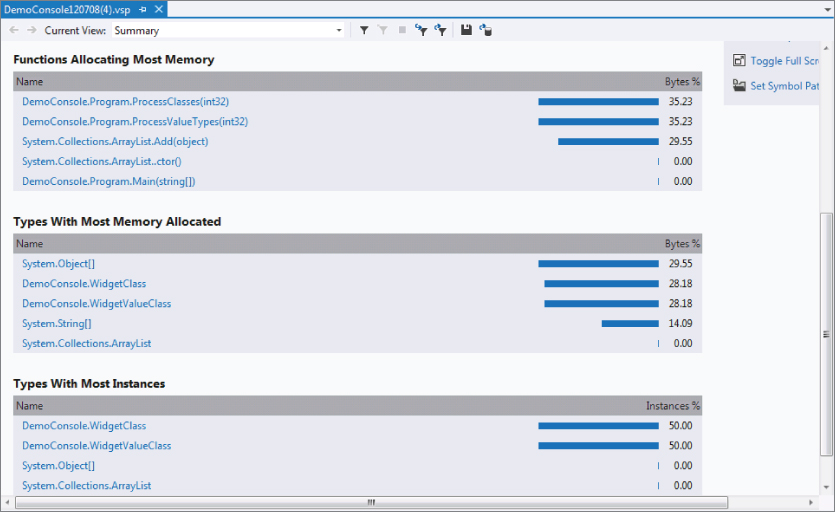
Notice that the three main sections in this view are different. The first section, Functions Allocating Most Memory, shows the functions in terms of bytes allocated. The second section, Types with Most Memory Allocated, shows the types by bytes allocated, without regard to the functions involved. Finally, Types with Most Instances shows the types in terms of number of instances, without regard to the size of those instances.
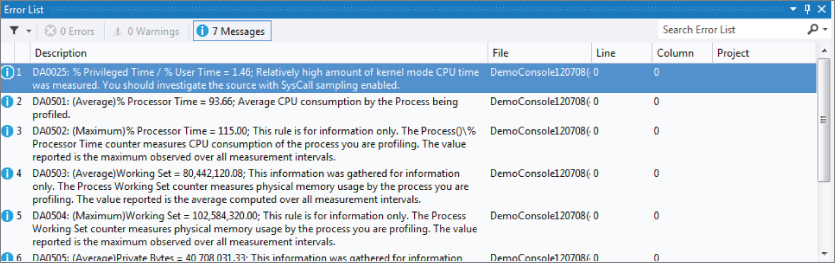
Also note the Notifications section and the Report section to the right of the CPU usage chart. If you click the View Guidance link in the Notifications section, you are shown any available errors, warnings, or informational messages. In this case, as shown in Figure 20.22, there are several information messages. You learn what these mean later in this chapter in the “Objects Lifetime View” section.
Using the Summary view, you can quickly get a sense of the most highly used functions and types within your application. In the following discussions, you see how to use the other views to dive into further detail.
Functions View and Functions Details View
Let's switch to the Functions view. You do that by selecting Functions from the Current View drop-down at the top of the report. In this view, you can begin to see some interesting results.
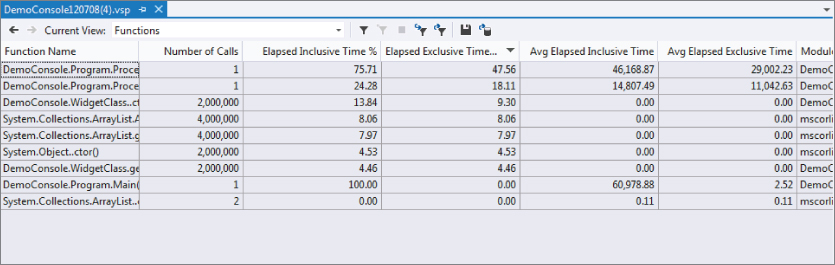
The Functions view shown in Figure 20.23 lists all functions sampled or instrumented during the session. For instrumentation, this is functions in targets that were instrumented and called during the session. For sampling, this includes any other members/assemblies accessed by the application.
Note that ArrayList.Add and ArrayList.get_Item were each called four million times. This makes sense, because ProcessValueTypes and ProcessClasses (which use that method) were each called two million times. However, if you look at the Hot Path information in the Summary views, there is a noticeable difference in the amount of time spent in ProcessingValueTypes over ProcessClasses. Remember that the code for each is basically the same — the only difference is that one works with structures, and the other with classes. You can use the other views to investigate further.
From the Functions view, right-click any function, and you can go to that function's source, see it in module view, see the function details, or see the function in Caller/Callee view (discussed in detail shortly). You can double-click any function to switch to the Functions Details view. You can also select one or more functions, right-click, and choose Copy to add the function name and associated data to the clipboard for use in other documents.
As with most of the views, you can click a column heading to sort by that column. This is especially useful for the four Time columns shown in Figure 20.23. Right-clicking in the Functions view and selecting Show in Modules view shows the functions grouped under their containing binary.
In this view, you can see the performance differences between functions, which could help you to focus on an issue.
Double-clicking a function from the Functions view loads up the Function Details view. Figure 20.24 shows the section of this view that is a clickable map with the calling function, the called functions, and the associated values.
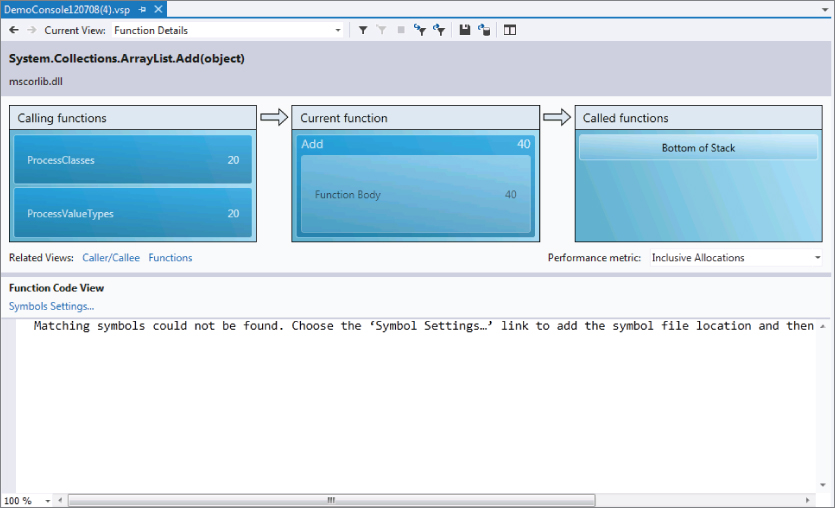
The Caller/Callee view presents this data in a tabular fashion.
Caller/Callee View
As shown in Figure 20.25, the Caller/Callee view displays a particular function in the middle, with the function(s) that call into it in the section above it, and any functions that it calls in the bottom section.
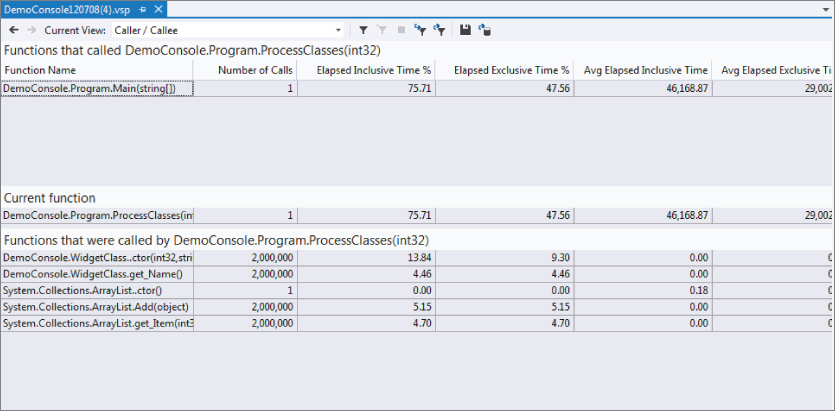
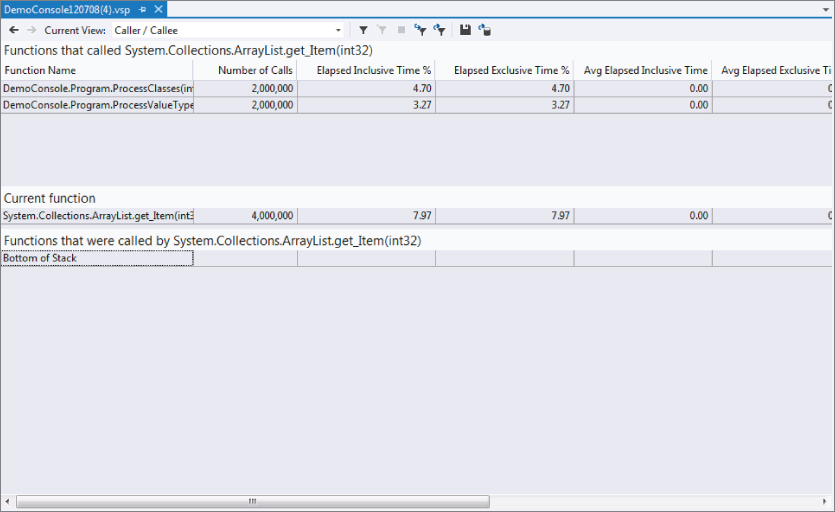
This is particularly useful for pinpointing the execution flow of your application, helping to identify hotspots. In Figure 20.25, the ProcessClasses method is in focus and shows that the only caller is the Main method. You can also see that ProcessClasses directly calls four functions. The sum of times in the caller list matches the time shown for the set function. For example, select the ArrayList.get_Item accessor by double-clicking or right-clicking it and then choose Set Function. The resulting window then displays a table similar to what is shown in Figure 20.26.
You saw ArrayList.get_Item in the main Functions view, but couldn't tell how much of that time resulted from calls by ProcessValueTypes or ProcessClasses. Caller/Callee view enables you to see this detail.
Notice that there are two callers for this function, and that the sum of their time equals the time of the function itself. In this table, you can see how much time that the ArrayList.get_Item method actually took to process the two million requests from ProcessValueTypes versus those from ProcessClasses. This enables you to analyze the processing time differences, and, if it is substantially different, to drill down on the differences to find out what could be causing the performance difference.
Call Tree View
The Call Tree view shows a hierarchical view of the calls executed by your application. The concept is somewhat similar to the Caller/Callee view, but in this view, a given function may appear twice if it is called by independent functions. If that same method were viewed in Caller/Callee view, it would appear once, with both parent functions listed at the top.
By default, the view has a root (the function at the top of the list) of the entry point of the instrumented application. To quickly expand the details for any node, right-click and choose Expand All. Any function with dependent calls can be set as the new root for the view by right-clicking and choosing Set Root. This modifies the view to show that function at the top, followed by any functions that were called directly or indirectly by that function. To revert the view to the default, right-click and choose Reset Root.
Another handy option in the context menu is Expand Hot Path. This expands the tree to show the Hot Paths with the flame icon. This is a very helpful shortcut to jump right into the functions that are potential bottlenecks.
Allocation View
If you configured your session for managed allocation profiling by choosing Collect .NET Object Allocation Information on the General property page for your session (Figure 20.5), you have access to the Allocation view. This view displays the managed types that were created during the execution of the profiled application.
You can quickly see how many instances, the total bytes of memory used by those instances, and the percentage of overall bytes consumed by the instances of each managed type.
Expand any type to see the functions that caused the instantiations of that type. You see the breakdown of instances by function as well, so, if more than one function created instances of that type, you can determine which created the most. This view is most useful when sorted by Total Bytes Allocated or Percent of Total Bytes. This tells you which types are consuming the most memory when your application runs.
As with the other report views, you can also right-click any function to switch to an alternative view, such as source code, Functions view, or Caller/Callee view.
Objects Lifetime View
The Objects Lifetime view is available only if you have selected the Also Collect .NET Object Lifetime Information option of the General properties for your session (refer to Figure 20.5). This option is only available if you have also selected the Collect .NET Object Allocation Information option.
Several of the columns are identical to those in the Allocation view table, including Instances, Total Bytes Allocated, and Percent of Total Bytes. However, in this view, you can't break down the types to show which functions created them. The value in this view lies in the details about how long the managed type instances existed and their effect on garbage collection.
The columns in this view include the number of instances of each type that were collected during specific generations of the garbage collector. With COM, objects were immediately destroyed, and memory freed, when the count of references to that instance became zero. However, .NET relies on a process called garbage collection to periodically inspect all object instances to determine whether the memory they consume can be released.
Objects are placed into groups, called generations, according to how long each instance has remained referenced. Generation zero contains new instances, generation one instances are older, and generation two contains the oldest instances. New objects are more likely to be temporary or shorter in scope than objects that have survived previous collections. So, having objects organized into generations enables .NET to more efficiently find objects to release when additional memory is needed.
The view includes Instances Alive at End and Instances. The latter is the total count of instances of that type over the life of the profiling session. The former indicates how many instances of that type were still in memory when the profiling session terminated. This might be because the references to those instances were held by other objects. It might also occur if the instances were released right before the session ended, before the garbage collector acted to remove them. Having values in this column does not necessarily indicate a problem; it is simply another data item to consider as you evaluate your system.
Having a large number of generation-zero instances collected is normal, fewer in generation one, and the fewest in generation two. Anything else indicates there might be an opportunity to optimize the scope of some variables. For example, a class field that is only used from one of that class's methods could be changed to a variable inside that method. This would reduce the scope of that variable to live only while that method is executing.
Like the data shown in the other report views, you should use the data in this view not as definitive indicators of problems, but as pointers to places where improvements might be realized. Also, keep in mind that, with small or quickly executing programs, allocation tracking might not have enough data to provide truly meaningful results.
Command-Line Profiling Utilities
Visual Studio abstracts the process of calling several utilities to conduct profiling. You can use these utilities directly if you need more control, or if you need to integrate your profiling with an automated batch process (such as your nightly build). The general flow is as follows:
These utilities can be found in your Visual Studio installation directory under Team ToolsPerformance Tools. For help with any of the utilities, supply a /? argument after the utility name.
Table 20.1 lists the performance utilities that are available as of this writing:
Table 20.1 Performance Tools
| Utility Name | Description |
| Vsinstr.exe | Used to instrument a binary |
| Vsperfcmd.exe | Used to launch a profiling session |
| Vsperfmon.exe | Starts the monitor for the profiling sessions |
| Vsperfreport.exe | Used to generate a report after a profiling session is completed |
| VsperfCLREnv.exe | Used to set environment variables required to profile a .NET application |
Profiling JavaScript
In Visual Studio 2012, you can profile JavaScript. With this option, you can collect performance data for JavaScript code. To do that, you start by setting up an instrumentation session. Then, in the Instrumentation property page, select the Profile JavaScript option, as shown in Figure 20.27.
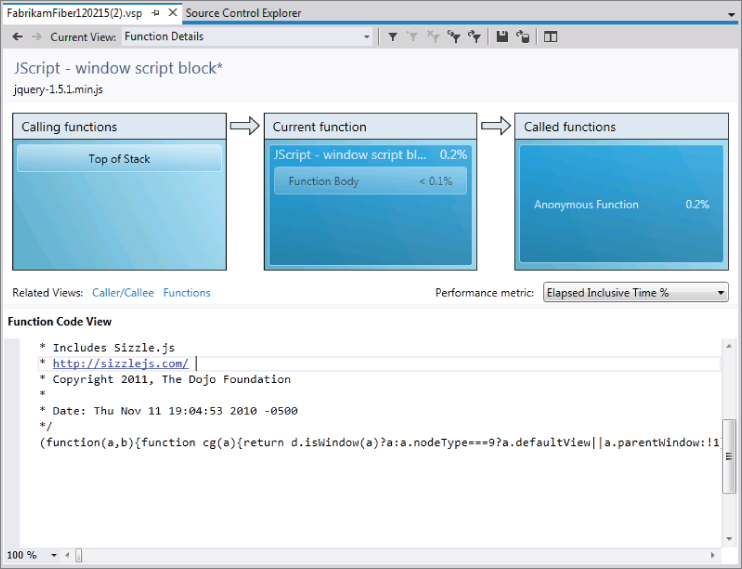
When you run this profiling session, the profiler includes performance information on JavaScript functions, along with function calls in the application. This example again uses the “Fabrikam Fiber” application. Figure 20.28 shows the Function Details view with the called functions and the elapsed times. It also shows the associated JavaScript code in the bottom pane, and that helps in identifying any potential issues with the script. This feature is very helpful to assess the performance of JavaScript functions and identifies any issues with the scripts.
Just My Code
When you run a sampling session, the report includes profiling data from all the code in the project. In most cases, you are only interested in the performance information of your code. For example, you don't need to have the performance data of .NET Framework libraries, and, even if you have it, there is not a lot you can do with that data. In the Summary view of the profiling report, you can now toggle between viewing data for all code, or just the application code. The setting for that is in the Notifications section in the Summary view, as shown in Figure 20.29.
Common Profiling Issues
Profiling is a complex topic, and it's not without a few pitfalls to catch the unwary. This section documents a number of common issues you might encounter as you profile your applications.
Debugging Symbols
When you review your profiling reports, you might notice that some function calls resolve to unhelpful entries such as [ntdll.dll]. This occurs because the application has used code for which it cannot find debugging symbols. So, instead of the function name, you get the name of the containing binary.
Debugging symbols, files with the .pdb extension (for “program database”), include the details that debuggers and profilers use to discover information about executing code. Microsoft Symbol Server enables you to use a web connection to dynamically obtain symbol files for binaries as needed.
You can direct Visual Studio to use this server by choosing Tools ⇒ Options. Expand the Debugging section and choose Symbols. Check the box next to the Microsoft Symbol Servers location. Now, close and reopen a report; the new symbols are used to resolve function names.
If your profiling system does not have Internet access — perhaps because of security restrictions — you can download and install the symbol packages for Windows from the Windows Hardware Developer Center. As of this writing, this is http://msdn.microsoft.com/en-us/windows/hardware/gg463028. Select the package appropriate for your processor and operating system and install the symbols.
Instrumentation and Code Coverage
When running an instrumentation profile, be certain that you are not profiling a target for which you have previously enabled code coverage. Code coverage, described in Chapter 7, uses another form of instrumentation that observes which lines of code are accessed as tests are executed. Unfortunately, this instrumentation can interfere with the instrumentation required by the profiler.
If your solution has a test project and you have previously used code coverage, open your Test Run Configuration under Test ⇒ Edit Test Run Configurations, and select the Code Coverage page. Ensure that the binaries you are profiling do not have code coverage enabled. If they do, uncheck them and rebuild your solution. You should then be able to use instrumentation profiling without conflict.
Summary
In this chapter, you learned about the value of using profiling to identify problem areas in your code. This chapter examined the differences between sampling and instrumentation, when each should be applied, and how to configure the profiler to execute each type. You learned about the different profiling methods. You saw the Performance Explorer in action, and learned how to create and configure performance sessions and their targets.
You then learned how to invoke a profiling session, and how to work with the reports that are generated after each run. You looked at each of the available report types, including Summary, Function, Call Tree, and Caller/Callee.
Although Visual Studio 2012 offers a great deal of flexibility in your profiling, you might find you must specify further options or profile applications from a batch application or build system. You learned about the available command-line tools. Profiling is a great tool that you can use to ensure the quality of your application.
In Chapter 21, you learn about a great feature in Visual Studio 2012 called IntelliTrace, as well as some other nifty debugging capabilities (including data tips and breakpoints).