
Chapter 21
Debugging with IntelliTrace
What's In This Chapter?
- Exploring how to run IntelliTrace
- Configuring IntelliTrace options
- Running IntelliTrace in a production environment
wrox.com Code Downloads for this Chapter
The wrox.com code downloads for this chapter are found at www.wrox.com/remtitle.cgi?isbn=1118314081 on the Download Code tab. The files are in the Chapter 21 download folder and individually named as shown throughout this chapter.
Many developers resent the fact that debugging has become one of the key components in software development. Many developers have been known to spend a considerable amount of time simply on debugging. Adding salt to the wound are programming bugs for which the behavior is not reproducible. In many instances, developers may wish there was a way to travel back in time to capture what happened and then be able to wave a magic wand to debug the issue. That wish has now come true in Visual Studio Ultimate 2012. (Not the magic wand part — that feature did not make the cut.)
This chapter examines the IntelliTrace feature, which debuted in Visual Studio 2010 Ultimate and has been enhanced in Visual Studio Ultimate 2012. In this chapter, you find out how to use this feature to aid in your debugging effort, and how you can use it in a production environment to help debug production applications.
IntelliTrace Basics
In many cases, as a developer, you have discovered that debugging is a regular activity. It is also a task that can become monotonous. For example, at some point a tester might have passed on a bug to you that you could not reproduce. You may also have experienced the agony of stepping through one step past the point where the issue occurs, only to discover that it is time to start all over again. These are just a couple of common occurrences, and there are no doubt plenty more.
Visual Studio Ultimate 2012 includes capabilities to address issues such as the famous “no repro” bug status. A key feature in this capability is the IntelliTrace feature. The key tactics used to address the nonreproducible bug are to capture as much information as possible when the bug is encountered, and to use the capability to leverage this information while debugging. The one feature that could top this would be for the bug to automatically resolve itself.
Now it's time to take a deeper look at this debugging feature through an example.
IntelliTrace — An Example
The following steps walk you through an example of using IntelliTrace to debug an application:
At this point, before IntelliTrace, you would have had to go back into the code and look at the functionality around the application to try to determine where something might be wrong. Maybe you would have gone back in to add a lot of breakpoints, and then started stepping slowly through your code. Regardless, you had to go back and run the same tests again. With IntelliTrace, you don't have to do that.
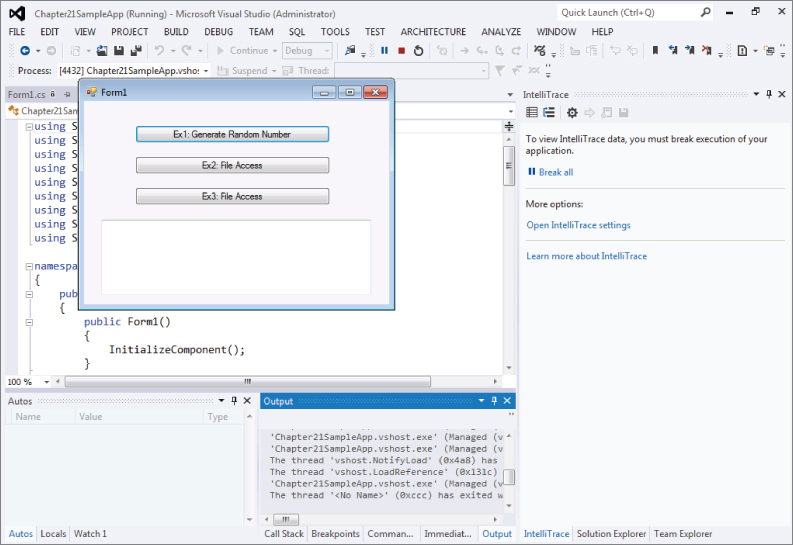
The application did not perform as expected when you clicked the Ex3: File Access button. Use IntelliTrace to figure out why. In the IntelliTrace window in Visual Studio, click the Break All link. This breaks into the debugging session and displays the IntelliTrace information collected so far, as shown in Figure 21.2.
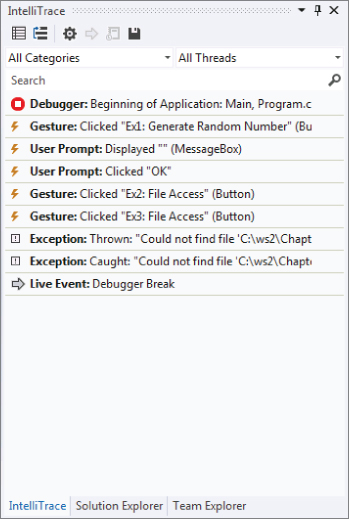
By default, IntelliTrace is configured only to capture IntelliTrace event information, so that is what is displayed initially in the window. Selecting a particular event in the window displays detailed information about the event, as well as navigates you to the code responsible for the event. For example, if you click the Gesture: Clicked “Ex1: Generate Random Number” event, the window displays detailed information related to the event and navigates to the Form1.cs tab and to the btnEx1_Click method that caused the event to fire. As a result, you can easily find the code related to the different IntelliTrace messages you may receive.
Looking through the IntelliTrace captured events, you can see two exception events. Select the Exception: Thrown event as shown in Figure 21.3.
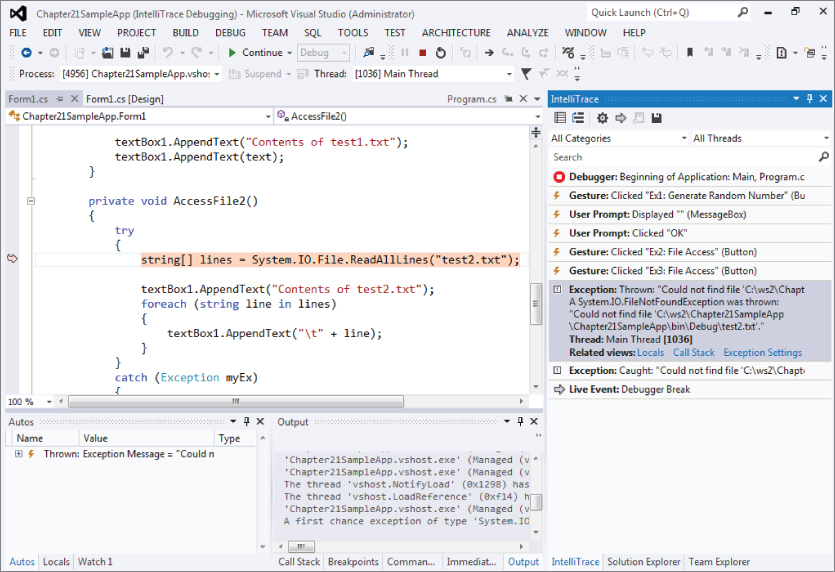
Selecting the exception event displays detailed information about the event, in this case, you see that a File Not Found exception was thrown and that the application could not find the file named test2.txt. At the same time, in the Form1.cs tab, Visual Studio navigates to the AccessFile2 method and to the offending line of code. From this, you are able to determine that the test2.txt file does not exist, which must be causing the application problem. You are able to determine all this during the same initial test run without having to restart the application or rerun any tests.
Navigating the IntelliTrace Events View
As you can imagine, for a long-running test or debugging session, the IntelliTrace events view could contain a large number of events. The IntelliTrace window has several options to make it easier to navigate the event information.
There are two dropdown boxes at the top of the IntelliTrace window. The one on the right is the Threads dropdown box. This enables you to view all the application threads for which the IntelliTrace event information was captured, and you can select only the specific threads you want to view in the window. The second dropdown box (on the left), displays all the different event categories for which IntelliTrace was configured to monitor for the particular test run. You can uncheck specific categories to remove those events from the window.
Finally, there is a search box underneath the two dropdown boxes, which you can use to search for particular words or phrases for the displayed events. For example, if you only want to display the Exception events, you can enter the word Exception in the search box and click the magnifying glass search icon. The contents of the window are filtered to only show events that contain the word Exception.
Collecting Method Call Information
As mentioned earlier, by default, IntelliTrace only collects specified event information. You can also configure IntelliTrace to collect method call information. Think of this as another way to navigate through the call stack, but you can see details around the call information. To set this, in Visual Studio, select Debug ⇒ IntelliTrace ⇒ Open IntelliTrace Settings. The Visual Studio Options window displays with the IntelliTrace settings General tab active, shown in Figure 21.4.
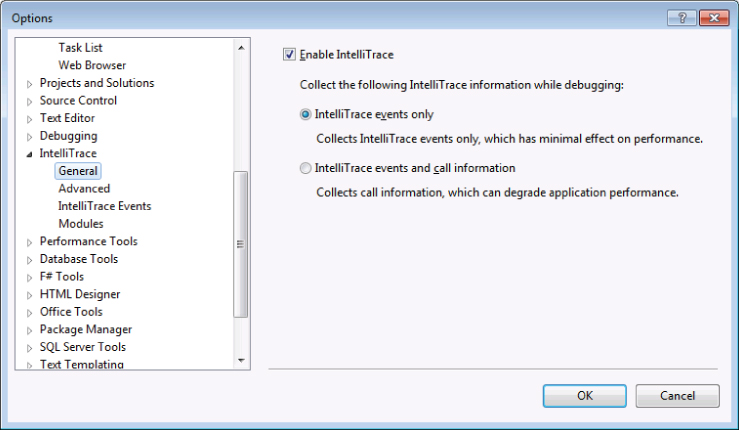
On this tab, you can turn IntelliTrace on or off for debugging sessions by selecting or deselecting the Enable IntelliTrace checkbox. You can also control what information IntelliTrace collects. As mentioned earlier, by default IntelliTrace only collects event information, which has a minimal effect on application performance. However, you can configure IntelliTrace to gather both event and method call information by selecting the IntelliTrace Events and Call Information radio button.
You should consider some things before selecting this option, though. This option collects detailed method call information, which leads to some application performance degradation. Also, the Edit and Continue features of the debugger are disabled as call information is collected. Finally, this change does not take effect until the next debugging session, so if you have made this change while in the middle of debugging, call information is not collected unless you restart your session.
To continue the example, select the IntelliTrace events and call information radio button and then click OK to close the options window. If you are currently in a debugging session in Visual Studio, stop the debugging session. Press F5 to compile and run the same application again. Click through all three buttons, as before, and then click the Break All link in the IntelliTrace window to break into the debugging session.
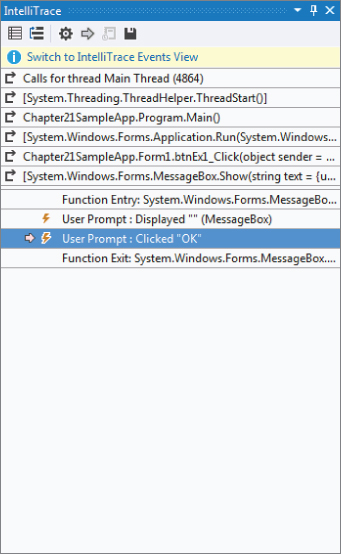
Select the User Prompt: Clicked “OK” event in the IntelliTrace window to display the event details. Click the Switch to IntelliTrace Calls View link to, switch the context of the IntelliTrace view from events to call stack information (see Figure 21.5).
You can use this view to navigate the call stack and view some variable information. Double-click the Chapter21SampleApp.Form1.btnEx1_Click call to navigate to its call information. Then double-click the Chapter21SampleApp.Form1.GetRandomNumber call. You are navigated to the GetRandomNumber method in Form1.cs, as shown in Figure 21.6.
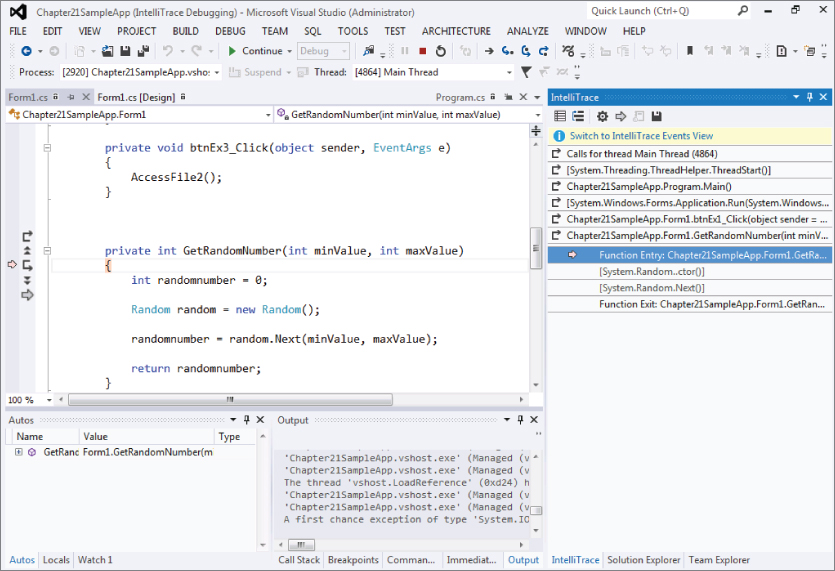
Figure 21.6 shows you more of the power of IntelliTrace when you're collecting method call information. IntelliTrace automatically collects all the input-parameter information for a method, as well as the method's return value. In the case of Figure 21.6, by looking in the locals window in the bottom left, you can see that the minValue was set to 0, the maxValue was set to 100, and the random number returned was 35. Again, it is worth pointing out that you are able to view all this information without having to remember to set specific breakpoints, or rerun the debugging process.
Having this data collection at the method entry and exit points enables you to treat the method as a black box, and can make it easier for you to determine why the method is providing the incorrect information or causing some other error.
When you are viewing IntelliTrace information in the call view, a navigation bar appears in the code window. You can see this navigation bar in Figure 21.6. You can use the navigation bar to walk through the call stack instead of clicking on call information in the IntelliTrace window. The navigation bar contains five icons that have the following associated actions. (This list is ordered to match the order of the icons in the navigation bar.)
- Return to the caller
- Go to the prior call or the event
- Step in
- Go to the next call or the event
- Return to live debugging
Collecting Detailed Information
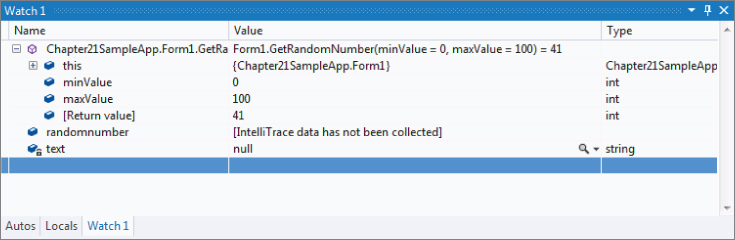
Try this. Assuming you are still in Visual Studio — in debugging mode and in the GetRandomNumber method from the last section — right-click the randomnumber variable in that method and select Add Watch from the context menu. This adds the variable randomnumber to the watch window. You might expect its value to be the same as the return value from the method (in this example, 35). However, as Figure 21.7 shows, the variable displays the message [IntelliTrace data has not been collected]. Wait, what? This is the variable that contains the value being returned by the function, so how could the value not be collected?
Although IntelliTrace collects a lot of valuable debugging information for you, it doesn't collect every little bit of information. Collecting all the information would lead to an extremely large collection file, which could ultimately be difficult to use. One of the places that IntelliTrace makes a tradeoff is with local variables. By default, local variable information is not captured via IntelliTrace collection. However, you can work around this by setting debugging breakpoints or tracepoints in your code. Setting a breakpoint or a tracepoint forces IntelliTrace to collect the local variable information at that break. Take a look at an example of this:
 Random random = new Random();
 randomnumber = random.Next(minValue, maxValue);
 return randomnumber;
Saving Your IntelliTrace Session
By default, when you exit your debugging session in Visual Studio, your IntelliTrace information is automatically deleted. It is not saved. If you want to save your IntelliTrace information to later review and use, you need to explicitly save the results to a file. Saving the results to a file enables you to pass them on to another developer, who could then review your debugging session to try to resolve any exceptions that occurred.
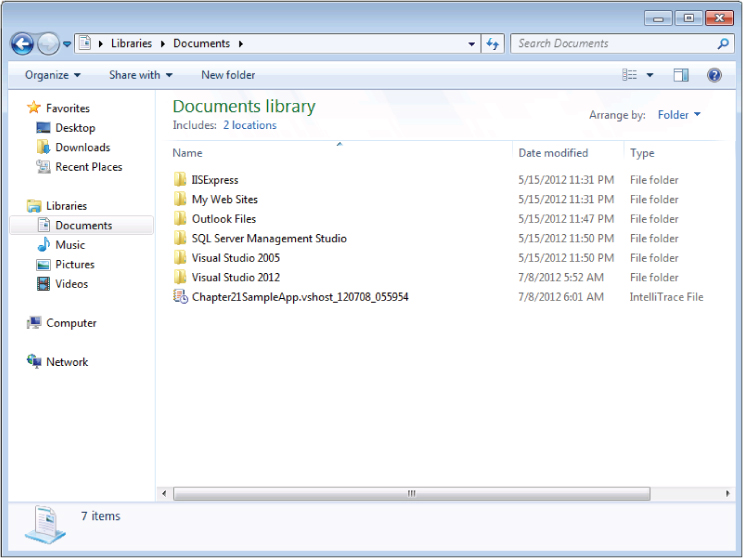
To do so, in Visual Studio, select Debug ⇒ IntelliTrace ⇒ Save IntelliTrace Session. This opens a Save As window, where you can choose to save your IntelliTrace session as a .iTrace file. By default, the file includes a timestamp.
Now generate a new IntelliTrace session, save the IntelliTrace session to a file, and then view the file:
You might expect the IntelliTrace file to be a simple XML file that you can open and view in a text editor, but that is not the case. Because of the amount of information gathered by IntelliTrace, the data is stored in a proprietary format to make it easier for Visual Studio to work with.
To open the IntelliTrace session file, simply double-click the session file, and it opens in Visual Studio (see Figure 21.9).
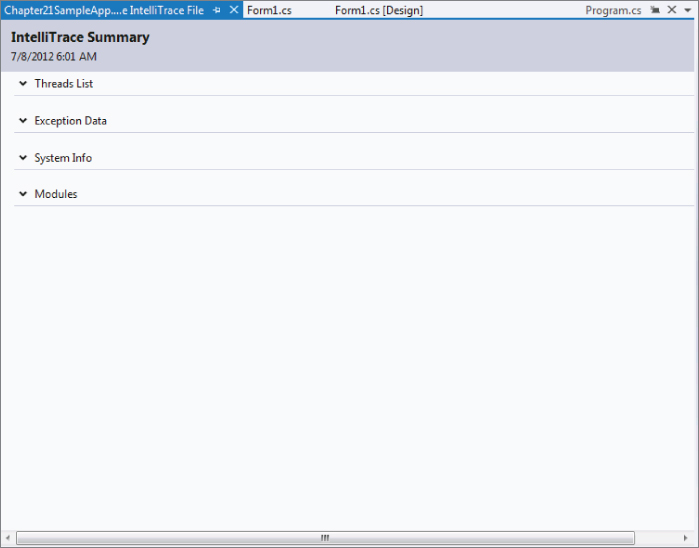
When you open a IntelliTrace session file, it initially displays the IntelliTrace summary screen. This summary screen can contain a good bit of initial information to help you understand the debugging session. In the following sections, you examine these sections out of order.
Threads List
The Threads List section displays detailed information about the threads, including their thread IDs, thread names, and the start and end time of each thread.
Modules
The Modules section shows you all the different modules (DLLs, executables, and so on) for which data was collected during the IntelliTrace collection process. Information displayed here includes the module name, the module path, and the module ID.
System Info
The System Info section contains detailed system information about the machine on which the IntelliTrace information was collected, as shown in Figure 21.10.
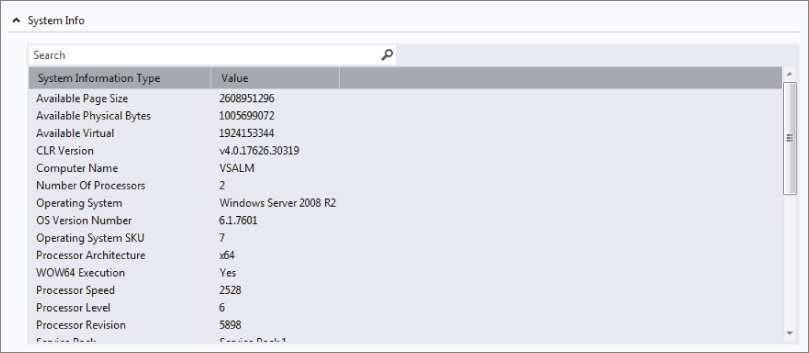
Information collected includes total system memory, type of operating system, and processor information, just to name a few values. Having this machine information at your fingertips can make it easier to understand why the application might be having issues on a particular type of machine.
Exception Data
If any exceptions were triggered during the IntelliTrace collection process, that information is displayed here, as shown in Figure 21.11.
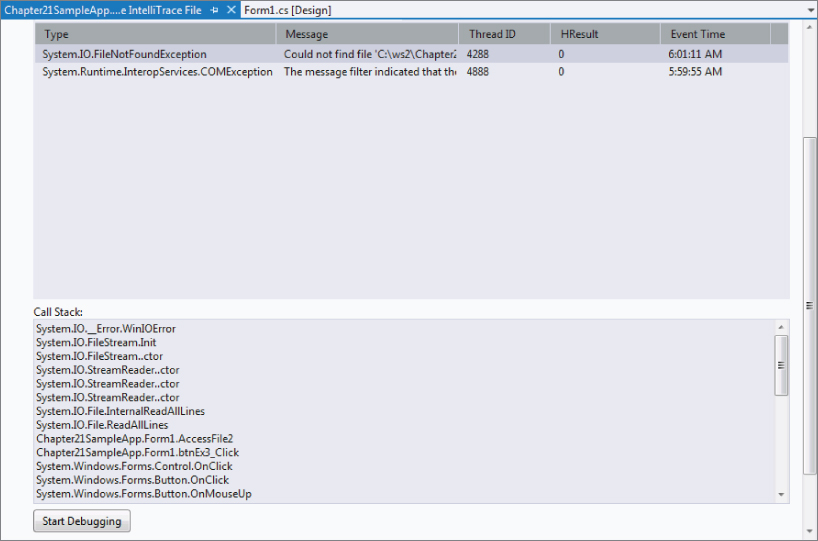
Select the System.IO.FileNotFoundException. The call stack for the exception is displayed, which shows you, in this case, that the Chapter21SampleApp.Form1.AccessFile2 method was triggered, and then several System.IO.File methods were triggered.
What is really interesting is that, when you select the exception, the Start Debugging button becomes enabled. Clicking the Start Debugging button actually puts Visual Studio into debug mode, navigates the IntelliTrace window to where the exception occurred, opens the code file associated with the exception, and navigates to the line of the file where the exception occurred (see Figure 21.12).
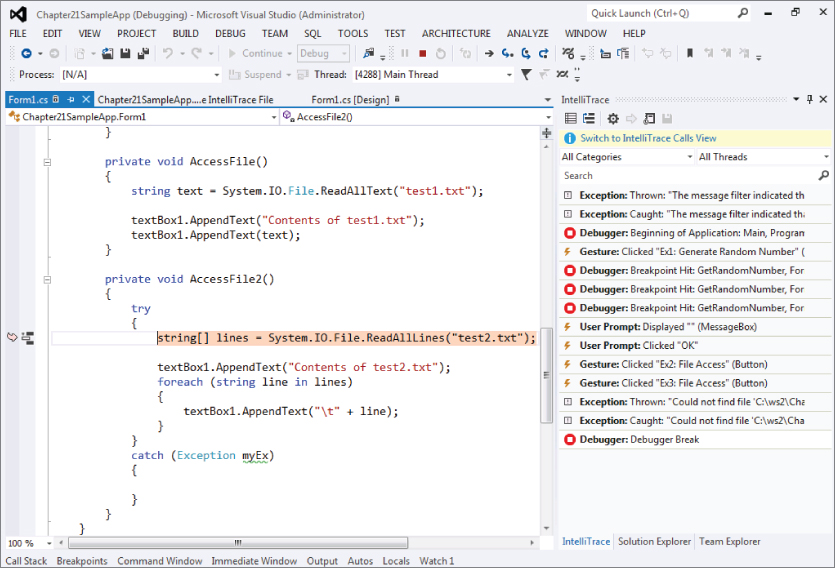
Notice that you are in full debugging mode, using the IntelliTrace file as the source information. As such, you only have access to the information that IntelliTrace collected. You can do anything that you would normally do when working with collected information, including view event information, navigate the call stack, and view variable information that was collected. Also, remember that the full solution has not been opened for you at this point, just the specific code file. This is to aid you in determining the root cause of the problem. After this is found, you should still open the entire solution before making the appropriate changes.
IntelliTrace Options
There are multiple options you can configure around IntelliTrace. Open the IntelliTrace settings window by clicking Debug ⇒ IntelliTrace ⇒ Open IntelliTrace Settings. The Visual Studio Options window displays, as shown in Figure 21.4.
You should notice the following four configuration sections within the IntelliTrace option node:
- General
- Advanced
- IntelliTrace Events
- Modules
Let's look at the configurations available in each of these sections.
General
You have already learned about this section earlier in this chapter, but it's worth reviewing here. In the General section, you can enable IntelliTrace by clicking the Enable IntelliTrace checkbox. With this checkbox you can enable (check) or disable (uncheck) IntelliTrace. In this window, you can also choose between the options to record events only or collect additional information that includes events, diagnostics, calls, and method level tracing. Of course, collecting more information means that a larger log file is generated. As you can see in the Options window shown in Figure 21.4, collecting more information has more of an impact on performance than merely collecting events.
Also, note that the Edit and Continue option is disabled with the latter option. The Options dialog prompts you with this warning when you change the setting.
Advanced
The Advanced option provides several settings. As shown in Figure 21.13, you can set the location to store the generated log file, and specify the maximum size that the log file should be. Remember, this is important, as the IntelliTrace log files can grow to a very large size.
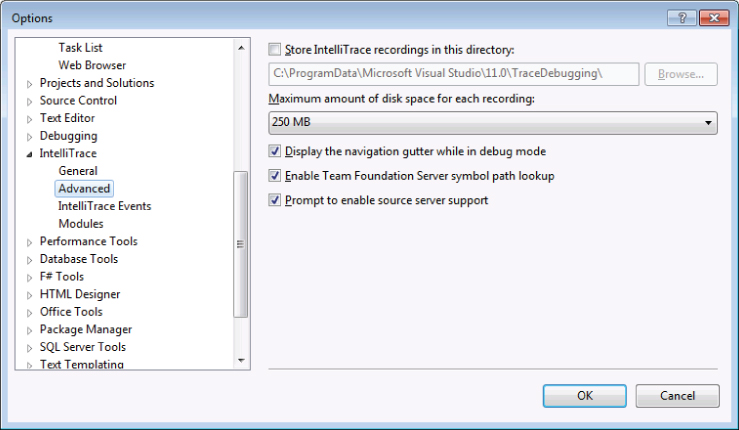
In addition, there are three checkboxes at the bottom of the screen:
- Display the Navigation Gutter while in Debug Mode
- Enable Team Foundation Server Symbol Path Lookup
- Prompt to Enable Source Server Support
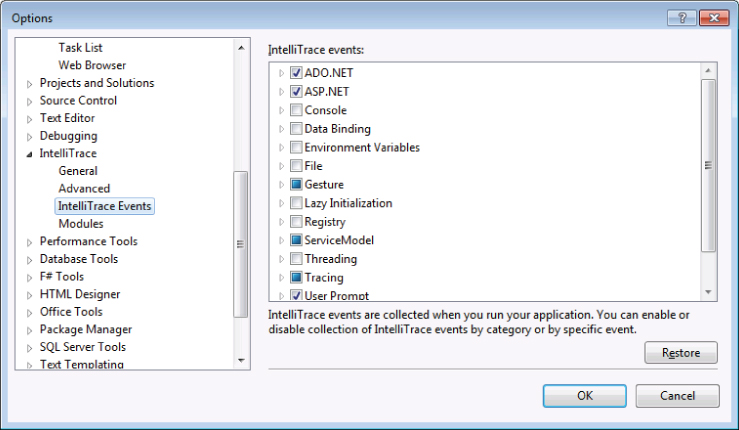
IntelliTrace Events
As shown in Figure 21.14, the IntelliTrace Events section lists all the diagnostic events that are collected while debugging an application. The list of events is broken down by framework categories. Here, you can select (that is, choose to collect) or deselect (choose not to collect) the diagnostic events shown on this list. This enables you to target your event collection to only the specific technologies you care about. By default, only a certain subset of events are collected.
Modules
As shown in Figure 21.15, this section enables you to manage the list of modules for which data is collected during debugging.
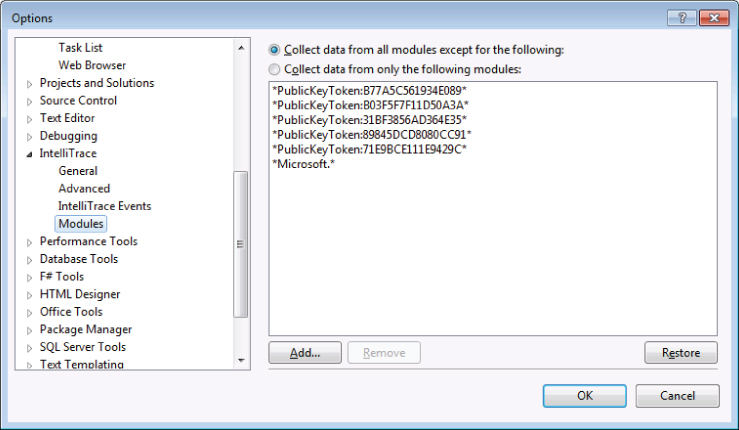
Here you can add new assemblies to collect debugging information, as well as exclude and remove assemblies for which you don't want to collect debugging information.
IntelliTrace in Production
With Visual Studio 2010, IntelliTrace could only be used in a test or development environment, required Visual Studio 2010 to be installed, and was not licensed for production use. Wouldn't it be nice, though, to be able to gather IntelliTrace information on an application when you're having troubles with it in a production environment? Think about it. Being able to generate an IntelliTrace file that you could then open in Visual Studio Ultimate 2012 and walk through the results as a standard debug scenario would be really powerful.
Microsoft thought so, too, because with Visual Studio 2012, Microsoft released a set of IntelliTrace standalone collection utilities that you can use to create IntelliTrace logs and gather other debugging information about production applications. You don't have to have Visual Studio 2012 installed on the machine being tested. The utilities themselves don't alter the computer they are put on, and removing the utilities is as simple as deleting a folder. This makes it easy to install and use these utilities on production web servers, as well as other computers.
Installing the IntelliTrace Stand-Alone Collector
To get started collecting IntelliTrace information in a production environment, you first need to install the IntelliTrace collector files on the machine in question. To do so, first create a folder on the machine, such as c:IntelliTrace. This folder is where you copy and run all the IntelliTrace collection files.
Next, you need to copy the IntelliTraceCollection.cab file to the c:IntelliTrace folder. You can find the IntelliTraceCollection.cab file in either of the following two places:
- Download it from the MSDN Download Center at http://aka.ms/IntelliTraceCab.
- Copy it from a machine that has Visual Studio Ultimate 2012. You can find the file at VSInstallDirectoryCommon7IDECommonExtensionsMicrosoftIntelliTrace11.0.0.
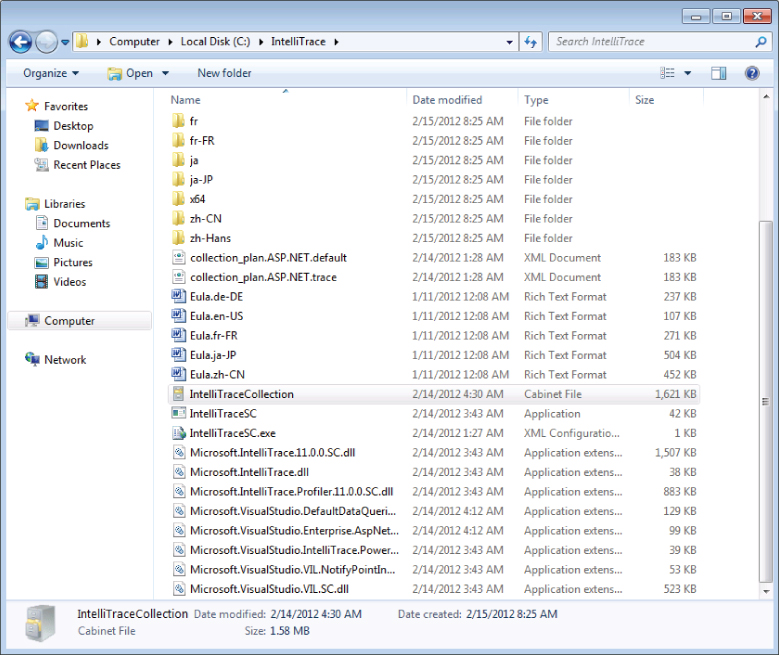
After you have copied the file to c:IntelliTrace, open a command prompt and navigate to that directory. You are going to use the Windows command expand.exe to extract the contents of the .cab file using the following syntax:
expand.exe IntelliTraceCollection.cab -F:*.* c:IntelliTrace
Figure 21.16 shows the c:IntelliTrace folder after the file has been expanded.
You can choose to collect the IntelliTrace logs in the same folder where you unpacked the .cab file, for example C:IntelliTrace, or you can store the log results to a different location when you run the collection. Wherever you decide to store the log files, though, if you are collecting data from a web application, you need to grant the application pool identities full access to the folder. This can be done using the following command:
icacls.exe c:IntelliTraceLogs /grant "IIS APPPOOLMyDefaultAppPool":(F)
The preceding line of code says to grant full rights to the folder c:IntelliTraceLogs for the application pool MyDefaultAppPool.
Configuring IntelliTrace PowerShell Commandlets
To collect IntelliTrace data in a production environment, PowerShell must be enabled on the machine doing the collecting. You need to open a PowerShell window as administrator (hold down the Shift key, right-click the PowerShell icon, and select Run As Administrator from the context menu).
In the PowerShell window, run the following command to load the PowerShell commandlets needed for IntelliTrace:
Import-Module c:IntelliTraceMicrosoft.VisualStudio.IntelliTrace.Powershell.dll
After running this command, you can run the following command to see the list of available IntelliTrace commands:
Get-Help *IntelliTrace*
There are five commandlets available:
- Checkpoint-IntelliTraceCollection — Creates a snapshot of an active IntelliTrace log
- Get-IntelliTraceFileInfo — Gets basic information about an IntelliTrace (.iTrace) log file
- Start-IntelliTraceCollection — Starts IntelliTrace collection on an IIS application pool
- Get-IntelliTraceCollectionStatus — Gets the status of all application pools on the current server
- Stop-IntelliTraceCollection — Stops IntelliTrace collection on an IIS Application pool
Collecting Execution Information
To start collecting IntelliTrace information on a web application, use the following syntax in the PowerShell window:
Start-IntelliTraceCollection AppPool CollectionPlan OutputPath
Where:
- AppPool — The name of the application pool for the web application
- CollectionPlan — The .xml file defines what information IntelliTrace collects
- OutputPath — The folder to which the IntelliTrace log file is written
The IntelliTrace collector contains two collection plan files:
- collection_plan.ASP.NET.default.xml — Collects IntelliTrace event information only
- collection_plan.ASP.NET.trace.xml — collects method calls and IntelliTrace events
After executing the preceding command, IntelliTrace is now running, gathering information about the web application and application pool. To find the current collection status, you can run the Get-IntelliTraceCollectionStatus Powershell commandlet.
As a best practice, you shouldn't leave IntelliTrace running any longer than is necessary. There is an overhead cost on the system being collected against, depending on the detail of information collected. However, if you want to examine the data that has been captured so far, without stopping the collection process, run the Checkpoint-IntelliTraceCollection commandlet. This makes a copy of the .iTrace file at that particular point in time. You can then open this file and analyze it in Visual Studio while IntelliTrace continues to gather information. When you are ready to stop gathering data, simply run the Stop-IntelliTraceCollection commandlet.
When you have the IntelliTrace .iTrace log file from the production system, you can open it in Visual Studio Ultimate 2012 and begin your analysis, as described earlier in this chapter.
Summary
This chapter introduced you to IntelliTrace and shows you how its debugging features can be used to “step back in time” while you're debugging an application. You learned how to utilize IntelliTrace at a basic level to examine events that are thrown during the debugging process. You saw how IntelliTrace lets you step forward and backward through the debugging process — with the ability to view variable and parameter information — without having to rerun your tests.
You found out how to configure IntelliTrace, to capture just event information or both event and method call information. You walked through the different configuration options, such as where to store IntelliTrace log files, and how to exclude certain assemblies from collection.
Finally, you read about a new feature of IntelliTrace in Visual Studio 2012: the ability to collect IntelliTrace data in a production environment. Using PowerShell commandlets, you can collect IntelliTrace log files against production web applications, making it much easier to debug production errors.
In Chapter 22, you are introduced to the testing capabilities in Visual Studio 2012. You find out about the various test types, diagnostic test adapters, and tools for working with tests. You also learn about working with test results, ordered tests, and the test settings.