
Chapter 22
Introduction to Software Testing
What's In This Chapter?
- Understanding the different types of tests supported by Visual Studio 2012
- Learning how to create and run tests within Visual Studio 2012
The next several chapters introduce the testing functionality supported by Visual Studio 2012. Visual Studio provides support for authoring a range of tests, all designed to help you identify bugs in your software before your users do.
One of the most substantial investments Microsoft made in Visual Studio 2010 was improved support for software testing, and they have continued to enhance that functionality with Visual Studio 2012. Microsoft has also focused considerably on better integration of those testing activities into the rest of the software development lifecycle, such as the handoff of detailed bug reports from a tester to a developer.
Perhaps the most notable addition to Visual Studio 2010 was the completely revamped support for authoring, executing, and managing manual tests. Manual testing — essentially just a form of testing that requires human input and validation — is usually performed by generalist testers, and is by far the most common type of testing conducted in the software development industry. Hence it became a natural extension of the Visual Studio family of products to support the generalist tester with better tools and testing frameworks. Manual testing is covered in detail in Chapter 23.
Visual Studio 2010 also introduced support for managing virtualized testing environments. This functionality — known as lab management — makes it possible to automatically spin up virtual machines for testing your software under a variety of configurations, known as a build-deploy-test workflow. With Visual Studio 2012, Microsoft has focused on making it easier to set up and configure these test lab environments and has also extended the out-of-the-box support to provide these workflows for physical (non-virtual) machines and third-party virtualization stacks. Lab Management is covered in greater detail in Chapter 26.
There are a host of other fit-and-finish improvements Microsoft has made to the software testing capabilities of Visual Studio 2012, many of which are covered in this section. The overhauled unit testing experience of Visual Studio 2012 is covered in-depth in Chapter 18, and is excluded from this section only because unit testing (despite the name) is not traditionally thought of as a software testing function.
Role-Based Testing Tools
The testing tools in Visual Studio 2012 are tailored for different testing-oriented roles generally found within software development and testing teams. Some individuals may perform more than one role, in which case a team member may use multiple tools.
- Visual Studio Test Professional 2012 — The Test Professional product is primarily targeted at generalist testers who will be authoring, executing, and managing manual tests. It includes the Microsoft Test Manager and Test Runner tools. These tools are introduced in more detail later in this chapter, and covered extensively in Chapter 23.
- Visual Studio Premium 2012 and Visual Studio Ultimate 2012 — The Premium and Ultimate editions of Visual Studio 2012 include functionality that is designed for specialist testers. A specialist tester is usually a software developer who focuses on writing software that is responsible for testing other software. Examples of duties that this role might perform include authoring tests that simulate large-scale load against a Web application, or converting manual test cases into automated tests that can be run without requiring human intervention. Visual Studio Premium 2012 includes the capabilities to write coded user interface (UI) tests. Visual Studio Ultimate 2012 includes all of the functionality from Premium, in addition to the capability to author web performance tests and load tests. Both Premium and Ultimate also include the functionality found in Visual Studio Test Professional 2012.
You learn about the aforementioned test types next. For now, it is just important to know that testers who focus on manual testing can likely purchase the less-expensive Test Professional product, whereas testers responsible for developing automated tests should look into either Premium or Ultimate. Team members responsible for managing and monitoring test plans (for example, test leads) may also use the Test Professional product to do so.
Note that Visual Studio Professional, Premium, and Ultimate include the capability to author unit tests (see Chapter 18), as well as generic tests and ordered tests (covered later in this chapter). For more information on the overall Visual Studio 2012 family of products, see Chapter 1.
Types of Tests
Visual Studio 2012 provides support for authoring and executing a variety of test types, each with its own purpose for testing your applications. A successful test plan likely includes a mix of multiple types of tests from the following list:
- Manual test — A manual test simply requires a human to interact with an application, verify some expected result, and report on whether or not a test was successful. As you see in Chapter 23, a manual test is the only type of test that is represented as a Visual Studio Team Foundation Server 2012 work item (a test case), instead of as a source code file. Manual tests are covered in detail in Chapter 23.
- Coded UI test — A coded UI test provides the capability to author tests that automatically interact with the user interface of an application, verify some expected result, and file bugs if an error is encountered. Because this whole process is automatic, it can be run very frequently, and without human interaction, but it is typically more expensive to author and maintain than a manual test would be. Coded UI tests are detailed in Chapter 24.
- Unit tests — These are low-level tests verifying that target application code functions as the developer expects. Unit tests are essentially code that tests other code. Unit testing is described in detail in Chapter 18.
- Web performance test — A web performance test is used to verify functionality or performance of a web application. For example, you may create a web performance test to verify that a user can create a new account on your site. This web performance test could be one of a suite of web performance tests that you run periodically to verify that your website is working as you expect. For more information on web performance tests, see Chapter 25.
- Load tests — These tests verify that a target application performs and scales as necessary. A target system is stressed by repeatedly executing a variety of tests. Visual Studio records details of the target system's performance and automatically generates reports from the data. Load tests are frequently based on sets of web performance tests. However, even non-web applications can be tested by selecting a number of unit tests to execute. For more information, see Chapter 25.
- Generic tests — These tests enable calling of alternative external testing systems, such as an existing suite of tests leveraging a third-party testing package. Results of those tests can be automatically parsed to determine success. This could range from something as simple as the result code from a console application to parsing the XML document exported from an external testing package. You can find more information on working with generic tests in the product documentation at http://aka.ms/GenericTests.
- Ordered tests — Essentially containers of other tests, these tests establish a specific order in which tests are executed, and enable the same test to be included more than once. For details, see the section “Using Ordered Tests,” later in this chapter.
Sometimes, you can use more than one test to verify that a given piece of an application is behaving correctly. For example, both coded UI tests and web performance tests can be used to verify the functionality of a web application. But, as you become more familiar with coded UI tests versus web performance tests, you will see that the former is better suited for validating functionality and UI layout, whereas the latter is better suited for checking performance and scalability (when used within a load test). You get a better sense of which test to use in different situations in the detailed chapters for each test type.
Diagnostic Data Adapters
A key challenge with software testing is that of providing developers with enough information about a failing test so that the developer can adequately debug and fix the problem. How often have you seen bugs get resolved as No Repro because a developer wasn't able to reproduce a bug discovered by a tester? Unfortunately, the phrase “It works on my machine” has become an all-too-common part of the software development pop culture.
One of the major ways in which Microsoft is attempting to eliminate the No Repro problem in this release of Visual Studio is with diagnostic data adapters. A diagnostic data adapter is responsible for collecting information about one or more machines under test. You can attach the information collected from these diagnostic data adapters to a bug, providing the developer with a rich amount of information with which to diagnose a problem.
Visual Studio 2012 ships with several diagnostic data adapters that can be enabled during test runs, including the following:
- Action log — This adapter is useful for manual tests. It can capture a log of exactly what steps testers took when they encountered a bug. For example, a developer studying the action log can determine that a tester clicked the Username textbox, typed “Brian,” and then pressed the Enter key. A developer no longer has to guess about what testers were doing when they encountered a bug. Action logs can also be used as action recordings, which testers can use to fast-forward pieces of a manual test during subsequent test runs (see Chapter 23). The action recordings can even be used to automate a manual test by turning it into a coded UI test (see Chapter 24).
- ASP.NET Profiler — This data adapter can be used on remote machines when conducting a load test. It provides granular profiling information about an ASP.NET application, which can be used to more accurately diagnose performance bottlenecks. This data diagnostic adapter is available for use only with ASP.NET load tests.
- Code coverage — Code-coverage information can be used to determine which code paths are executed during an automated test. This can be analyzed later to determine if there are sections of code that are not being touched by your test plan, possibly indicating that additional test coverage is necessary. Code coverage is only available for automated tests, not for manual tests.
- IntelliTrace — IntelliTrace is a powerful way of capturing granular debugging information about a .NET application being tested. This information can then be loaded into Visual Studio Ultimate 2012 by a developer to analyze exactly what was happening when a bug was encountered. For more information about working with IntelliTrace, see Chapter 21.
- Event log — This adapter can capture events that were written to the Windows event log while a test was executing.
- System information — This adapter gathers system information and attaches it to a bug. Now a developer no longer has to guess about the operating system version, 32- versus 64-bit, how much RAM, what version of browser, or other such critical information about the machines involved in a test run.
- Test impact — Test impact analysis analyzes which blocks of code are exercised by your tests. You can later use this data can to help determine which tests need to be rerun based on which blocks of code were changed in your application since the last time those tests were run. Test impact analysis can, therefore, help your generalist testers focus on running the most important tests, based on which pieces of your application are churning. You explore the benefits of test impact analysis with manual testing in Chapter 23.
- Video recorder — The video recorder data adapter captures a recording of an application under test. This recording can help a developer diagnose problems with an application's UI and can be used with both manual and automated tests (such as a coded UI test). Starting with Visual Studio 2012, audio can also be enabled with video recordings. Audio can be enabled for automated tests, but it is most useful for manual tests so that testers can dictate comments while they are testing applications.
You can also use a diagnostic data adapter to impact a machine during a test. Visual Studio 2012 ships with one such adapter:
- Network emulation — The network emulation data adapter doesn't collect any data. Instead you can use it to force a machine into behaving as if it had a slower network connection. For example, you may want to simulate the experience that users in remote locations have when connecting to your corporate network over a 56 K modem link.
You can also create your own custom diagnostic data adapters. For example, you might be interested in capturing inbound network traffic on a given port that may be relevant to the behavior of your application. Or, you might want to author a custom adapter that impacts a machine, such as by rapidly reading from and writing to the hard disk in order to simulate heavy hard disk activity during a test. For information on creating a custom diagnostic data adapter, see the product documentation topic “Creating a Diagnostic Data Adapter to Collect Custom Data or Impact a Test System” at http://aka.ms/CustomDDA.
Using the right set of adapters can dramatically reduce the amount of time required to diagnose and solve a failing test and can also reduce the back-and-forth communication required between a developer and a tester. You discover how to configure diagnostic data adapters for manual tests in Chapter 23. Configuring diagnostic data adapters for automated tests within Visual Studio is covered later in this chapter, in the section titled “Test Settings.”
Microsoft Test Manager
Microsoft Test Manager provides a single environment from which to author and manage test cases, manage test plans, and define and manage your physical and virtual test environments (if using Lab Management). Figure 22.1 shows a typical view within Microsoft Test Manager.
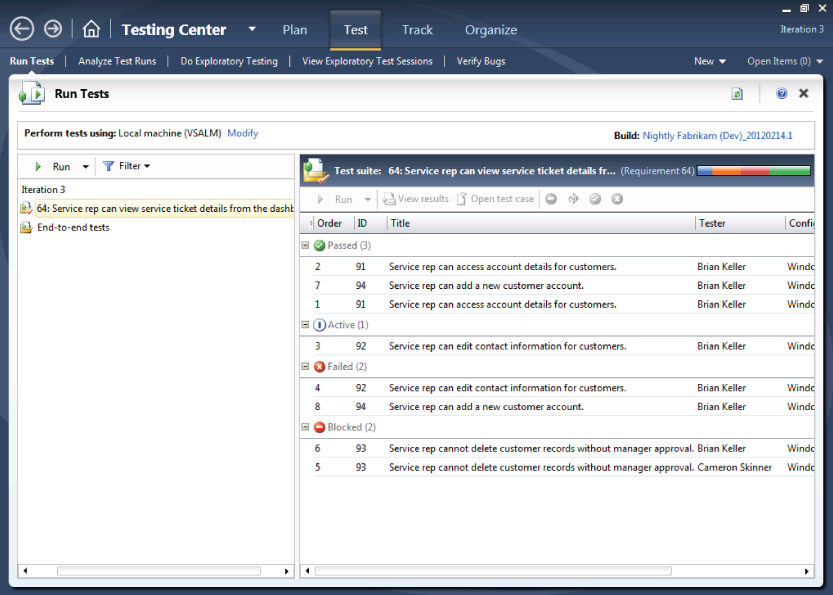
You become familiar with using Microsoft Test Manager in Chapters 23 and 26.
Managing Automated Tests with Visual Studio
With the exception of manual tests (which are represented as work items within Team Foundation Server), all other test types within Visual Studio are stored as source code files. These tests are usually authored with Visual Studio, stored within source control (such as Team Foundation Server, although this is not a requirement), and are tracked as essential artifacts of your development project. As your project grows, so should the suite of tests you write, which can help you verify the expanded functionality of your software.
Because these tests are so critical to project success, it is not uncommon for projects to have dozens, sometimes even hundreds or thousands, of tests.
In the rest of this chapter, you begin by learning about test projects, a special project type that you can use to contain your automated tests. You learn about the creation of test projects and test settings files.
Then, you discover the Test Explorer window, how to organize and run your tests, and how to view the results. Finally, you're introduced to an additional test type called an ordered test. Ordered tests are essentially containers of other tests, offering a convenient way to group and execute tests in a specified order.
Test Project Types
Visual Studio 2012 provides test project templates for the type of test you want to work with. This is slightly different from the one-size-fits-all Test Project template provided with earlier versions of Visual Studio.
However, even if you select one type of test project you can add other types of tests to this project later on. You can even delete the original tests provided with each template to create, in essence, an empty test project.
Creating a Test Project
To create a new test project within Visual Studio you can right-click an existing solution and choose Add ⇒ New Project. You may also use the File menu by selecting Add ⇒ New Project. You see the Add New Project dialog, as shown in Figure 22.2.

Under Installed Templates, choose the Test category under the language you want to use for your tests (either Visual Basic, Visual C#, or C++). Select the type of test project you want to create. Your list of available test project types will vary based on the edition of Visual Studio 2012 you have, as discussed earlier in this chapter. If you do not already have a solution, you can create one here.
When your test project is created, Visual Studio creates a default test within the project folder. You can add new tests to this project by right-clicking your project, selecting Add, and then selecting the type of test you want to add.
Test Explorer
Test Explorer is the primary window in Visual Studio 2012 for viewing tests, running tests, and analyzing test results. Open Test Explorer in Visual Studio by clicking Test ⇒ Windows ⇒ Test Explorer. Tests are only displayed here after you have built your solution for the first time after opening Visual Studio.
If you have tests within your solution, click Build ⇒ Build Solution. Visual Studio builds your solution and looks for any tests that it understands how to run. If you have third-party test types within your solution (such as nUnit or xUnit.net) you need to have the appropriate test adapter installed in order for those tests to show up in this list.
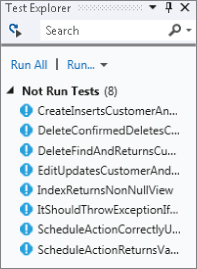
Figure 22.3 shows a list of tests in Test Explorer. The ! icon indicates that these tests have not yet been run. There are a few ways to run tests:
- You can click the Run All button to run all of the tests in this list.
- You can select individual tests (Ctrl+click, or select a range of tests by holding Shift and clicking the beginning and ends of the range of tests). After you have selected the tests you want to run, right-click a test within this range and select Run Selected Tests.
- You can run tests with the debugger enabled by right-clicking a test (or a range of tests) and selecting Debug Selected Tests. This runs your tests in a debugging mode, which enables you to set breakpoints in your tests or break execution if there is a problem with your test code.
- Click the Run button to select additional options, such as running only the tests that failed the last time they were run.
You can also configure your tests to run automatically after most builds by enabling the upper-left button in Test Explorer (the play icon with a curved arrow pointing at it). This runs your tests after almost every build of your solution. Certain cases, like starting your project with or without debugging, do not trigger your tests to run automatically.
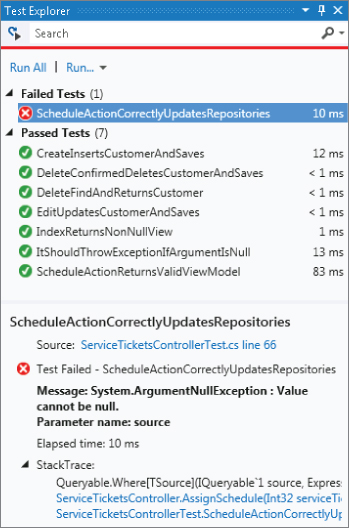
After you run your tests you see your test results in the same window, as shown in Figure 22.4. If any tests have failed, you can get additional details about the failure in the lower portion of this window. This enables you to click into the code for your test and for the application being tested.
You can right-click a failing test from within Test Explorer and select Copy to copy the results for this test to your clipboard. This can be helpful if you want to create a bug from this information. If you are filing a bug, you may also want to attach the results of any Diagnostic Data Adapters you have enabled within your test settings. You can find these by right-clicking your solution within Solution Explorer and clicking Open Folder in Windows Explorer. The output of your test settings are in the TestResults folder.
You can also use the Search box within Test Explorer to narrow down the list of tests you want to run. This is especially helpful if you have a lot of tests in your solution.
You can search by test name, or use special search operators:
- FilePath — Enables you to search for tests based on a specific file path. For example, FilePath:FabrikamFiber.Extranet.Web returns tests in the FabrikamFiber.Extranet.Web folder within your solution.
- FullName — Enables you to scope based on the fully qualified name of a test. For example, FullName:FabrikamFiber.Extranet.Web.Controllers returns just test methods in that class.
- Result — Enables you to scope your results by the status of your tests. For example, Result:Failed returns only tests that failed the last time they were run.
- You can also use multiple operators, such as FilePath:FabirkamFiber.Extranet.Web Result:Failed, which returns only failing tests in this folder.
After you run a search you can click Run All to run just the tests in that search result.
Code Coverage
Code coverage is a technique that enables a developer to see exactly which lines are run when automated tests are run. This can be a helpful technique when determining whether or not your suite of automated tests is fully exercising your code.
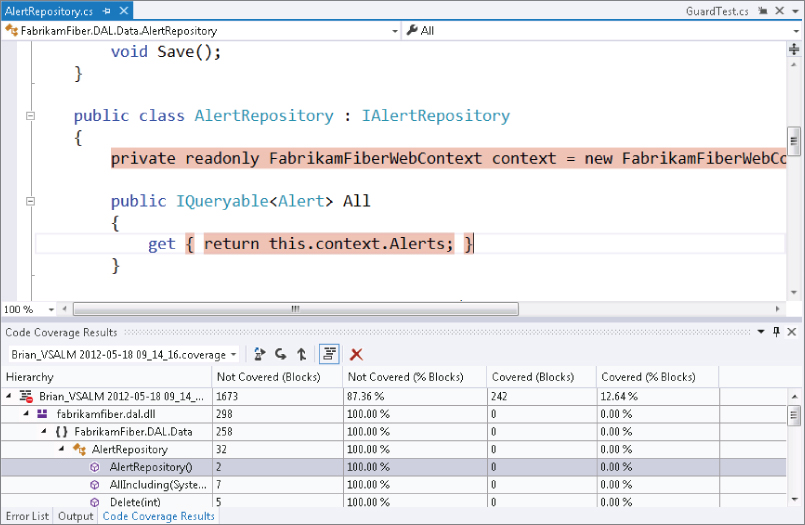
To view code coverage data, click Test ⇒ Analyze Code Coverage ⇒ All Tests. The Code Coverage Results view shown in Figure 22.5 enables you to view your solution's binaries based on the percentage of code that was covered by your tests. You can expand a binary (such as a DLL) to view namespaces, classes, and function calls. Double-click a function to view the relevant code in the editor. You can click Show Code Coverage Coloring within the toolbar of the Code Coverage Results view to colorize the code within your solution. Red coloring indicates code that was not exercised by your tests and that you might want to consider writing additional tests for.
Using Ordered Tests
Sometimes you need to control the order in which tests run. Another type of test that Visual Studio supports is the ordered test. An ordered test is simply composed of other logically related tests. You can add one or more tests as members of an ordered test. You can also arrange those tests to execute in a specific sequence. In addition, you can add the same test to an ordered test multiple times.
Being able to specify the order of test execution (as well as including a test more than once) has a variety of applications. For example, you may have a Create User test that, after execution, adds a new user to your database. Your next test, Log User In, may rely on the existence of that new user. By ordering your tests, you ensure that the first test successfully creates the user before the second test attempts to log in that user.
Creating an Ordered Test
An ordered test is simply another type of test, so you create ordered tests much the same way as other tests. Right-click your test project and select Add ⇒ Ordered Test. You see the Ordered Test Editor, as shown in Figure 22.6.
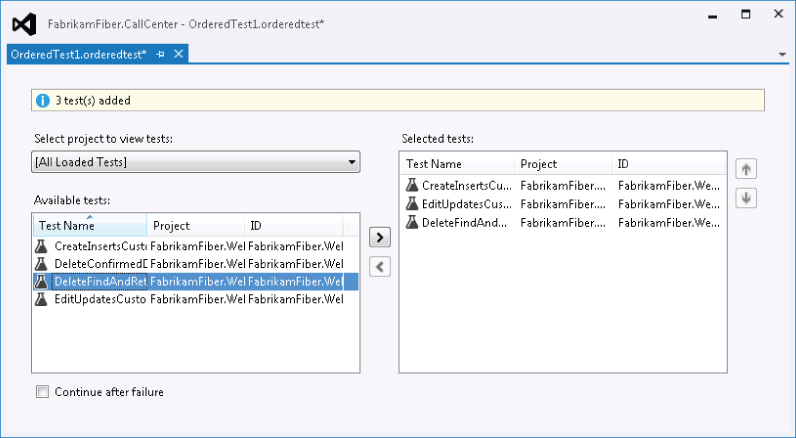
Using the right and left arrow buttons, add one or more of the tests to the ordered test. The list of tests includes the tests from all projects in the current solution. You can add multiple tests at the same time by holding the Ctrl key while clicking each test. As mentioned before, the same test can be added more than once.
You may order the execution of the contained tests by adjusting their positions with the up and down arrow buttons. The test at the top of the list is executed first, proceeding sequentially down the list.
One of the key features of an ordered test is that tests run one at a time in a specified sequence. Using the Continue After Failure checkbox, you can indicate whether the ordered test continues to process remaining tests if a test fails. By default, this is unchecked, indicating that the ordered test aborts when any test fails. Check the box to cause the ordered test to always execute all contained tests, regardless of success.
An ordered test is executed just like other tests. You can run an ordered test from the Test Explorer window.
When you execute an ordered test, the Test Explorer window activates, displaying progress as the test is executing and results when the test is complete.
Test Settings
Test settings provide a way of defining how tests are executed within Visual Studio. Such settings include timeout values, remote execution settings, and the diagnostic data adapters you want to enable (see “Diagnostic Data Adapters,” earlier in this chapter).
Depending on the type of test project you created, you may also have a default test settings file added to your solution under the Solution Items folder. Test settings files have an extension of .testsettings. You can double-click these files to display those settings.
By default, most test projects do not have a test settings file. Only the web performance and load test project templates include test settings files by default. If you created another test type that did not include a test settings file, you can choose to add one by right-clicking the solution and selecting Add ⇒ New Item ⇒ Test Settings.
You can maintain multiple test settings files and switch among them based on the type of testing you want to conduct. Click Test ⇒ Test Settings to set the test setting that you want to use. The first time you add a test settings file to your solution you need to click Test ⇒ Test Settings ⇒ Select Test Settings File to add it to this list.
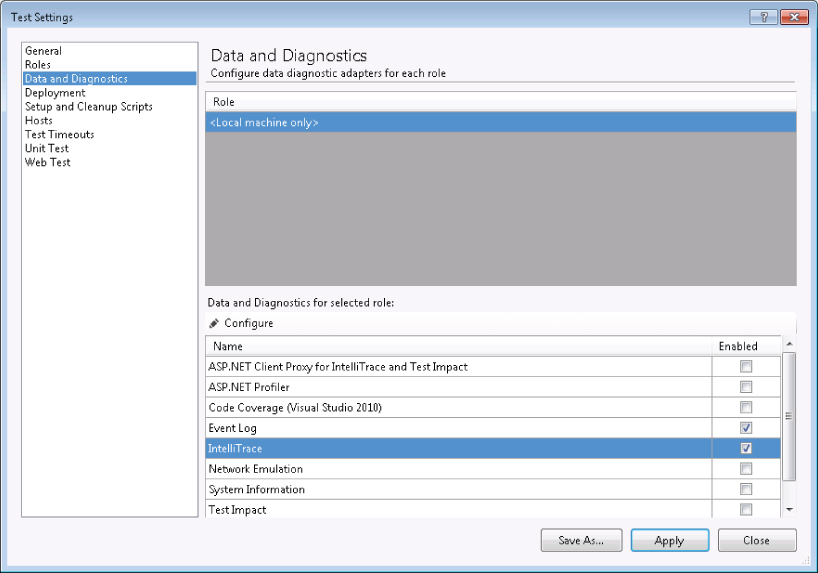
The default test setting is designed to run with minimal overhead, but it does not collect any diagnostic data. The Trace and Test Impact test setting enables the System information, Trace Impact, and IntelliTrace data adapters. Consider using the Local test setting for everyday testing, and switch to the Trace and Test Impact test setting if you need to file a bug from test results. This way, additional diagnostic data is available, along with the bug you are filing.
You can edit test settings files by double-clicking them in Solution Explorer. This opens the Test Settings editor shown in Figure 22.7. The Data and Diagnostics tab enables you to declare which diagnostics data adapters should be enabled. You can use the Configure button to set advanced properties for some of the adapters.
You can also configure test settings to collect data from remote machines that are part of your test environment. For example, you might be running a test locally that makes a call to an application running on a remote web server. You can configure Visual Studio to collect data from both the local and remote machines by installing a Test Agent on the remote machine(s), and connecting these to a Test Controller. Then, use the Roles tab within the test settings editor. You learn more about configuring Test Controllers and Test Agents in Chapter 25.
Take some time to explore the rest of the tabs within the Test Settings editor. There are several settings in here that can affect the ways in which your tests run, such as setup and clean up scripts (which can run before and after your test runs) and timeout values, which can be used to control what happens if your tests are taking too long to run.
Summary
This chapter covered details about testing in Visual Studio 2012. You learned about the various types of tests, diagnostic data adapters, and tools for working with tests. You learned about test projects and how to add other tests and test settings files to test projects.
You then learned about the Test Explorer window and how to organize, run, and troubleshoot tests using this view. You discovered how code coverage data can be used to analyze which lines of code were exercised by your automated tests.
You learned about how to use ordered tests to group other tests together to be run as a unit. Contained tests are executed in a specified order, and you can optionally indicate that you want the test to abort when any test fails.
You found out about the important role that test settings play in determining how tests are run, and which data gets collected during test runs.
The details covered in this chapter should prepare you to effectively manage and orchestrate the testing of your Visual Studio projects. Whether your project has just a few or many hundreds of tests, using the tools and techniques described in this chapter will help you to achieve success.
In Chapter 23, you learn how generalist testers can benefit by using Microsoft Test Manager to work with test plans; to author, organize, and run test cases; and to file rich, actionable bugs that developers can use to quickly understand the root cause of issues.