
Chapter 9
Real-World WLAN Mobility
Given its importance within the realm of short-range wireless technologies, WLAN performance has been carefully investigated in the literature. In particular, since it is relatively easy to trace AP activity in terms of number of registered users, traffic load, etc., collection of real-world data traces and their analysis have become a common methodology in WLAN performance evaluation.
In this chapter, after briefly describing the main features of the WLAN traces available in the literature (most typically through the CRAWDAD website), and the typical methodologies followed by researchers to collect, post-process, and analyze these traces, we will present the main features of a WLAN that concern the mobility of users. These features have been used in the literature to guide the design of trace-based mobility models, whose purpose is to faithfully mimic user mobility behavior observed in WLAN traces.
9.1 Real-World WLAN Traces
As commented above, tracing user behavior in a WLAN environment is a relatively simple task: since APs typically have a direct connection to a wired network (e.g., the campus or corporate network), and users need to be registered with an AP in order to use WLAN services, instructing APs to periodically report information such as number of registered users, their IDs, traffic load, etc., is relatively simple. As we will see, much more cumbersome is the task of post-processing and analyzing the possibly massive amount of logging data generated.
Three types of WLAN environments have prominently been traced in the research literature:
WLAN traces are collected by instructing the APs to report information to a central server connected through the wired network interface. Typically, SNMP, TCPDump, or syslog traces, or combinations of them, are collected by the central server. These traces contain, among other things, information about the MAC address of registered users, thus allowing univocal identification of a user—indeed, a device—within the network. Other collected information is the time when a user associated and de-associated (in case explicit de-association procedures are part of the WLAN setting at hand) with an AP.
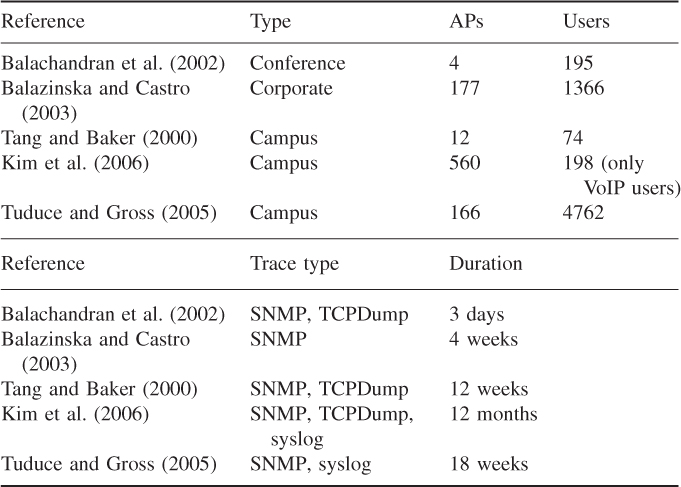
The features of the real-world WLAN traces mentioned above are summarized in Table 9.1. In the table, collected traces vary from very small WLANs with relatively few users to very large WLANs with a few thousand users. Also, the timespan of the collected traces varies from three days to one year.
Table 9.1 Main features of some real-world WLAN traces
A significant amount of post-processing is needed to make the traces suitable for further analysis. Typically, post-processing is needed to identify all users registered in the traces, and to determine user activity patterns for each of them. For instance, user activity and inactivity periods are identified, where a user is assumed to be active if the user is registered with an AP and sending/receiving traffic in a suitably defined time period. General statistics about user activities are obtained, possibly categorizing users based on the type of application-layer traffic sent/received. This allows the possible inclusion/exclusion of a fraction of the users from the data trace based on predefined criteria. For instance, Kim et al. (2006) focused their analysis only on data referring to VoIP users. Similarly, users displaying only a minimal amount of activity (i.e., users active for at least a fixed percentage of the overall trace duration) can be retained in the analysis, and so on. Finally, periods of time during which very low user activity is registered (e.g., night-time) might be filtered out from the traces in order to focus the analysis on periods of intense network usage.
Another important step in the trace post-processing phase is clearly identifying the transitions of a specific user between different APs. In fact, due to many factors such as AP congestion level, varying radio signal quality, etc., a user's association with an AP can repeatedly change even if the user is not moving. These kinds of repeated association and de-association with nearby APs are called ping-pong transitions and should be filtered out from the trace since they are not related to the mobility of users. Techniques for detecting and removing ping-pong transitions from WLAN traces will be described in the next chapter.
Finally, an important post-processing step which is necessary prior to making collected traces publicly available is anonymization, which essentially consists of decoupling user identities from the MAC addresses of WLAN devices. This step is fundamental to preserve user privacy, which must be maintained even if the users being traced are informed about the tracing experiment.
9.2 Features of WLAN Mobility
Due to the network architecture, and to the features of the collected traces, mobility in WLAN environments is typically characterized in terms of user association patterns with the different APs in the network. Thus, mobility is not explicitly characterized in terms of location and trajectory of a mobile user (a notable exception to this is the mobility characterization of VoIP users performed by Kim et al. (2006)), rather it is implicitly characterized through the analysis of migration patterns between APs in the network. The implicit assumption is that, if a user changes her/his association from an AP A to another AP B, that user has changed her/his position. It is important to observe that this assumption is not necessarily true: as we commented at the end of the previous section, due to ping-pong transitions a change in AP association is not necessarily caused by a user's physical movement. However, after ping-pong transitions have been filtered out, the assumption “change in AP association = user physical movement” is reasonably accurate in practice.
Another important observation about WLAN user mobility is that it is often discontinuous in the time domain. In other words, a user can be associated with an AP A at time t1, then de-associate from A, and later on (at time t2 ![]() t1) “reappear” in the network associated with a different AP, say B. This mobility pattern is very common, for example, in a campus network, where students move from, say, dormitory to classrooms, and turn off their laptops while moving from one location to the other.
t1) “reappear” in the network associated with a different AP, say B. This mobility pattern is very common, for example, in a campus network, where students move from, say, dormitory to classrooms, and turn off their laptops while moving from one location to the other.
To avoid possible problems or difficulties in the trace analysis phase due to time-discontinuous mobility, an artificial AP modeling the OFF state—corresponding to a user's inactivity status—is introduced in the model. The time-discontinuous mobility pattern described above can then be turned into a time-continuous mobility pattern by adding a transition between AP A and the OFF state at time t1, and a transition from the OFF state to AP B at time t2.
The most relevant WLAN mobility features analyzed in the literature are the following:
The three metrics above, if suitably combined, allow a thorough characterization of user mobility patterns, for instance, categorizing users as highly mobile (users with low prevalence values, short session duration, and a large number of visited APs), moderately mobile, and almost stationary (users with a few, relatively high prevalence values, long session duration, and small number of visited APs).
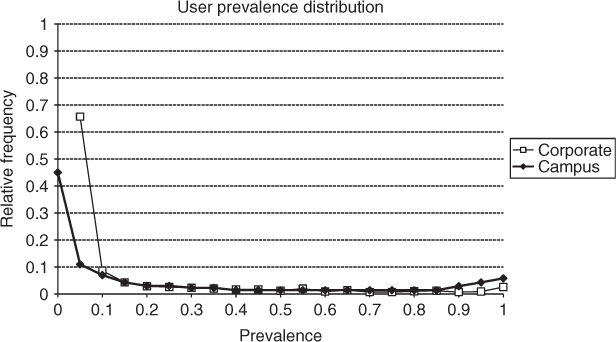
User prevalence and prevalence distribution have been shown to have relatively stable patterns in both campus and corporate WLANs. Figure 9.1 shows the user prevalence distributions obtained from the traces in Balazinska and Castro (2003) and Tuduce and Gross (2005), which are indeed very similar. The shape of the distribution clearly indicates a bimodal distribution, with a higher concentration around very small prevalence values, and a lesser, yet noticeable, concentration around very large prevalence values. This shape of the distribution seems to indicate that users spend most of the time in one or a few APs (giving rise to the low peak of the distribution around prevalence values greater than or equal to 0.9), while they visit other APs only for a very short time (giving rise to the high peak of the distribution around prevalence values less than or equal to 0.2).
Figure 9.1 User prevalence distribution of traces collected by Balazinska and Castro (2003) (corporate) and Tuduce and Gross (2005) (campus).
The session duration distributions of four different mobility traces in both corporate and campus WLANs are shown in Figure 9.2. More specifically, the figure reports two plots derived from the corporate trace collected by Balazinska and Castro (2003), and two portions of the trace collected on the ETH campus reported in Tuduce and Gross (2005). The two corporate traces distinguish between user behavior when a user is located in her/his home building—defined as the building in which the user spends most of the time—or is a guest in other buildings.
Figure 9.2 Session duration distribution of traces collected by Balazinska and Castro (2003) (corporate) and Tuduce and Gross (2005) (ETH). The x- and y-axes are in logarithmic scale.
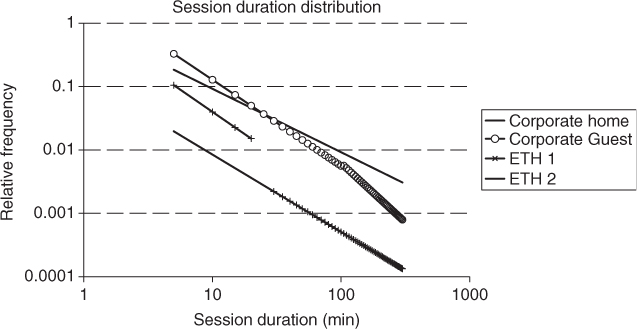
The plots clearly show that, independently of the environment and the specific trace, the session duration distribution obeys a power law (corresponding to a line in log–log scale). The only difference between the four plots is in the inclination of the line, corresponding to the exponent of the power law. The analysis of the session duration distribution indicates that the vast majority of sessions are very short (20 minutes or less), but there exists a relatively fat tail of long, or even very long, sessions (up to a few hours). It is also interesting to compare the session distribution in the corporate home and guest configuration. In the former case, sessions tend to be longer than in the guest configuration, hinting that users tend to be relatively stationary when they are in the home location and relatively more mobile when roaming outside.
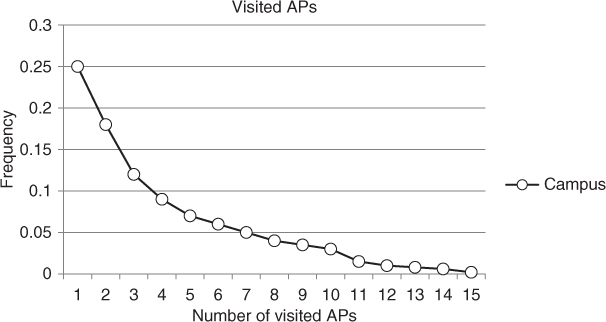
The distribution of the number of visited APs in a portion of the ETH trace collected by Tuduce and Gross (2005) is shown in Figure 9.3. Careful observation of the distribution reveals that the majority of users visit only up to three APs, but only a few users visit more than ten APs. Similar conclusions can be drawn from an analysis of the corporate trace reported in Balazinska and Castro (2003). Thus, we can conclude that the degree of mobility in a WLAN is very limited, considering that traces are collected over a relatively long period of time. The reader, however, has to bear in mind that WLAN traces do not allow continuous tracking of a user's position over a period of time, but just a user AP association pattern. Hence, the above conclusion on user mobility does not imply that WLAN users have a limited degree of physical mobility, rather that when they access the WLAN, they tend to have a relatively repetitive association pattern exploiting only a minimal part of the APs available in the network.
Figure 9.3 Distribution of the number of visited APs in a portion of the trace collected by Tuduce and Gross (2005) (campus).
Balachandran A, Voelker G, Bahl P and Rangan PV 2002 Characterizing user behavior and network performance in a public wireless LAN. Proceedings of ACM Sigmetrics, pp. 195–205.
Balazinska M and Castro P 2003 Characterizing mobility and network usage in a corporate wireless local-area network. Proceedings of ACM MobiSys.
Kim M, Kotz D and Kim S 2006 Extracting a mobility model from real user traces. Proceedings of IEEE Infocom.
Tang D and Baker M 2000 Analysis of a local-area wireless network. Proceedings of ACM Mobicom, pp. 1–10.
Tuduce C and Gross T 2005 A mobility model based on WLAN traces and its validation. Proceedings of IEEE Infocom, pp. 664–674.