
3.3 Modeling Without Parameter Tuning: A Case Study of Metabolic Networks
In the previous section, we introduced a simple model for reproducing several structural properties observed in real-world biological networks. Furthermore, this model network shows good qualitative and quantitative agreement with real data.
For model fitting, we need to tune model parameters. The parameters may be estimated by minimizing the difference between the model and real data using statistical methods. However, the optimal solutions may require substantial calculation, after which multiple optimal solutions may be obtained. Furthermore, the possibility of trivial agreements (e.g., over-fittings) may remain if the model has several tunable parameters.
In order to avoid this problem, we need to eliminate parameter tunings and construct models in which parameters are determined from observable statistics obtained from real-network data, such as the number of nodes.
In this chapter, we focus on metabolic networks and introduce a network model without parameter tuning.
3.3.1 Network Model
Here, we consider metabolic networks in which nodes and edges represent metabolites and metabolic reactions (substrate–product relationships based on atomic tracing [26]) and propose a simple model that reproduces the structural properties of metabolic networks with two parameters, p and q. These parameters are determined from the statistics of real data (see Section 3.3.3 for details).
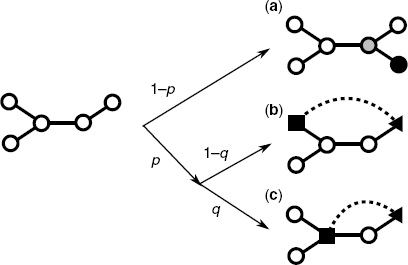
In general, it is believed that metabolic networks evolve by a reaction (enzyme) gain due to evolutionary events (see Ref. 27 for details). In this case, we can consider two situations: the case that a new reaction occurs between a new metabolite and an existing metabolite (Event I) and the case that a new reaction occurs between existing metabolites (Event II).
With the above consideration, the modeling is as follows.
Figure 3.9 Schematic diagram of the growth mechanisms of the model. (a) Event I. The black and gray nodes represent a new node and a randomly selected existing node, respectively. (b) and (c) Event II. The dashed lines correspond to new edges. The triangular nodes are randomly selected existing nodes. The quadrangular nodes are existing nodes, selected by a random walk from each red node. The new edge becomes a short-cut path between the triangular node and the quadrangular node.
3.3.2 Analytical Solution
(3.17) ![]()
(3.21) ![]()
(3.22) ![]()
(3.23) ![]()
(3.24) ![]()
(3.27) ![]()
3.3.3 Estimation of the Parameters
As explained in Section 3.3.1, this model has two parameters p and q. In order to reproduce the structural properties of metabolic networks, we need to estimate these parameters in real-world networks. In this section, we discuss the approach for estimating these parameters.
(3.29) ![]()
(3.30) ![]()
3.3.4 Comparison with Real Data
Here, we compare structural properties of this model with those of real metabolic networks.
First, we obtain the parameters p and q from the metabolic network of each organism using Equations 3.28 and 3.31, respectively. Substituting the parameters into the equations, shown in Section 3.3.2, we obtain the structural properties predicted from this model.
Figure 3.10 shows a comparison between the degree distribution of our model and that of real metabolic networks. We provide the P(k) values of two well-known organisms.
Figure 3.10 Comparison between the degree distribution of our model and that of real metabolic networks of E. coli (a) and Bacillus subtilis (b). The symbols represent the data for real networks. The lines are obtained from Equation 3.20.
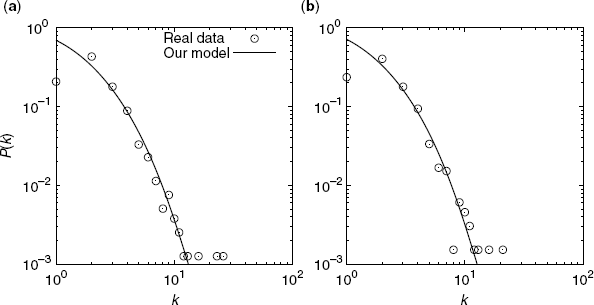
Figure 3.11 shows a comparison between the degree exponent of our model and that of real metabolic networks. For comparison, the degree exponents are obtained by the maximum likelihood method, considering a cutoff, represented by A(p), as follows:
(3.32) 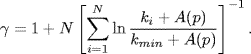
This value is different from that obtained by the original maximum likelihood method [29].
Figure 3.11 Comparison between the degree exponent γ of our model (theoretical) and that of real metabolic networks (real). The dashed line represents γreal = γtheory.
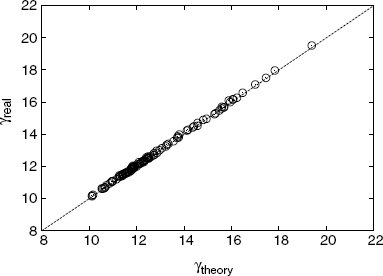
Figure 3.12 shows a comparison between the degree-dependent clustering coefficient of our model and that of real metabolic networks. We show C(k) for the same two organisms.
Figure 3.12 Comparison of the degree-dependent clustering coefficient between our model and the real metabolic networks of (a) E. coli and (b) B. subtilis. The symbols indicate the data for real networks. The lines are obtained from Equation 3.25.
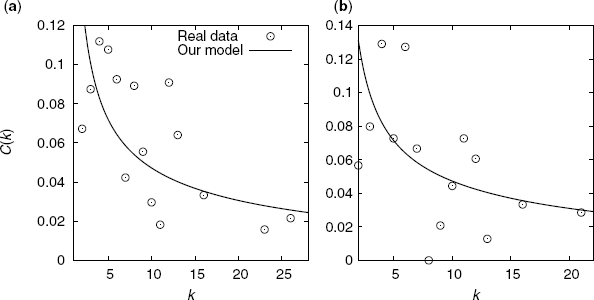
Figure 3.13 shows a comparison between the average clustering coefficient of our model and that of real metabolic networks. The predicted average clustering coefficients are obtained with Equation 3.26 via numerical integration.
Figure 3.13 Comparison between the average clustering coefficient C of our model (theoretical) and that of real metabolic networks (real). The dashed line shows Creal = Ctheory.
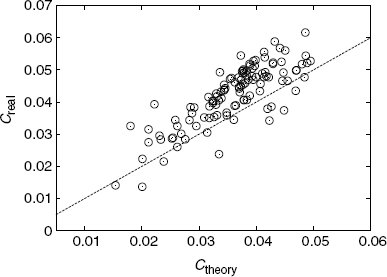
As shown in Figures 3.10–3.13, the theoretical predictions are in good agreement with the real data, indicating that this model can reproduce the structural properties of real metabolic networks.
As mentioned above, this model has a few parameters, which can be estimated very easily. Furthermore, the model parameters relate to the frequency of evolutionary events such as horizontal gene transfers and gene duplications, through which the metabolic networks expand (e.g., see Refs. [30,31]). This model may be useful for the estimation of missing pathways and the evolutionary origin of metabolic reactions.