6.4 The Internet Autonomous System Topology
The Internet's AS topology is a widely studied representation of the Internet at a particular scale. An AS represents a single network that can apply its own operational and peering policy. An Internet service provider (ISP) may use one or more ASes. The Internet contains over 30,000 ASes, each in a set of relationships with its neighbors, who are either its customers, providers, or peers. In the Internet core there is a full mesh formed between the ASes of the various tier-1 ISPs. However, at the edge there are a huge number of smaller ISPs and customer networks which connect through upstream providers and local public exchange points. These smaller ISPs and customer networks may have only one upstream provider, or may have many for resilience and performance reasons. In addition, the Internet constantly evolves new networks are added, old ones disappear, and existing ones grow and merge.
Links between ASes depend on business relationships which can and do change, sometimes rapidly, making any interpretation of the Internet as a static structure inaccurate. This rich and dynamic structure makes it difficult to provide either a single, representative topological model, or a single graph metric that captures all characteristics of any topology. However, such a metric would make it possible to generate realistic synthetic topologies improving the accuracy of Internet-wide protocol simulations, and perhaps enabling the prediction of the future evolution of the Internet's topology.
Many attempts to capture one or more characteristics have been made, resulting in several topology generators each of which synthesize Internet-like topologies using different models and parameters. Unfortunately, validating these models is an ad hoc matter that typically means matching several topological measures in the hope that this will ensure a matching structure. Users often select default parameters for these models based on specific datasets measured at particular times, which no longer represent the current Internet. However, as noted previously, these measures cannot be used to estimate the optimum parameters for a model given a target topology.
6.4.1 Characterization
Over the past several years many topological metrics have been proposed for quantitatively characterizing topological properties of networks. In this section, we present a large set of topological metrics that will be used to measure a distance in graph space, that is, how topologically distant two graphs are from each other. These metrics are computed for both synthetic and measured AS topologies. When choosing our metrics we considered both those used by the topology generator designers and those used more widely in the graph theory literature. Taken individually, these metrics focus on different topological aspects, but when considered together they reveal a more complete picture of the observed AS topologies.
We specifically chose not to use the three metrics of Tangmunarunkit et al. [13] for two reasons. First, computation of resilience and distortion are both NP-complete, requiring the use of heuristics. In contrast, all our metrics are straightforward to compute directly. Second, although accurate reproduction of degree-based metrics is well supported by current topology generators, our hypothesis is that local interconnectivity has been poorly understood, and so we add several metrics that focus on exactly this, for example, assortativity, clustering, and centrality.
AS topologies are modeled as graphs G = (V, E) with a collection of nodes V and a collection of links E that connect a pair of nodes. The number of nodes and links in a graph is then equal to, respectively,  and
and  .
.
Degree. The degree
k of a node is the number of links adjacent to it. The
average node degree
is defined as

. The
node degree distributionP(
k) is the probability that a randomly selected node has a given degree
k. The node degree distribution is defined as
P(
k) =
n(
k)/
N, where
n(
k) is the number of nodes of degree
k. The
joint degree distribution (JDD)
P(
k,
k′) is the probability that a randomly selected pair of connected nodes have degrees
k and
k′. A summary measure of the joint degree distribution is the average neighbor degree of nodes with a given degree
k, and is defined as follows
. The maximum possible
knn(
k) value is
N − 1 for a maximally connected network, that is, a complete graph. Hence, we represent the JDD by the normalized value
knn(
k)/(
N − 1) [14] and refer to it as
average neighbor connectivity.
Assortativity. Assortativity is a measure of the likelihood of connection of nodes of similar degrees [15]. This is usually expressed by means of the
assortativity coefficientr: assortative networks have
r > 0 (disassortative have
r 
0 respectively) and tend to have nodes that are connected to nodes with similar (dissimilar respectively) degree.
Clustering. Given node
i with
ki links, these links could be involved in at most
ki(
ki − 1)/2 triangles (e.g., nodes
a →
b →
c →
a form a triangle). The greater the number of triangles, the greater the clustering of this node. The clustering coefficient
γ(
G) is defined as the average number of triangles divided by the total number of possible triangles:

where
Ti is the number of triangles of node
i and
ki is its degree. We use the distribution of
clustering coefficientsC(
k), which in fact is the distribution of the terms

in the overall summation. This definition of the clustering coefficient gives the same weight to each triangle in the network, irrespective of the distribution of the node degrees.
Rich-Club. The rich-club coefficientϕ(ρ) is the ratio of the number of links in the component induced by the ρ largest-degree nodes to the maximum possible links ρ(ρ − 1)/2, where ρ = 1, . . ., N are the first ρ nodes ordered by their degree ranks in a network of size N nodes and ρ is normalized by the total number of nodes N[16], [17]. In this way, the node rank ρ denotes the position of a node on this ordered list.
Shortest Path. The shortest path length distribution
P(
h) is the probability distribution of two nodes being at minimum distance
h hops from each other. From the shortest path length distribution the average node distance in a connected network is derived as
, where
hmax is the longest shortest path between any pair of nodes.
hmax is also referred to as the diameter of a network.
Centrality. Betweenness centrality is a measure of the number of shortest paths passing through a node or a link. The
node betweenness for a node

is
, where
σst is the number of shortest paths from
s to
t and

is the number of shortest paths from
s to
t that pass through a node

[18]. The average node betweenness is the average value of the node betweenness over all nodes.
Closeness. Another measure of the centrality of a node within a network is its closeness. The closeness of a node is the reciprocal of the sum of shortest paths from this node to all other reachable nodes in a graph.
Coreness. The l-core of a network (sometimes known as the k-core) is the maximal component in which each node has at least degree l. In other words, the l-core is the component of a network obtained by recursively removing all nodes of degree less than l. A node has coreness l if it belongs to the l-core but not to the (l + 1)-core. Hence, the l-core is the collection of all nodes having coreness l. The core of a network is the l-core such that the (l + 1)-core is empty [19].
Clique. A clique in a network is a set of pairwise adjacent nodes, that is, a component which forms a complete graph. The top clique size, also known as the graph clique number, is the number of nodes in the largest clique in a network [20].
Spectrum. It has recently been observed that eigenvalues are closely related to almost all critical network characteristics [8]. For example, Tangmunarunkit et al. [13] classified network resilience as a measure of network robustness subject to link failures, resulting in a minimum balanced cut size of a network. Spectral graph theory enables study of network partitioning using graph eigenvalues [8]. In this chapter, we focus on the spectrum of the normalized Laplacian matrix, where all eigenvalues lie between 0 and 2, allowing easy comparison of networks of different sizes. We use the normalized graph's spectrum for tuning the parameters of topology generators.
6.4.2 Generation
In this section, we present a number of topology generators, each having their own set of parameters. We also present an example of an Internet AS topology dataset which we use as a litmus test for the parameter tuning exercise.
There are many models available that claim to describe the Internet AS topology. Several of these are embodied in tools built by the community for generating simulated topologies. In this section, we describe the particular models whose output we compare in this chapter. The first are produced from the Waxman model [21], derived from the Erdös–Rényi random graphs [22], where the probability of two nodes being connected is proportional to the Euclidean distance between them. The second come from the Barabasi and Albert (BA) [23] model, following measurements of various power laws in degree distributions and rank exponents by Faloutsos et al. [24]. These incorporate common beliefs about preferential attachment and incremental growth. The third are from the generalized linear preference model [25] which additionally model clustering coefficients. Finally, Inet [26] and PFP [17] focus on alternative characteristics of AS topology the existence of a meshed core, and the phenomenon of preferential attachment, respectively. Each model focuses only on particular metrics and parameters, and has only been compared with selected AS topology observations [13,26,27].
Waxman. The Waxman model of random graphs is based on a probability model for interconnecting nodes of the topology given by
(6.17) 
where 0
α,
β ≤ 1,
d is the Euclidean distance between two nodes
u and

, and
L is the network diameter, that is, the largest distance between two nodes. Note that
d and
L are not parameters for the Waxman model. The Internet is known not to be a random network but we include the Waxman model as a baseline for comparison purposes.
BA. The BA [11] model was inspired by the idea of preferentially attaching new nodes to existing well-connected nodes, leading to the incremental growth of nodes and the links between them. Starting with a network of
m0 isolated nodes,
m ≤
m0 new links are added with probability
p. One end of each link is attached to a random node, while the other end is attached to a node selected by preferring the more popular, that is, well connected, nodes with probability
(6.18) 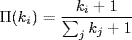
where kj is the degree of node j, with probability q, m links are rewired and new nodes are added with probability 1 − p − q. A new node has m new links that, with probability Π(ki), are connected to nodes i already present in the system. We use the BRITE [28] implementation of this model in this chapter.
GLP. Our third model is the generalized linear preference (GLP) model [25]. It focuses on matching characteristic path length and clustering coefficients. It uses a probabilistic method for adding nodes and links recursively while preserving selected power law properties. In the GLP model, when starting with
m0 links, the probability of adding new links is defined as
p where
p 
[0, 1]. Let Π(
di) be the probability of choosing node
i. For each end of each link, node
i is chosen with probability Π(
di) defined as
(6.19) 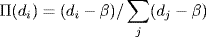
where
β (− ∞, 1) is a tunable parameter indicating the preference of nodes to connect to existing popular nodes. We use the BRITE implementation of this model in this chapter.
Inet. Inet [26] produces random networks using a preferential linear weight for the connection probability of nodes after modeling the core of the generated topology as a full mesh network. Inet sets the minimum number of nodes at 3037, the number of ASes on the Internet at the time of Inet's development. By default, the fraction of degree 1 nodes
α is set to 0.3, based on measurements from Routeviews
10 and NLANR
11 BGP table data in 2002.
PFP. In the positive feedback preference (PFP) model [17], the AS topology of the Internet is considered to grow by interactive probabilistic addition of new nodes and links. It uses a nonlinear preferential attachment probability when choosing older nodes for the interactive growth of the network, inserting edges between existing and newly added nodes. As the PFP generator does not have any user-tunable parameters we include it only in the last part of Section 6.6 for completeness.
6.4.3 Observations
The AS topology can be inferred from two main sources of data, BGP and traceroutes, both of which suffer from measurement artifacts. BGP data is inherently incomplete no matter how many vantage points are used for collection. In particular, even if BGP updates are combined from multiple vantage points, many peering and sibling relationships are not observed [29]. Traceroute data misses alternative paths since routers may have multiple interfaces which are not easily identified, and multihop paths may be hidden by tunnelling via multiprotocol label switching (MPLS). In addition, mapping traceroute data to AS numbers is often inaccurate [30].
Chinese. The first dataset is a traceroute measurement of the Chinese AS Topology collected from servers within China in May 2005. It reports 84 ASs, representing a small subgraph of the Internet. Zhou et al. [31] claim that the Chinese AS graph exhibits all the major topology characteristics of the global AS graph. The presence of this dataset enables us to compare the AS topology models at smaller scales. Further, this dataset is believed to be nearly complete, that is, it contains very little measurement bias and accurately represents the AS topology of that region of the Internet. Thus, although it is rather small, we have included it as a valuable comparison point in our studies.
Skitter. The second dataset comes from the CAIDA Skitter project.
12 By running traceroutes toward a large range of IP addresses and subsequently mapping the prefixes to AS numbers using RouteViews BGP data, CAIDA computes an observation of the AS topology. For our study, we use the graphs from March 2004 to match those used by Mahadevan et al. [14]. This AS topology reports 9204 unique ASs.
RouteViews. The third dataset we use is derived from the RouteViews BGP data. This is collected both as static snapshots of the BGP routing tables and dynamic BGP data in the form of BGP update and withdrawal messages. We use the topologies provided by Mahadevan et al. [14] from both the static and dynamic BGP data from March 2004. The dataset is produced by filtering AS sets and private ASs and merging the 31 daily graphs into one. This dataset reports 17,446 unique ASs across 43 vantage points in the Internet.
UCLA. The fourth dataset comes from the Internet topology collection
13 maintained by Oliveira et al. [32]. These topologies are updated daily using BGP routing tables and updates from RouteViews, RIPE,
14 Abilene,
15 and LookingGlass servers. We use a snapshot of this dataset from November 2007, computed using a time window on the last-seen timestamps to discard ASs which have not been seen for more than 6 months. The resulting dataset reports 28,899 unique ASs.
