
Chapter 8
Trading with the RMO Template
In this chapter, we'll go through a series of examples of trading with the Rahul Mohindar oscillator (RMO) template, each starting with a chart and followed by an explanation of the trade.
The session in Figure 8.1 opens with the moving average relatively flat and the stochastic oscillator and RMO moving higher. The market is in a trading range, and there's little momentum behind the initial attempt of the market to go higher.
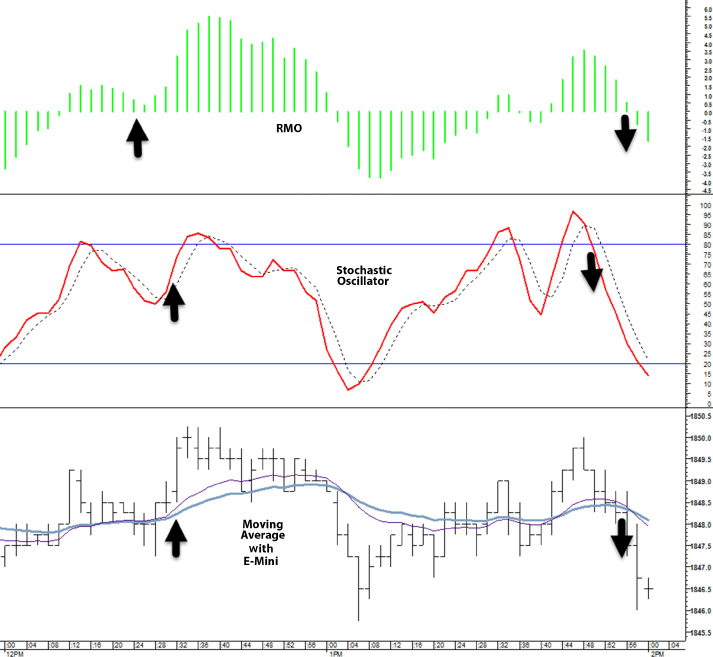
Figure 8.1 RMO Template Trade 1
About one fourth of the way into the session, the moving average, stochastic oscillator, and RMO all accelerate higher. This is a clear 80/20 situation and a good trade to take.
After the swing high in the first one third of the session is reached, the market falls back. The stochastic oscillator and RMO reflect the fall back, but by the time the moving average confirms the move, the other indicators are in an oversold area. I would not take this trade.
The RMO and stochastic oscillator bottom about halfway through the session and begin rising, but the moving average remains flat and does not confirm the move.
Toward the end of the session, the RMO forms a bearish divergence, when the late-day session price high is made on weaker RMO momentum than the previous price high. The stochastic oscillator breaks sharply. When the moving average turns down, you have confirmation from all three indicators and a solid 80/20 short-trade opportunity.
About one-third of the way into the session in Figure 8.2, all three indicators begin to move up at about the same time. You need to catch the trade quickly, as the market moves sharply higher and then flattens. If you don't catch it early, let it go.
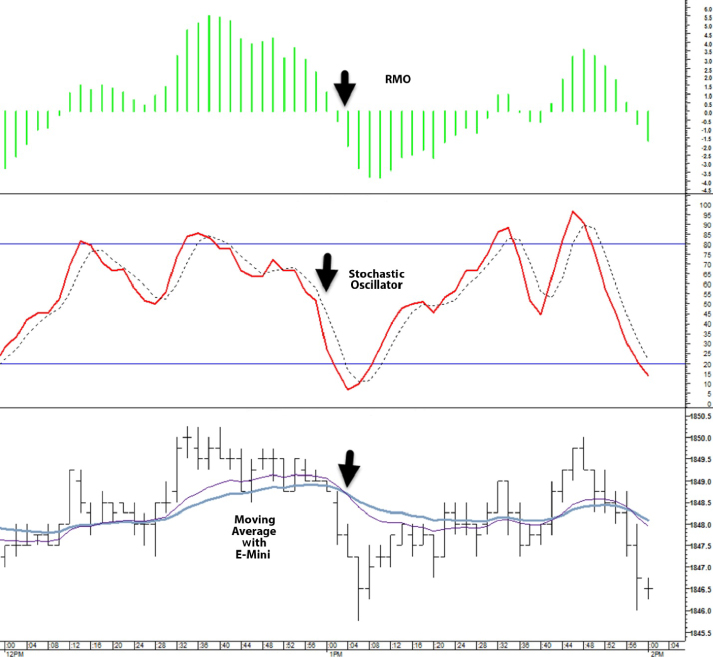
Figure 8.2 RMO Template Trade 2
After the market makes a swing high, the stochastic oscillator and the RMO begin to turn. The gradual decline in these indicators then accelerates and is confirmed by a downturn in the fast moving-average line. This is a nice short-trade opportunity. Again, you have to move fast.
Late in the session, the stochastic oscillator and moving average begin to rise at about the same time, and the RMO eventually confirms. The market moves progressively higher for the next several price bars. Then, just as quickly, the market turns down again, and the decline is reflected in all three indicators.
At the beginning of the session in Figure 8.3, the moving average is moving up, and the RMO is above the 0 line. These are bullish conditions, and we only need to wait for the stochastic oscillator to confirm. Early on, however, the stochastic oscillator turns down. We have to be patient, monitor conditions for change and continuity, and wait for a good opportunity. Finally, when the stochastic oscillator turns up, that's a good opportunity to go long.
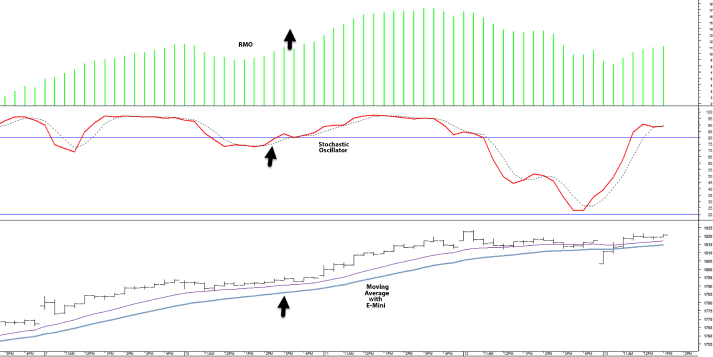
Figure 8.3 RMO Template Trade 3
As the session progresses, the stochastic oscillator flattens and then turns down. At the same time, however, the RMO remains far above the 0 line, and the moving average is still trending higher. Conditions continue to be bullish, and you want to look for an opportunity to buy the market.
When the stochastic oscillator turns up (a little before the halfway point of the session), you can put on a trade. At that point, everything is in place. The moving average, the stochastic oscillator, and the RMO are all trending higher. This is an 80/20 trade.
The market's upward momentum begins to dissipate toward the later part of the session. The moving average flattens, and the stochastic momentum breaks sharply down. There's not sufficient unanimity among the indicators to consider going short. And when the stochastic momentum reverses late and trends higher, the flattened moving average prohibits taking a late, bullish trade.
The session in Figure 8.4 opens with the RMO and stochastic oscillator at high levels but moving in a relatively flat angle, paralleling the flat price movement in the actual market. It looks like a market ready to break, but we need to wait for confirmation from our indicators.
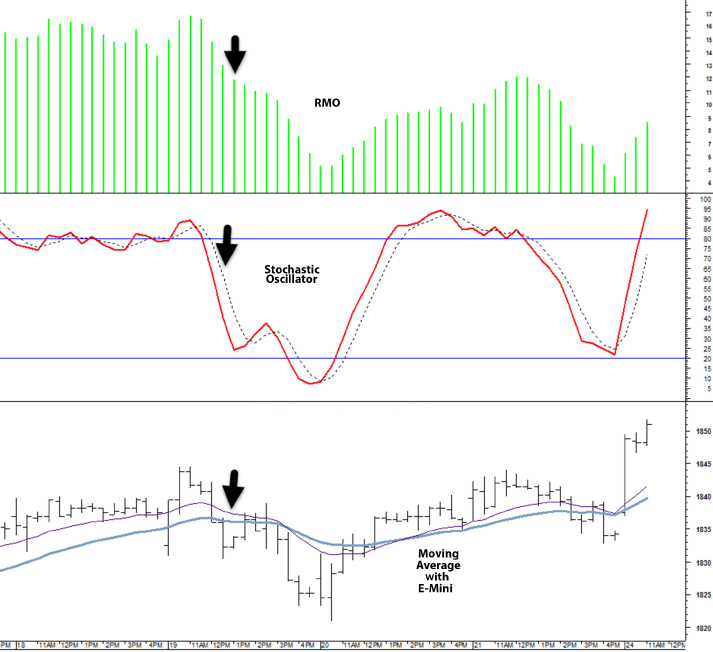
Figure 8.4 RMO Template Trade 4
One third of the way into the session, the RMO and the stochastic oscillator break sharply, and the fast line of the moving average tilts down. This is a strong 80/20 short setup, particularly because the market is dropping from overbought conditions, as reflected in the RMO and stochastic oscillator.
Just past the halfway point of the session, the stochastic oscillator and RMO are moving higher again. When the fast line of the moving average tilts up and then crosses the slow line, you have a bullish trade setup. However, given that the stochastic oscillator is approaching overbought levels, this is more of a 60/40 trade.
About two thirds of the way into the session, the RMO and the stochastic oscillator form bearish divergences as the swing price high is made on weaker RMO and stochastic momentum than the previous price high. Both the RMO and stochastic oscillator then break lower. The fast line of the moving average does begin to tilt down; however, it's a weak move, and it is not confirmed by the slower line. I wouldn't take this trade.
At the end of the session, there's a quick move up in all three indicators. Again, I wouldn't take the trade, but it might be an opportunity for a longer-term trader.
Early in the session in Figure 8.5, the stochastic oscillator moves sharply higher, followed quickly by the RMO. When the moving average begins to tilt upward, you have confirmation and a good 80/20 trade.
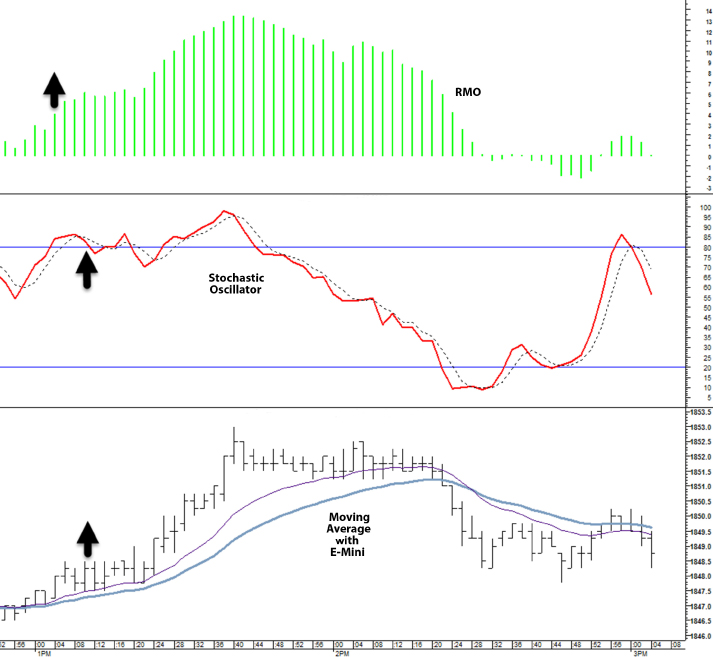
Figure 8.5 RMO Template Trade 5
After moving strongly higher, the market flattens. The stochastic oscillator and RMO begin to move down. The moving average continues rising. There's no trade in this situation.
When the moving average turns down about two thirds into the session, you can take this trade. However, by this time, the stochastic oscillator is approaching oversold conditions, so proceed with caution. Use a tight stop.
There are no solid trade setups until late in the session in Figure 8.6. Early on, the stochastic oscillator and moving average are in conflict. About one third of the way in, the stochastic oscillator and RMO begin to decline, but the move is not confirmed by the moving averages.
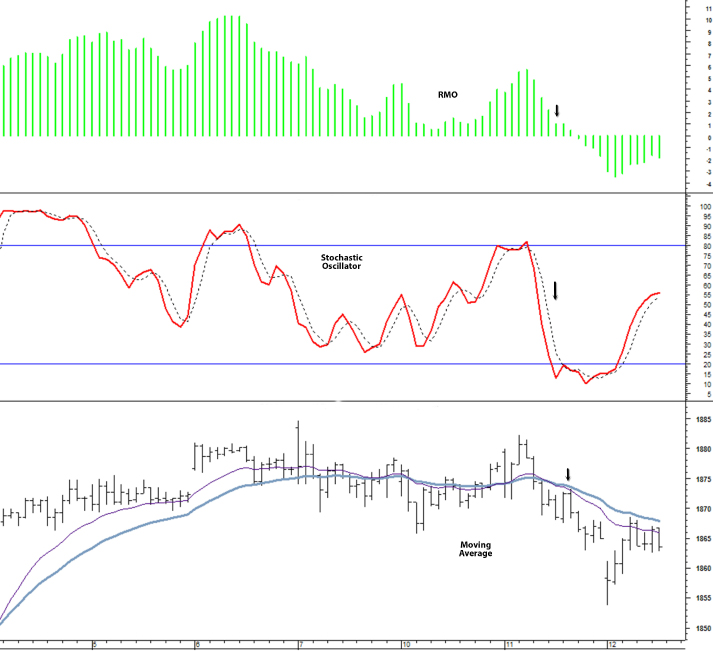
Figure 8.6 RMO Template Trade 6
An important thing to see here is the divergence that develops about three quarters of the way into the session. The price rallies; however, the RMO and the stochastic oscillator fail to reach to the levels they achieved on the previous session high. This is a bearish signal.
After the divergence, the stochastic oscillator and RMO drop dramatically and the fast-line moving average crosses the slow line. This is a solid 80/20 trade.
The session in Figure 8.7 opens with the moving averages going higher, the stochastic oscillator going lower, and the RMO flat. Nothing to do here.
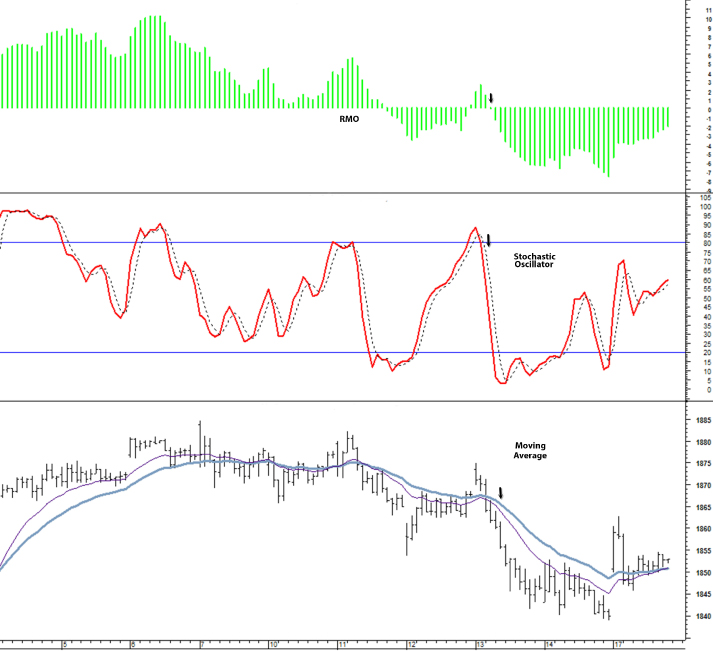
Figure 8.7 RMO Template Trade 7
About midway through the period, the market tries to go higher but gets little traction and then starts down. The RMO and stochastic oscillator catch the move first, and the moving average soon follows.
About four fifths of the way into the chart is the best trade of the session. The RMO, stochastic oscillator, and moving average break down simultaneously. The fast line of the moving average accelerates, creating separation from the slow line. This is an 80/20 trade.
There are several trades available on the chart in Figure 8.8, which represents two weeks of market activity. In each instance, all three indicators move in the same direction. And in each instance, the trades are profitable, provided you follow my approach of getting in and out of the market quickly.
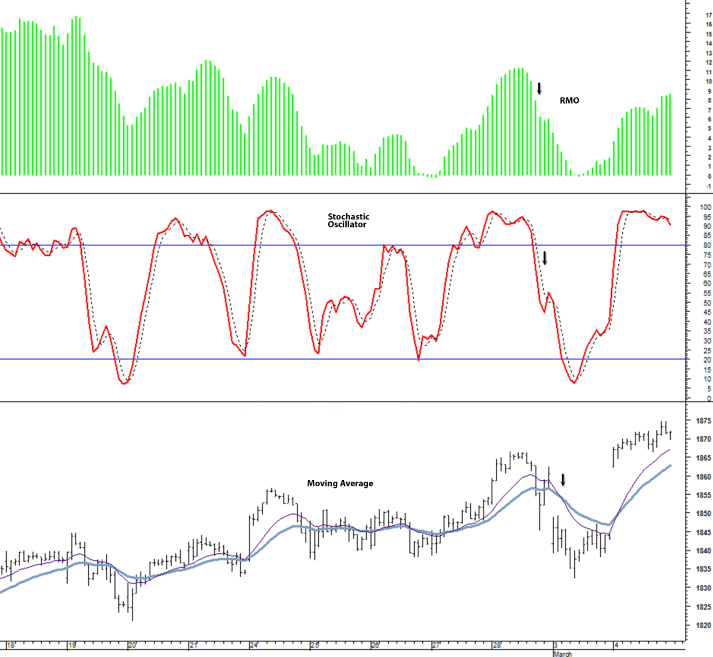
Figure 8.8 RMO Template Trade 8
About one fifth of the way into the session, the RMO and the stochastic oscillator break down sharply. The moving average tilts down gently in contrast to the sharper moves of the other two indicators. And the fast line of the moving average doesn't cross the slow line until the move is well under way. I would classify this as a 70/30 or 60/40 trade.
The market then bottoms and heads upward. The RMO and stochastic oscillator turn bullish. However, the moving average again is slow to respond. And by the time the fast-line moving average crosses the slow line, the stochastic oscillator is in overbought territory. I would stay away from this trade.
About two fifths into the session is a much better trade setup. The moving average, stochastic oscillator, and the RMO all rise at the same time. While the move happened at the market opening of the 24th and quite likely was a response to an economic report or other news, the response from all three indicators was very strong, indicating that follow-through was likely. This is a good trade to take.
About four fifths into the chart is the best trade of the session. The stochastic oscillator leads the way, turning up, and is quickly followed by the RMO and the moving average. This is a solid 80/20 trade.
Finally, at the very end of the session is a good short-side trade. The stochastic oscillator and RMO turn very bearish. The moving average tilts down, as well. A good time to short the market is when the fast-line moving average crosses the slow-line moving average.
The market opens in Figure 8.9 with the stochastic oscillator and moving averages in a relatively flat movement and the RMO slowly moving higher. The market price, stochastic oscillator, and moving average then start moving higher also, but with the stochastic oscillator at such an extreme level, this is not a good opportunity to go long.
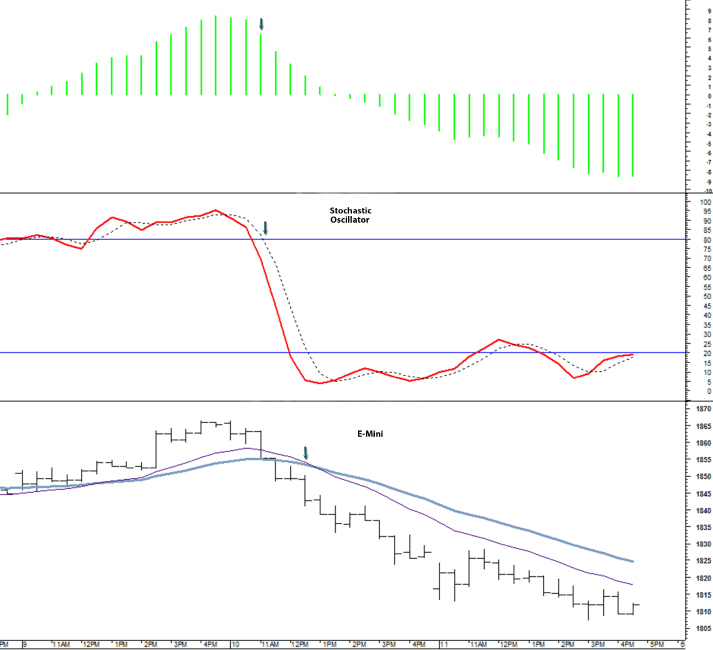
Figure 8.9 RMO Template Trade 9
A little bit later, the RMO and stochastic oscillator begin to turn down and are quickly joined by the moving averages. When the fast-line moving average crosses the slow line, you have a good short-side trade setup.
At the beginning of the session in Figure 8.10, the moving averages are in a bullish pattern, the stochastic oscillator is descending, and the RMO is stagnant above the zero. Not much clarity here.

Figure 8.10 RMO Template Trade 10
The market then sells off a bit and then rallies to a session high. At that point, the stochastic oscillator quickly begins to drop from an overbought level and the RMO begins to trend down. When the fast-line moving average crosses the slow-line moving average, a short-side trade emerges.
Just short of halfway into the chart, there's another bearish trade setup. The stochastic Oscillator and RMO drop sharply and are soon followed by the fast-line moving average crossing below the slow line.
A little past halfway into the chart, the market makes a swing low on very weak momentum, as reflected in both the RMO and the stochastic oscillator. While this is not a classic divergence signal because price did not make a new low, it does indicate that the downside momentum is quite weak at this point.
Following the weak swing low, the three indicators move upward at about the same time. This is a very strong trade, and the market responds with an extended rally.
The market is in a trading range through the first half of the session in Figure 8.11. Notice, however, that throughout the first half, the moving average is in a bullish alignment. On two occasions during this period, the RMO and stochastic oscillator turn higher and produce quick in-and-out trading opportunities. I wouldn't classify these trades as 80/20 opportunities, however, because the bullish tilt on the moving averages is very slight.
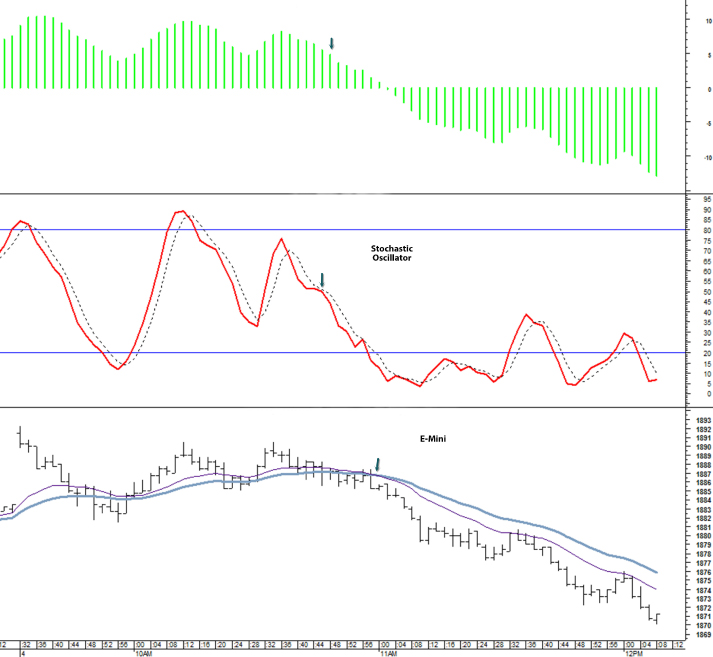
Figure 8.11 RMO Template Trade 11
About halfway into the chart, the best trade on the session appears following a bearish divergence where price reaches the previous session high, but the RMO and the stochastic oscillator fall well short of their previous highs. Both the stochastic oscillator and RMO then break sharply. When the fast-line moving average crosses the slow line, you have clearance to short the market.
Early in the session in Figure 8.12, the moving average is moving in a flat to slightly weaker manner. The RMO is also looking weak. However, after a slight turn down, the stochastic oscillator is moving higher. There's no trade to take here, but it's clear the market has a bearish flavor.

Figure 8.12 RMO Template Trade 12
About one fourth of the way into the session, the RMO and stochastic oscillator form tops and then begin moving quickly lower. When the moving averages confirm the move, it's a good situation to go short.
The market forms a bottom about halfway through the session and then turns up. The RMO and stochastic oscillator start climbing. When the fast-line moving average crosses the slow line, there's a good bullish trade setup.
At the start of the session in Figure 8.13, the market is clearly bearish. The RMO and stochastic oscillator are trending down. When the fast-line moving average crosses the slower line, everything is lined up to go short. The trade likely would result in a small profit or scratch.
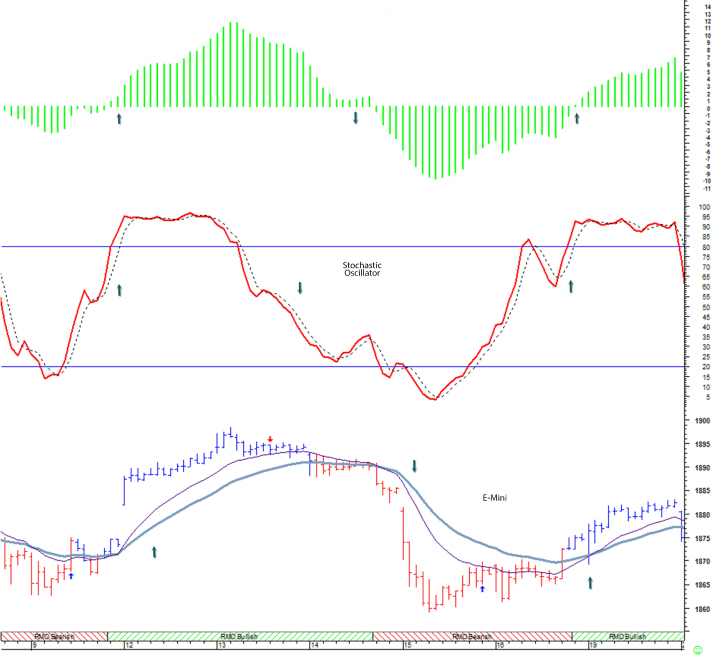
Figure 8.13 RMO Template Trade 13
The market gaps up about one fifth of the way into the chart, and all the indicators turn bullish. Notice the separation between the fast- and slow-line moving averages, a clear indication of strong upside momentum. This is a good trade to take.
About two thirds of the way into the chart, the market starts falling rapidly, and all three indicators turn very bearish. I would go short when the moving averages begin separating and the fast-line moving average begins to descend at a very sharp angle.
Toward the end of the chart, a bullish situation develops. You first see the upward momentum building on the RMO and stochastic oscillator. When the fast-line moving average starts turning up, you can go long.