Chapter 9
A Day of Trading
No one can accurately predict the market. There are simply too many variables. A seemingly perfect trade can go asunder as a result of a natural disaster, an unexpected political development, or a host of other factors. You need to acknowledge and respect the risk that is always present in the market.
My templates measure market activity and help identify high-probability trading situations. Notice I said help identify high-probability trading situations. My approach is not mechanical; there's always an element of interpretation involved.
It's much harder to read charts in real time than at the end of the day. In real time, you have many 60/40 situations where the market is showing a bullish or bearish bias, but you don't have all the signals lined up to make a trade. At various times during the day, you may feel impatient, fearful, or greedy. It's a challenge to remain objectively immersed in the market without feeling some level of emotional discomfort. You have to constantly discipline yourself to act on the basis of your objective analysis and not on the basis of your feelings.
It helps me to think that while I can't predict the market with absolute certainty, I can manage the market in real time. By managing the market, I mean the following:
- I objectively gather information through the prism of my templates.
- I anticipate what needs to happen to create an 80/20 trade.
- When the 80/20 situation unfolds, I put on a trade with no hesitation and with a close stop-loss.
- I take my profit or loss quickly, without emotion, and get ready for the next trade.
Remember, most of the time the market lacks clarity. Bulls and bears are in a constant battle for market control. Long-term, medium-term, and short-term traders are looking for opportunities in their particular time frames. One trader's short-term selling opportunity may be a long-term buying opportunity for another trader.
I read the market with my indicators. Throughout the day, I ask myself:
- Are the indicators flat, trending, or somewhere in between?
- Are the moving averages separating or converging?
- Are any divergences between price and momentum developing?
- Are the indicators confirming each other, or are they in conflict?
- What is the next most likely 80/20 trading opportunity?
By keeping a running dialogue in my head, I'm able to stay on top of the market in real time and anticipate new opportunities. The nature of the market is that great opportunities occur time and time again, but they disappear very quickly as nimble traders jump in and drive prices substantially higher or lower. You want to be on the forefront of those trades, and the only way that's possible is by staying actively in touch with the market throughout the day.
To provide a better idea of the internal dialogue and my trading decision process, I'll focus here on two of days of trading: May 14 and 15, 2014.
By way of background, the stock market was in the mature phase of a long-term bull market that began in March 2009. Several times during that period, the market showed signs of weakness, leading many traders and prognosticators to warn that the end of the bull market was imminent. Each time, the market rallied to record highs. As we approached May 14, the market was slowly churning higher but with very little conviction and very little volatility—not exactly the ideal situation for short-term trading.
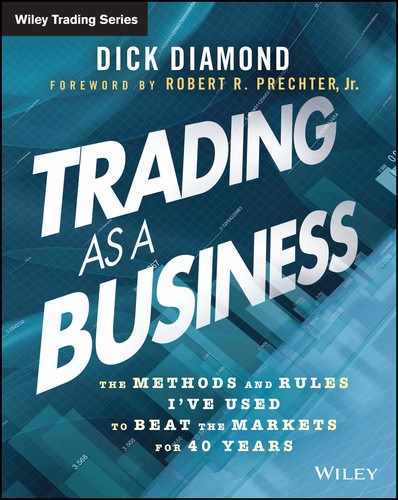
I went into May 14 with an open mind, but with a slight bearish bias. Several indicators flashed bearish signals on the 13th: the RMO, stochastic oscillator, stochastic momentum, moving average convergence-divergence (MACD), and Williams %R (see Figures 9.1–9.3, and 9.4). I envisioned three scenarios: (1) the market breaks early and a strong selling day ensues; (2) the market breaks early, but the move fails and a strong buying day ensues, or (3) the market remains locked in a trading range for most of the day but breaks or rallies after lunch. As a trader, you need to be alert to all possible scenarios.
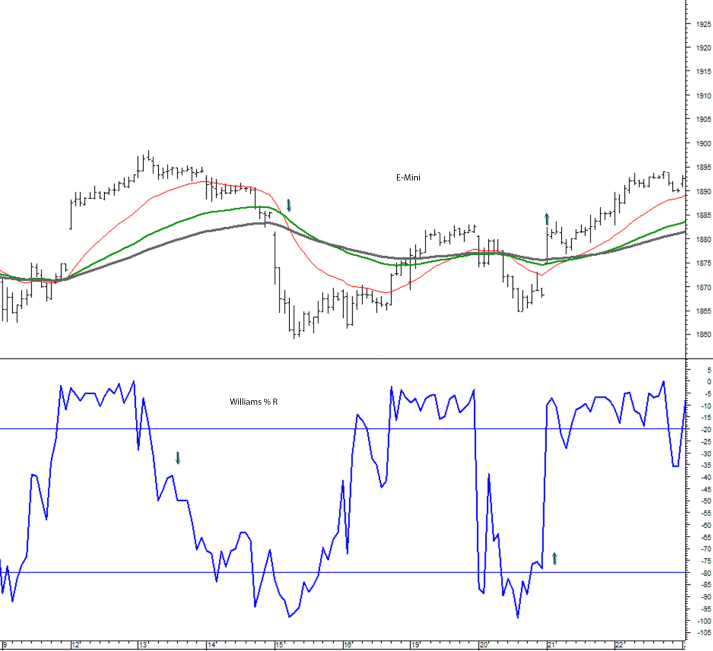
Figure 9.1 Moving Averages
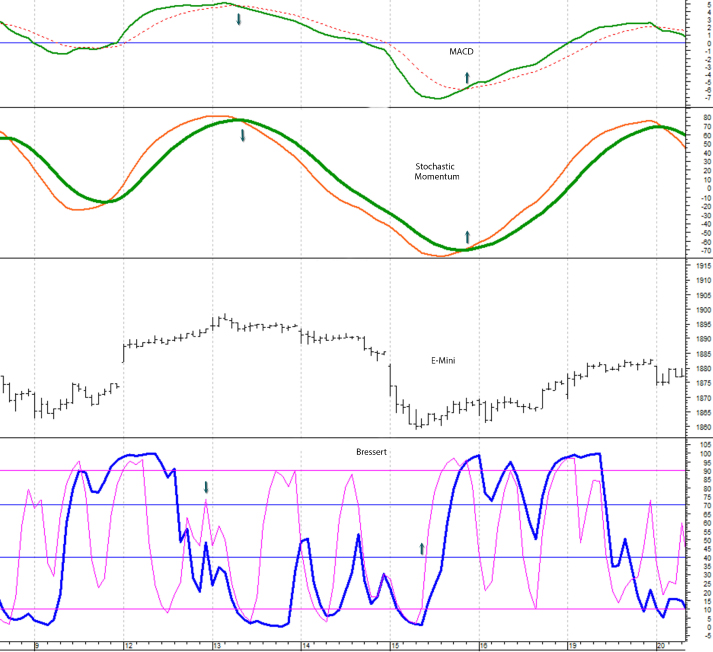
Figure 9.2 Bressert
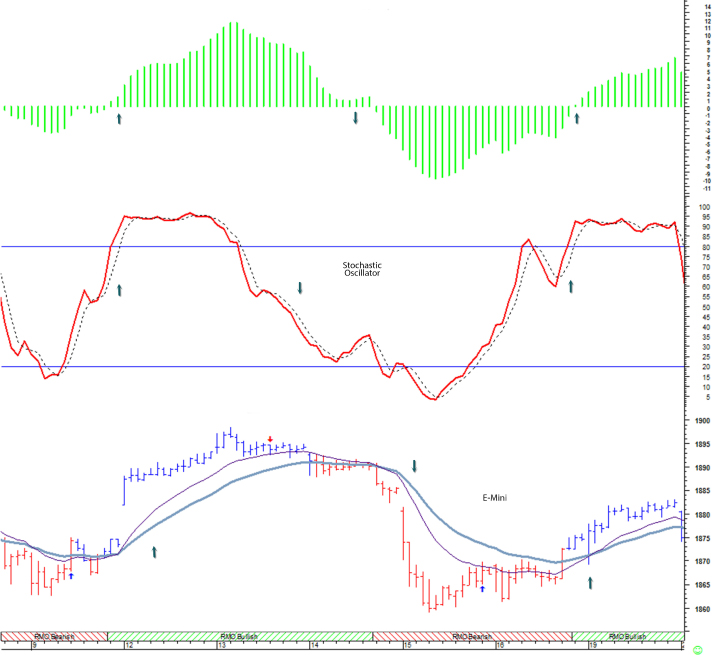
Figure 9.3 RMO

Figure 9.4 Moving Ribbons
At the opening of the 14th, the market was flat, extended down a bit, and then rebounded a little. The shorter-term moving averages were relatively flat; the longer-term moving averages were tilted slightly higher, reflecting the long-term bearish trend. Many of the other indicators continued to look bearish. But despite the bearish tone, the market was not ready to break.
As the morning progressed, the market established a progressively narrower trading range. In recent days, volatility had been diminishing, and there were few trading opportunities. Usually, the stock market provides one or two good trading opportunities every day. That wasn't the case lately, and I was getting a little frustrated.
Markets can stay in trading ranges for a long period of time and you can lose a lot of money trading false breakouts. At the same time, when markets decisively break out of a range, they often move substantially in one direction. Despite my frustration, all my experiences told me to sit tight, monitor the market closely, and be ready for the next trade.
Toward the end of the day, around 2:30 p.m., the market finally broke. Here's what I saw:
- The 21-period moving average turned down, and the 55-period and 89-period quickly followed.
- The Williams %R went negative.
- The RMO went negative.
- The stochastic oscillator went negative.
Accordingly, I went short at 1886.30. I took my profit just before the close at 1883.00.
After the breakdown on the 14th, I expected a weak market and new short-trading opportunities on the 15th. Of course, anything can happen overnight to change the dynamics of the market. A positive earnings announcement from a market leader or a bullish economic report could change the tone of the market and generate a rebound on the 15th. But assuming no significant news developments, I was alert for a weak opening and early morning selling.
Normally, I don't trade the opening. I usually wait for the market to establish an opening range and then monitor my indicators for trading setups. In this situation, however, I was prepared to go short very early on the 15th.
Notice that at the close on the 14th, every indicator on all four templates was strongly negative. This alone is reason to go short on the opening if the market opens lower than the close on the 15th. Moreover, in concert with the set-up, I'm thinking about the mind-set of portfolio managers, investors, and traders. After witnessing the breakdown of the market on the 14th, who would jump in and start buying stocks on the morning of the 15th? Clearly, the downside momentum had not abated. Even investors who believed the long-term bull market was still in force would most likely wait for the short-term selling to ease before buying more stocks. And those who feared the bull market was dying most likely would be sellers on the 15th.
The market opened on the 15th at the lower end of the previous day's range, and almost immediately the market began selling off. With all my indicators pointing down, coupled with the weak opening, I shorted the market at 1878.50 at around 9:40 a.m. In keeping with my practice of grabbing quick profits, I closed the position at 1868.25.
The market continued lower that day and actually continued lower for the next three days. Do I regret taking my profit quickly and leaving a lot of money on the table? Not at all. I would do exactly the same trade again if given the chance. I use tight defensive stops and expect trades to move quickly in my direction. Then, once the trade goes my way, I'll get out of the market. I've done this time and time again, and I've been able to make a good living at this for many, many years.