
Appendix
About MetaStock Pro Templates
Dick Diamond's preferred charting platform is MetaStock Pro (intraday version). MetaStock Pro is a robust and powerful charting utility, ideal for charting, scanning, and plotting the custom indicators used in Dick Diamond's trading strategies. As such, it is important that you know how to apply and use these setups within the software. Specifically, there are four customized Dick Diamond “templates” that must be imported or created in MetaStock Pro:
- Template 1 (Walter Bressert)
- Template 2 (moving ribbons)
- Template 3 (RMO)
- Template 4 (moving averages)
A “template” contains all the information in a chart or layout excluding the base security. When a template is applied to a security (either to an existing open chart or when loading a chart), all of the pertinent indicators and custom views will apply, too, based on the template's information. Each template is saved as a file with a .wmt extension.
If the information from a template came from a single chart, then a chart is created when the template is applied. If the information came from a layout, then a multichart layout is created. You can also create a default template that is always used when a new chart is created.
Creating the Dick Diamond Templates
A template is created from the information in a chart or a layout. Once that chart or layout appears as you'd like, use the “Save As” command in the File menu to save the template. If you create a template when a multichart layout is selected, a multichart template is created. If you create a template when a single chart is selected, a single-chart template is created.
Here are the steps to follow when creating a new template:
- Open MetaStock.
- In the Power Console, type in a symbol (e.g., ESc1), then click Next.
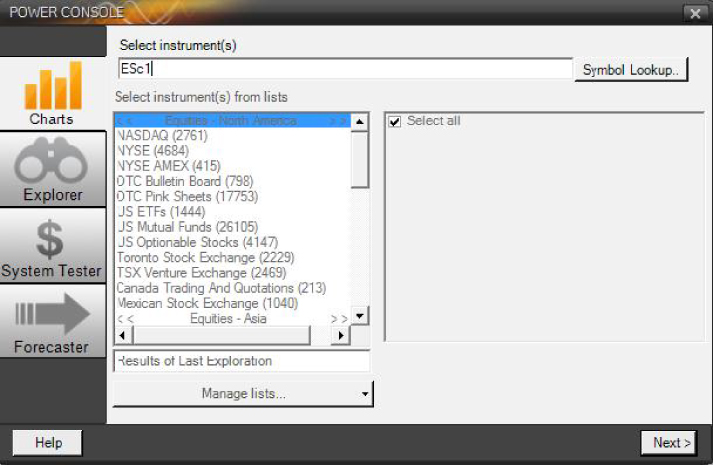
- On the next page of the Power Console, you can choose a range of options. For the purpose of setting up a new template, you can utilize the default settings by simply selecting Open Chart.

- After the basic chart is open, you can add the indicators and settings for your template. Make the desired changes to the chart by adding the indicators and specifications included in the template. (A full listing of the constituent parts of each of the five templates will follow).
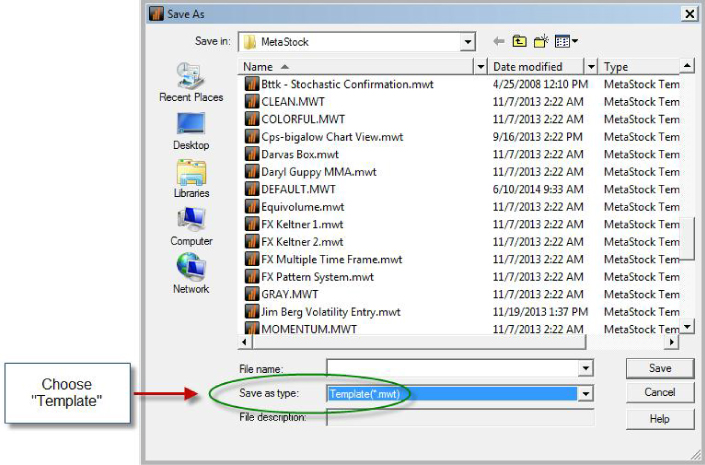
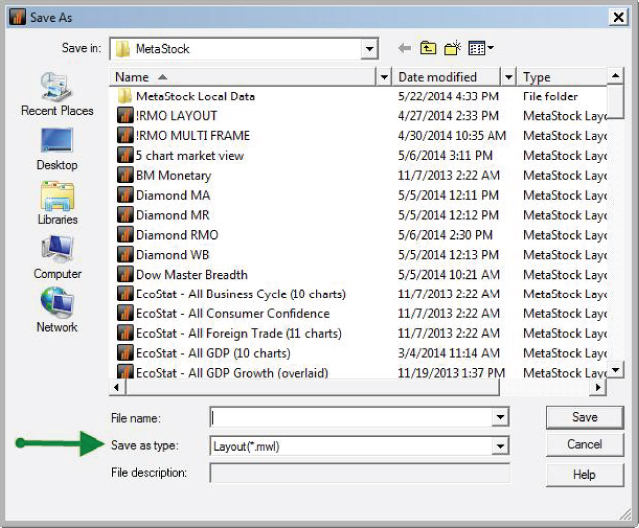
- When the template is complete, choose Save As from the File menu.
- Choose Template from the Save As drop-down list.
- Type the name of the template in the File Name box.
- Click the Save button.
Template 1: Walter Bressert
This template requires indicators from the Walter Bressert Profit Trader add-on to MetaStock. This add-on program should be installed into MetaStock before attempting to create this template.
Following is an example of Template 1 for reference:
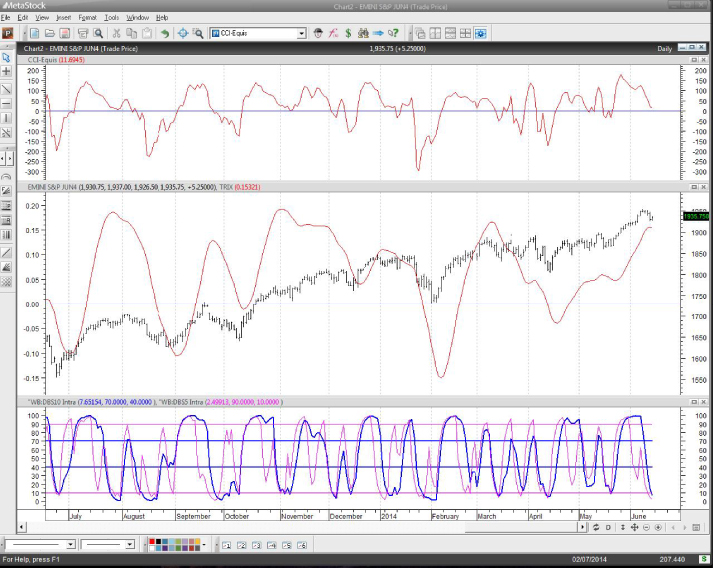
First, open a blank chart. Notice from the preceding reference example that there are four indicators plotted:
- CCI-Equis (14 periods)
- TRIX (12 periods, close)
- “WB:DBS10 Intra (default settings)
- “WB:DBS5 Intra (default settings)
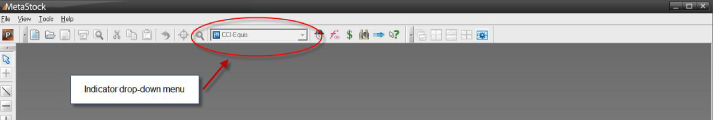
To plot these indicators on the chart, first locate the indicators from the drop-down menu on the top tool bar:
Template 2: Moving Ribbons
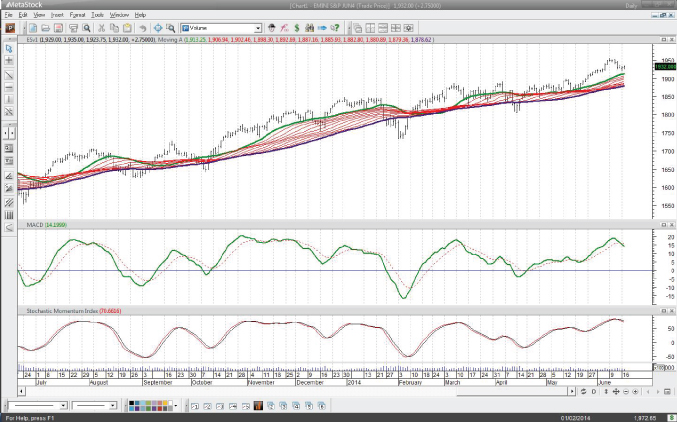
First, open a blank chart. Notice from the preceding reference example that there are three indicators plotted:
- Moving ribbons (time periods set to 20, spacing 5, ribbons 12)
- MACD (standard 12,26,9)
- Stochastic Momentum Index (14,9,9), moving average 3
Template 3: RMO

First, open a blank chart. Notice from the preceding reference example that there are two indicators and then buy and sell indicators:
- Rahul Mohindar oscillator (RMO) displayed in histogram format
- Stochastic oscillator (14,3,3)
- Chart with the RMO Expert Advisor attached
Template 4: Moving Averages

First, open a blank chart. Notice from the preceding reference example that there are four indicators plotted on the chart:
- Moving average: 21-period exponential moving average, close
- Moving average: 55-period exponential moving average, close
- Moving Average: 89-period exponential moving average, close
- Williams %R, 14
Applying an Existing Template
Templates can be applied to a chart on the screen when you open a smart chart from the Open dialog, or when you create a new chart. When a template is applied to a chart, the template uses the chart's base security for all charts in the template.
If the template was created from a single chart, then a chart is created when it is applied. The name in the affected chart's title bar will appear as “Chart 1” with the security name following.
To apply a template to an open chart:
- Right-click on the chart.
- Choose Apply Template from the shortcut menu.
- Choose the desired template from the Apply Template dialog.
To apply a template when loading a security:
- Open the Power Console.
- Enter the security you want to open.
- On the Chart Options page, it will ask if you want an attachment. Select the template under Apply Template.
- Choose Open Chart, and it will open the chart for you.
Making Changes to a Template
Changes are made to a template by opening (applying) the desired template, making the changes, and resaving the template to the same file name.
To make changes to an existing template:
- Apply the template you want to change to a security or chart.
- Make the desired changes.
- Choose Save As from the File menu.
- Double-click the name of the template file you are editing.
- Click Yes when asked if you want to replace the existing file.
Saving a Template
Templates are saved using the Save As command in the File menu. If you want the changes you have made to a template to be retained, you must save the template using the Save As command. You can also save a template as the default template. The default template is automatically applied to all newly created charts.
To save a template:
- Choose Save As from the File menu.
- Choose Template from the Save As drop-down list.
- If you are editing a template and want to save the changes to the same template name, double-click the name of the template file.
- If you are saving a new template, type a name in the File Name box and click Save.
The Default Template
You can control how a newly created chart appears using the “default template.” The default template is a special template that is exactly like a regular template except that MetaStock automatically applies it to newly created charts. The default template that is shipped with MetaStock is just a single chart with high-low-close price bars and volume.
The default template is named DEFAULT.MWT, and it is stored with your other templates at c:MyDocumentsMetaStock. This means that the default template can be applied at any time just like a regular template. For example, you could change the default template so that candlesticks and a moving average are always plotted when a new chart is created.
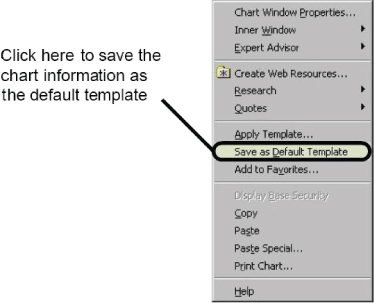
To quickly make the information in the currently selected chart the default template, right-click the chart and choose Save as Default Template.
To edit the default template:
- Choose New from the File menu, and select Chart.
- Double-click any security to chart listed in the dialog.
- Make the desired changes to the chart.
- Right-click on the chart and choose Save as Default Template from the shortcut menu.
Creating the Diamond Work Space
Dick Diamond will view the charts in a 2 and 30 format. Once you have set up the above templates, you can easily create the two-view format and look at the 2- and 30-minute together:
- Open any chart with the template to be used. For the purpose of this example, we will use the moving average template.
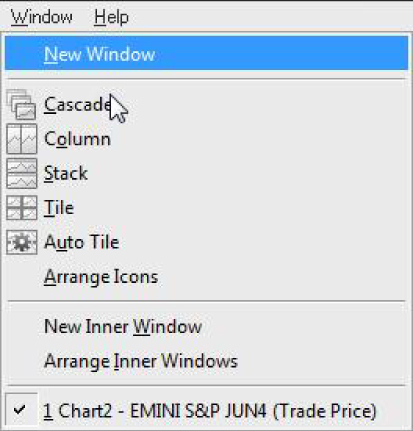
- With the chart open, use the Window, New Window Function in MetaStock. This will allow the program to duplicate the existing chart.
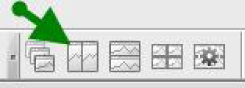
- There will be two of the same chart open. To view the two charts side by side, choose the Column button.
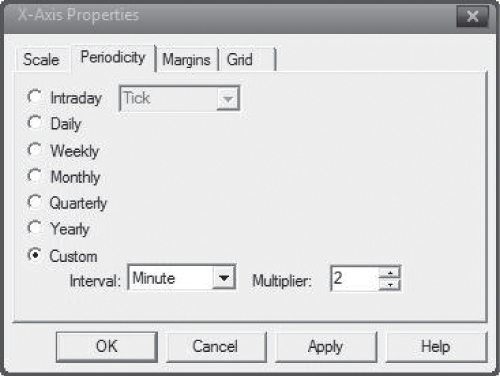
- Now that the charts are displayed side by side, the time frames can be changed to the 2- and 30-minute time frames. Select the Periodicity button on each chart.
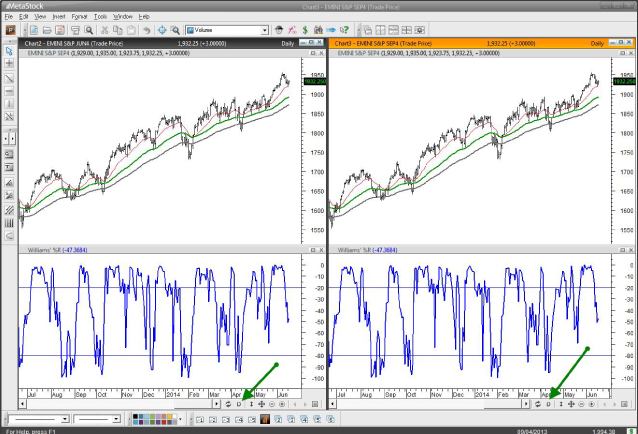
- The chart on the left should be set to a 2-minute time frame, and the chart on the right set to a 30-minute. To set the 2-minute chart, the Custom interval should be chosen and then set the interval as minute. The multiplier should be at 2. For the 30-minute, simply select the 30-minute from the drop-down.
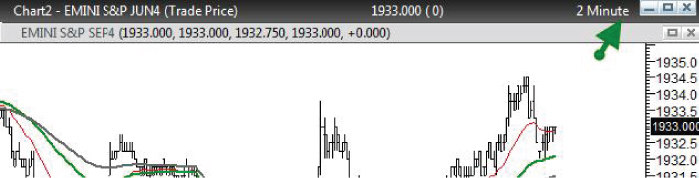
- Verify that your time frames are correct. MetaStock Pro will show you the time frame in the top right-hand corner of your chart.
- You will need to save this as a layout with the two charts open side by side. To do this, go to File | New | Layout.
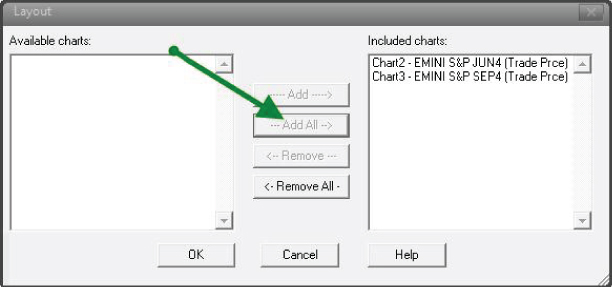
Add both charts into the layout and then choose OK.
- Finally you need to save the layout by going to File | Save As | Type: Layout.
- Select a file name and choose Save.
- To open a layout, go to File | Open. Change file type to Layout.
Choose the file name you gave the product and choose Open. Your layout is now open.
- Repeat these steps for each of the four templates to create your workflow like Dick Diamond.