
Chapter 16
Neuromarketing Measures: Listening to Signals from the Body and the Brain
In This Chapter
![]() Understanding how signals are produced by the human nervous system
Understanding how signals are produced by the human nervous system
![]() Seeing how neuromarketing captures signals from the body
Seeing how neuromarketing captures signals from the body
![]() Looking at how neuromarketing captures signals from the brain
Looking at how neuromarketing captures signals from the brain
![]() Balancing the focus on technologies versus business questions in neuromarketing
Balancing the focus on technologies versus business questions in neuromarketing
In this chapter, we take a tour through the human nervous systems to understand how our bodies produce the signals that neuromarketing measures. We look closely at ten signals from the body and the brain. For each, we describe the major technologies used to capture these signals, and then explain how measuring them can help us understand consumer responses, decisions, and actions. The tour covers a lot of territory, because the brain sciences have bequeathed to neuromarketing a treasure-trove of advanced measurement techniques, most of which have been applied and refined through decades in medical and academic research.
Understanding Where Neuromarketing Signals Originate
In Chapter 2, we introduce a model to talk about how we use our brains to understand, interpret, and influence the world around us. Our model divides brain operations into four main activities:
![]() Forming impressions
Forming impressions
![]() Determining meaning and value
Determining meaning and value
![]() Deliberating and analyzing
Deliberating and analyzing
![]() Speaking and acting
Speaking and acting
In Figure 16-1, we show how these activities fit into the bigger picture of the human nervous system as a whole. The nervous system, with the brain at its center, is the engine of everything we sense and do as human beings.
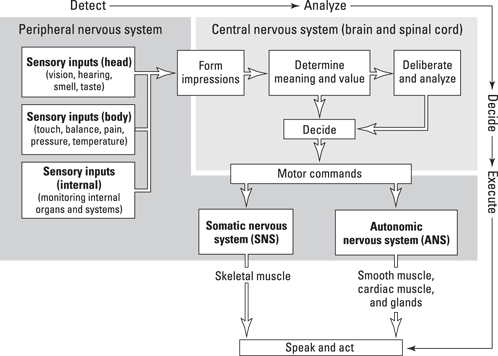
Illustration by Wiley, Composition Services Graphics
Figure 16-1: The central and peripheral nervous systems in action.
Getting to know your nervous system
The main division of labor in the nervous system is between the central nervous system (CNS) and the peripheral nervous system (PNS). The central nervous system consists of the brain and the spinal cord. Two of the activities in our model — determining meaning and value and deliberating and analyzing — occur exclusively in the CNS and are responsible for producing decisions, which also occur exclusively in the CNS.
The other two activities in our model — forming impressions and speaking and acting — involve the peripheral nervous system, which consists of our sensory input systems (the nerves that communicate those inputs to the brain) and our motor execution systems (which receive commands from the brain and communicate them to our muscles and glands).
As we note around the edges of Figure 16-1, the PNS is responsible for detecting sensor signals and executing physical movements; the CNS is responsible for analyzing inputs and deciding outputs.
Mapping neuromarketing measures to the nervous system
Two divisions in the human nervous system are important for understanding the origins and operations of neuromarketing measures. The first is the division between the CNS and the PNS or, more simply, brain versus body. In neuromarketing, brain measures focus on capturing CNS activity inside the brain. Technologies that measure the brain are often called neuroimaging technologies because they involve creating pictures or images of activity within the brain. Body measures capture physical actions (muscle movements) directed by the brain through the PNS. These motor commands are communicated through the second important division in the nervous system depicted in Figure 16-1: the division within the PNS of the somatic nervous system (SNS) and the autonomic nervous system (ANS).
The distinction between the SNS and the ANS is important for understanding neuromarketing measures because signals originating through the ANS are relatively slow and mostly automatic. These include body responses like perspiration, heart rate, breathing, and pupil dilation. Signals originating through the SNS are much faster and under at least partial voluntary control. These include responses like facial expressions, eye movements, blinks, and behavioral responses.
Brain measures also can be divided into two main categories: blood flow measures, which infer brain activity from localized increases in blood flow necessary to deliver energy (oxygen and glucose) to neurons that are activated, and electrical measures, which directly capture the electrical and magnetic signals produced when neurons are activated.
Figure 16-2 shows how the neuromarketing measures covered in this chapter can be categorized in terms of these divisions.
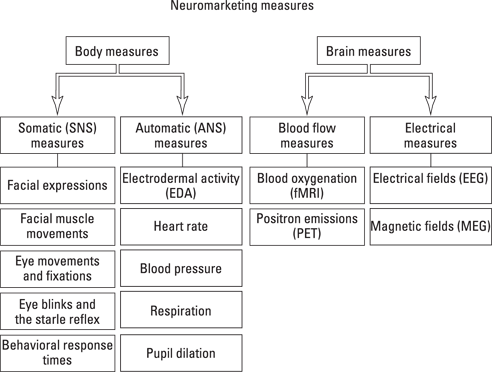
Illustration by Wiley, Composition Services Graphics
Figure 16-2: Neuro-marketing measures from the body and the brain.
Capturing Signals from the Body
Although we often think of behavior in terms of overt movements such as walking, smiling, and speaking, the body also responds to internal and external stimulation in more subtle ways — the skin sweats, the heart pumps harder, facial muscles contract microscopically, the eyes take in more light. These less overtly observable physiological measures play an especially important role in measuring nonconscious reactions to marketing materials. They do this because they originate in the close connection between body and mind — our bodies often respond to environmental stimuli before our conscious minds have become aware that a response is taking place.
Here are some of the most important ways the body signals its reactions to the world around it:
![]() Facial expressions: Universal, observable facial responses to emotional states (joy, anger, surprise, and so on)
Facial expressions: Universal, observable facial responses to emotional states (joy, anger, surprise, and so on)
![]() Facial muscle movements: Micro-movements that are not observable by the human eye but accompany nonconscious emotional responses
Facial muscle movements: Micro-movements that are not observable by the human eye but accompany nonconscious emotional responses
![]() Eye movements: Gaze patterns, fixations, blinks, startle reflexes, and pupil dilation
Eye movements: Gaze patterns, fixations, blinks, startle reflexes, and pupil dilation
![]() Electrodermal activity: Perspiration production as a response to emotional arousal
Electrodermal activity: Perspiration production as a response to emotional arousal
![]() Heart rate, blood pressure, and respiration: Byproducts of the body preparing for action, associated with attention and emotional responses
Heart rate, blood pressure, and respiration: Byproducts of the body preparing for action, associated with attention and emotional responses
![]() Behavioral response times: How fast we respond to simple choice and judgment tasks, which provides clues about personal relevance and nonconscious emotions
Behavioral response times: How fast we respond to simple choice and judgment tasks, which provides clues about personal relevance and nonconscious emotions
Interpreting facial expressions
Emotions are central to every aspect of human behavior and communication. Charles Darwin first suggested that some emotions are universal and can be recognized in facial expressions across all cultures. Beginning in the 1970s, American psychologist Paul Ekman found evidence for six universal human emotions, each associated with a distinctive facial expression recognized consistently across cultures: happiness, sadness, anger, fear, disgust, and surprise. More recently, contempt has been identified as a seventh universal emotion.
Facial expressions are controlled by the SNS, so they’re partially under voluntary control. They’re generally reliable indicators of emotional states. A sincere smile, for example (as opposed to a “fake” or social smile), is usually associated with a feeling of happiness, although this isn’t always the case (as when an exasperated smile might accompany a feeling of frustration).
 This points out a limitation of facial expression analysis: Although emotional facial expressions tend to reflect associated internal emotional states, people can also experience internal emotional states without displaying the accompanying facial expression.
Reading facial expressions: The Facial Action Coding System
Ekman built on his discovery by co-inventing a system for coding emotional expressions based on muscle movements in the human face. He called his system the Facial Action Coding System (FACS). Using FACS, expert coders can manually code any facial expression in terms of its constituent muscle movement units, called action units (AUs). Coders usually analyze videos of human faces, which can be slowed down to identify fleeting micro-expressions representing emotional changes. Some coders can classify expressions in real time, but that’s rare. Becoming a FACS coder requires extensive training and certification. FACS analysis is highly accurate, but it’s time consuming and depends on the availability and proficiency of trained analysts.
Automating facial expression recognition
To overcome some of the limitations of manual facial coding, academic researchers and commercial firms have developed software systems to automate the identification and classification of facial expressions. These systems aren’t yet as accurate as trained FACS professionals, but they are faster, less expensive, and much more scalable. Systems available today can read facial expressions through ordinary webcams, enabling studies with thousands of participants that can deliver results in a matter of days or even hours. When combined with eye tracking through the webcam, they create highly scalable solutions for testing attention and emotional responses to advertising, entertainment, products, and packages.
Using images of expressions to guide self-reporting
A final way that some research firms use facial expressions is substituting images of expressions for verbal depictions of emotional responses to marketing materials. Instead of asking participants to describe an emotional response, participants are shown images of different facial expressions and asked to select the image that best represents the emotions they’re feeling. Researchers have determined that this technique gives a more accurate picture of emotional reactions, especially for cross-cultural studies, because it doesn’t require participants to translate their feelings into words before expressing them.
Sensing facial muscles: Electromyography
Facial electromyography (EMG) is a more precise way to measure facial muscle movement than either manual FACS or automated facial expression analysis. It measures the electrical activity generated by facial muscle activation, which can occur below the level of observable facial expressions.
Extensive research with EMG has found that certain muscles in the face are extremely responsive to emotional stimuli, such as the corrugator (frown) muscle and the zygomatic (smile) muscle. Facial EMG is the only technology that can identify very fast, invisible activations in these muscles that occur automatically and nonconsciously, prior to deliberate expression formation. Thus, EMG can provide a highly sensitive measure of the automatic natural emotional assessments (see Chapter 2) that human beings apply to every sensory input: visual, auditory, olfactory (smell), tactile (touch), and gustatory (taste).
The trade-off for EMG is that this greater precision is purchased at the expense of a more unnatural experience. In order to measure EMG signals, small, wired sensors must be applied to the face directly over the muscles of interest and connected to a nearby signal amplifier and recorder.
Looking at it the right way: Eye tracking
Our eyes automatically follow what interests us, threatens us, or attracts us. Various changes in eye movements, including the speed of eye movement, duration of fixations, pattern and frequency of blinks, and patterns of searching behavior, are all relevant to how a person is responding to a stimulus like a picture or an advertisement. These movements can be measured and tracked within millimeters and milliseconds with sophisticated eye-tracking hardware and software.
Eye movements and fixations
Eye movement analysis has been widely used in market research since the 1970s. Here are the three major types of eye movements measured in eye-tracking studies:
![]() Fixations: Periods when the eyes are relatively stationary because they’re taking in information. The meaning of a fixation may be hard to determine in the absence of other measures. When a person is browsing a web page, for example, fixations may represent greater interest in a particular area, or they may be an indication that an area is complex and difficult to interpret. Longer fixations tend to be associated with uncertainty and processing difficulty, while shorter fixations tend to be associated with greater processing fluency.
Fixations: Periods when the eyes are relatively stationary because they’re taking in information. The meaning of a fixation may be hard to determine in the absence of other measures. When a person is browsing a web page, for example, fixations may represent greater interest in a particular area, or they may be an indication that an area is complex and difficult to interpret. Longer fixations tend to be associated with uncertainty and processing difficulty, while shorter fixations tend to be associated with greater processing fluency.
![]() Saccades: Rapid eye movements that occur between fixations. They represent periods of visual search during which information acquisition is not taking place. Direction and distance of saccades are indications of shifts in understanding, attention, or goals. Regressive saccades (moving back to a previously viewed area) often represent confusion or a lack of understanding. Long jumps indicate that attention has been drawn from a distance. Sudden shifts in saccade direction may represent a change in the viewer’s goals or an indication that the stimulus isn’t aligning with the viewer’s expectations.
Saccades: Rapid eye movements that occur between fixations. They represent periods of visual search during which information acquisition is not taking place. Direction and distance of saccades are indications of shifts in understanding, attention, or goals. Regressive saccades (moving back to a previously viewed area) often represent confusion or a lack of understanding. Long jumps indicate that attention has been drawn from a distance. Sudden shifts in saccade direction may represent a change in the viewer’s goals or an indication that the stimulus isn’t aligning with the viewer’s expectations.
![]() Gaze paths: The summation of fixations and saccades over time. Straight and rapid gaze paths indicate efficient and targeted visual navigation of the stimulus, while longer, more circuitous routes often signify confusion or a lack of direction in the viewing task.
Gaze paths: The summation of fixations and saccades over time. Straight and rapid gaze paths indicate efficient and targeted visual navigation of the stimulus, while longer, more circuitous routes often signify confusion or a lack of direction in the viewing task.
Eye blinks and the startle reflex
Eye blinks are much more interesting than they should be. Of course, we blink to moisten our eyeballs, but we blink at a rate much higher than is required for that purpose. Researchers have calculated that we spend about 10 percent of our waking hours blocking our visual input with eye blinks. There must be something important going on if our brains are willing to make such a sacrifice of vigilance — after all, a lot can happen in the blink of an eye.
It appears the extra purpose of eye blinking is to release our attentional focus from external stimuli for just a moment, to give us a chance to engage in internal mental processing. And we seem to have some built-in routines for determining when to do this so we don’t miss anything important happening in the external world. Knowledge of this functionality of eye blinks makes them useful for neuromarketing in a couple ways:
![]() Blinking is suppressed during tasks that require attention, but it’s more active during tasks that demand less attention. So, blink rate (the average number of blinks per minute) and blink duration (how long the blink takes) can be useful indicators of attention allocation over a period of time.
Blinking is suppressed during tasks that require attention, but it’s more active during tasks that demand less attention. So, blink rate (the average number of blinks per minute) and blink duration (how long the blink takes) can be useful indicators of attention allocation over a period of time.
![]() Blink synchronization (the extent to which people blink at the same moment) across an audience of viewers can be used as a moment-to-moment measure of engagement with a video program or narrative. Because each viewer’s brain is independently deciding when to “take a break” with a blink, synchronization of blinking becomes an indicator of when the video is effectively commanding the audience’s attention, and whether it’s effectively communicating its intended narrative transitions.
Blink synchronization (the extent to which people blink at the same moment) across an audience of viewers can be used as a moment-to-moment measure of engagement with a video program or narrative. Because each viewer’s brain is independently deciding when to “take a break” with a blink, synchronization of blinking becomes an indicator of when the video is effectively commanding the audience’s attention, and whether it’s effectively communicating its intended narrative transitions.
The startle reflex is an involuntary SNS effect that’s easy to measure. While a person is engaged in some task (such as watching a video, viewing an image, or reading a narrative), a short burst of noise is intermittently presented through speakers or headphones. When the unexpected noise is heard, the person automatically responds with the classic components of the startle reflex: eye blinking and eye muscle contraction.
The startle reflex is a robust, indirect measure of motivational orientation (approach or avoidance) toward an object of attention. As part of our natural and automatic emotional response to everything we encounter, our brains are constantly adjusting our emotional state in terms of approach-avoidance preparation. Because the startle reflex is a defensive response, its magnitude is affected by the degree to which we’re already in an avoidance-oriented or defensive state. The more negative our emotional state, the larger the startle reflex will be. Conversely, the more positive our emotional state, the smaller the startle reflex will be.
 This relationship is explained by the principle of priming (see Chapter 5): A negative emotional state, even a very subtle one, makes a defensive response more accessible, so we’re able to produce a “better” startle reflex response than when we aren’t primed for defensiveness.
Pupil dilation
Pupillometry is the measurement of pupil size and changes in pupil size. Most eye-tracking systems measure pupil size as a byproduct of monitoring eye movement. Unlike other aspects of eye movement, pupil dilation is controlled by the ANS. Researchers have found that pupils dilate as a response to emotional arousal, attention, and cognitive load (the amount of information a person is thinking about), so pupil diameter changes can be a reliable and sensitive measure of selected emotional and cognitive reactions to stimuli in real time.
Pupil dilation does not respond differentially to emotional valence, so it isn’t a valid measure of liking or disliking. Pupils dilate in response to the emotional intensity of a stimulus, not its emotional direction. Also, because pupil diameter is highly responsive to changes in external brightness, dilation is not a good measure to use with materials that change in brightness over time, like videos. It’s most useful for studying static images, like print ads, whose brightness remains constant while being viewed.
Reading sweaty palms: Electrodermal activity
Electrodermal activity (EDA) is the degree to which an electric current can pass through the skin. This is a function of the amount of perspiration on the skin, which is generated by sweat glands as part of the ANS. More perspiration conducts electricity more efficiently than less perspiration.
EDA measures, such as galvanic skin response (GSR) or skin conductance response (SCR), typically rely on electrical conductance sensors placed on the palms or fingers of the hand to measure variations in perspiration production. Measuring and analyzing EDA data require expertise and training and should be done by professionals.
Because greater skin conductance is an automatic byproduct of activating the fight-or-flight response of the ANS, SCR is an excellent measure of arousal or stimulation. However, like pupil dilation, it’s insensitive to the direction or valence of the arousal response, so it doesn’t measure liking or disliking. Skin conductance responses also occur with a delay following exposure to an arousal-inducing stimulus, usually from three to five seconds. This means that SCR is not a good measure for pinpointing moment-to-moment sources of arousal, but it’s better used as an overall or average measure of arousal over an extended period of time.
EDA measures were popular in advertising research in the 1960s, but they failed to produce consistent results. More recently, at least one study has concluded that skin conductance is a better predictor of marketplace performance than self-reports. For the most part, EDA has been used in neuromarketing studies as a validation measure along with other measures, rather than as a stand-alone indicator of marketing or advertising effectiveness.
Taking a deep breath: Heart rate, blood pressure, and respiration
Heart rate (the beating speed of the heart) can be an indicator of various physiological reactions, such as attention, arousal, and cognitive or physical effort. It’s also a good predictor of recall. Heart rate is usually measured in terms of time between beats, and it has been found to slow down in the short term when attention increases (deceleration is associated with an “orienting” response) and to speed up in the long term when experiencing emotional arousal (acceleration is associated with a “defensive” response).
Heart rate is unusual among ANS measures in that it’s also a good measure of emotional valence. In multiple studies of advertising, short-term deceleration of heart rate has been found to be associated with both positive and negative emotions, but over longer time periods (three to five seconds), positive stimuli evoke an increase in heart rate while negative stimuli elicit a decrease in heart rate.
Blood pressure, blood volume, and pulse are three aspects of vascular activity (blood flow through the arteries and veins) in the human body. Vascular activity is highly responsive to ANS activation, but it can be triggered by a wide range of psychological inputs, including pleasure, arousal, and memory activation. The need to disentangle these different possible sources creates extra demands on experimental design, execution, and analysis that are not required of more targeted measures, like skin conductance. Also, blood pressure results have been found to be very sensitive to placement and size of the blood pressure cuff put around the subject’s arm. Perhaps for these reasons, vascular measures have only rarely shown up in market-research studies and are not viewed as a particularly promising avenue for future research.
Respiration measures record how deep and fast a person is breathing. Measurement is captured by applying a strain gauge (like a rubber band) around the chest, or using components of heart-rate measures. Fast and deep breathing is associated with emotional arousal and either positive (joy, excitement) or negative (anger, fear) emotional valence. Rapid, shallow breathing can indicate anxiety or tension, but also concentration. Slow, deep breathing indicates a relaxed state, while slow, shallow breathing has been associated with either depression or calm happiness.
Respiration, like skin conductance, is primarily a measure of arousal and doesn’t differentiate between positive and negative emotional valence. Because it’s highly correlated with EDA measures like skin conductance, it’s usually seen as a redundant measure or used to validate other measures.
Racing the clock: Behavioral response times
Behavioral response-time measures use response latencies (time delays) as indicators of the strength of mental associations between concepts in long-term memory. Behavioral response times are shown as SNS measures in Figure 16-2 because they involve the voluntary activation of a motor response, usually the pressing of a button. But it isn’t the button pressing itself that’s important; instead, it’s the length of time it takes for the brain to decide which button to press and then send the appropriate button-pressing command to the appropriate finger. So, behavioral response time can be classified as a behavioral measure, as well as a body measure.
Response-time testing is based on the psychological principles of priming and accessibility. Two words or images are presented in rapid succession. When the second item appears, a choice or judgment has to be made as rapidly as possible. If the first item successfully primes the second (making it more accessible in memory), the task will be performed more quickly. If the association between the two items in memory is weak, the second item will not be primed, and the task will take longer. By carefully selecting the words or images in each pair of stimuli, response times can be used to measure the strength of associations between the concepts represented by the stimuli.
Three main types of behavioral response testing are commonly used in neuromarketing: semantic priming, affective priming, and the Implicit Association Test (IAT). All three are discussed briefly in Chapter 9 as ways to measure brand associations. We cover them in detail in Chapter 17.
Capturing Signals from the Brain
The human brain yields two kinds of signals that scientists have exploited in their efforts to get a better look at what’s going on under the hood. The first is blood flow in the brain; the second is electrical activity in the brain. Both have produced robust bodies of research that are directly relevant to neuromarketing, but both have generated some controversies and unanswered questions as well.
Listening to blood flow in the brain
Two main measurement technologies are used in neuroscience that derive images of brain activity by measuring blood flow in the brain: functional magnetic resonance imaging (fMRI) and positron emission tomography (PET). Both techniques provide indirect measures of brain activity based on the anatomical principle that mental activity increases demand for oxygen or glucose in regions in the brain that are activated, and that this need is met by increased blood flow to the region.
Functional magnetic resonance imaging
fMRI measures a signal called the blood oxygenation level dependent (BOLD) signal. This signal varies by region in the brain because blood delivered to an active brain region requires more oxygen than blood delivered to an inactive region. A key property of oxygenated blood is that it produces a stronger magnetic field than non-oxygenated blood.
fMRI uses powerful magnetic fields, created by a massive donut-shaped magnet that surrounds the subject’s head, to measure this magnetic property of blood in the brain. Technically, a magnetic pulse alters the orientation of atoms in the brain, and the fMRI machine then creates an image of the brain’s state, including regions of greater or less activation, by reading the signals given off by these atoms as they return to their normal orientation.
fMRI is currently the most popular neuroimaging technique for academic neuroscience research. It’s beginning to be used in consumer research as well, but usage has been relatively limited due to the high cost of fMRI machinery, the high level of technical expertise required to run it, and the short supply of fMRI equipment, which is typically found only in hospitals and university labs. fMRI scanners weigh around 12 tons and cost about $2.5 million (not including installation, training, and maintenance, which can drive up the cost another $1 million).
A technical limitation often noted for fMRI is its temporal resolution (the minimum amount of time it takes to produce one observation or scan). Typically, fMRI creates images of the brain that average brain activity over a duration of two to eight seconds. This duration is dependent on the strength of the magnetic field and the design of the experiment (in event-related designs, for example, the effects can be separated as little as one to two seconds). Fundamentally, the temporal resolution of fMRI is limited by the underlying physiological blood flow response, because blood flow to active brain areas occurs with a lag of about six seconds. Although this temporal resolution is much better than what can be achieved with PET, it’s poor when compared to electroencephalography (EEG) or magnetoencephalography (MEG).
A more practical limitation of fMRI is that it’s very sensitive to subject movement. If the person in an fMRI scanner moves his or her head as little as 2 millimeters (about a tenth of an inch), the resulting image is blurred into meaninglessness. Motion-detection and motion-correction algorithms can be applied to the image data, but these algorithms work best if there is minimal motion to begin with. Because speaking causes head movement, verbal responses are impossible to do in the scanner. Behavioral responses are essentially restricted to small movements of the fingers.
The need to restrict movement is one aspect of a broader issue with fMRI regarding comfort and naturalness. The technique requires that the subject lie flat on his or her back and perfectly still inside a giant magnetic “donut” that emits a loud bang continually as the magnet charges and discharges. Even though the subject’s head is baffled with pillows, and noise-cancellation headphones are often used, the noise cannot be entirely eliminated. This makes studies using auditory stimuli very difficult.
Some people find the experience claustrophobic, or at least highly agitating because of the noise and novelty. For consumer and marketing research, which is often focused on identifying subtle variations in emotional response to products, brands, ads, and messages, this can produce a confounding effect that’s difficult to disentangle from responses to the stimuli themselves.
From a neuromarketing perspective, the greatest challenge for fMRI as a measurement technology is not the technical or practical limitations of how brain images are created, but the scientific limitations of how brain images are interpreted. Here are three cautions to keep in mind when reading interpretations of brain images. They all relate to an affliction of fMRI interpretation we call locationism (the erroneous belief that locating where an activity occurs in the brain somehow explains it):
![]() The brain is a network, not a collection of “modules.” Because brain imagery uses (often beautiful) colors to highlight regions of activation, there is a tendency to talk about regions as modules “where x happens.” Too often, this metaphorical language gets interpreted literally, and people start talking about supposed “centers” in the brain. Although there are many areas of specialization in the brain, the production of thoughts, feelings, choices, or actions never happens in just one place. It’s always a function of a complex network of interacting regions.
The brain is a network, not a collection of “modules.” Because brain imagery uses (often beautiful) colors to highlight regions of activation, there is a tendency to talk about regions as modules “where x happens.” Too often, this metaphorical language gets interpreted literally, and people start talking about supposed “centers” in the brain. Although there are many areas of specialization in the brain, the production of thoughts, feelings, choices, or actions never happens in just one place. It’s always a function of a complex network of interacting regions.
![]() Brain areas activate for different reasons. The interpretation to watch out for here is called reverse inference (discussed in more detail in Chapter 19). It’s over-interpreting a finding that “region A is active when mental task B is occurring” to mean that “region A is active only when mental task B is occurring” and, therefore, that “if region A is active, then mental task B must be occurring.” In fact, very few if any regions in the brain do only one thing. For example, the insular cortex activates when you think about romantic love, and it also activates when you think about your iPhone, but this does not mean you’re in love with your iPhone, because the insular cortex activates as part of many other thoughts as well.
Brain areas activate for different reasons. The interpretation to watch out for here is called reverse inference (discussed in more detail in Chapter 19). It’s over-interpreting a finding that “region A is active when mental task B is occurring” to mean that “region A is active only when mental task B is occurring” and, therefore, that “if region A is active, then mental task B must be occurring.” In fact, very few if any regions in the brain do only one thing. For example, the insular cortex activates when you think about romantic love, and it also activates when you think about your iPhone, but this does not mean you’re in love with your iPhone, because the insular cortex activates as part of many other thoughts as well.
![]() Knowing where something happens in the brain does not tell you why you should care. This is perhaps the most significant interpretation challenge for fMRI studies. When academic fMRI research discovers that a part of the brain “lights up” when looking at images of favorite brands, this may fill in a missing puzzle piece about how the brain operates, but it doesn’t automatically translate into a usable finding for a brand marketer. To pass the “So what?” test, results must be attached to a real-world decision or action. This is starting to happen in a few fMRI studies (see Chapter 22 for some examples), but it’s still rare.
Knowing where something happens in the brain does not tell you why you should care. This is perhaps the most significant interpretation challenge for fMRI studies. When academic fMRI research discovers that a part of the brain “lights up” when looking at images of favorite brands, this may fill in a missing puzzle piece about how the brain operates, but it doesn’t automatically translate into a usable finding for a brand marketer. To pass the “So what?” test, results must be attached to a real-world decision or action. This is starting to happen in a few fMRI studies (see Chapter 22 for some examples), but it’s still rare.
Positron emission tomography
PET also uses blood flow as its source for measurement, but it differs from fMRI in that it requires the inhalation of a radioactive gas or the injection of a radioactive solution before brain imaging can be performed. Because of this requirement, PET is classified as an invasive brain-imaging technique. The greater the activity in a brain region, the more the radioactive tracer is present in that region, and the stronger the PET signal at that location of the brain.
Apart from an inherent limitation arising from the use of radioactive substances (governmental guidelines limit the total radiation dose per year per volunteer), the main technical limitation of PET technology is that the temporal resolution is relatively poor because it takes time before enough radioactive “ticks” can be counted. As a result, you can typically get only one picture per minute of brain activity and, as a result, PET produces only an averaged brain activity picture over that period. The spatial resolution of PET is quite good — down to 1 cubic centimeter — which is substantially better than EEG or MEG, but not as good as fMRI.
Given issues surrounding injecting radioactive isotopes into consumer volunteers, PET is not a technology that’s likely to see much use in neuromarketing. Few research teams outside academic or medical labs are qualified to administer PET scanning, and few volunteers are willing to be injected with radioactive substances to test consumer products.
Plugging into the electrical brain
Electrical measures encompass techniques that record brain activity directly, through scalp-surface detection of electrical and magnetic signals emitted by the brain. Electrical signals are the literal mechanism through which the brain communicates and synchronizes activity across different anatomical regions. Electrical measurement techniques provide the most direct measures of cognitive processing. They’re the only measures that record brain activity at the speed of cognition — that is, in milliseconds (thousandths of a second) rather than seconds.
A significant limitation of electrical measurement techniques compared to blood flow techniques is their much poorer three-dimensional spatial resolution, which is to say, they cannot localize activity inside the brain with the same precision as fMRI or PET. This is because they measure only signals at the surface of the scalp, where the sensors are located. The basic obstacle is called the inverse problem, which states that it is mathematically impossible to find a unique source location for a given electrical activity pattern measured at the scalp. As a result, EEG and MEG researchers can guess (often with a high level of confidence, based on matching to fMRI results) where a signal is originating in the brain, but they can never be certain. Also, as noted in the section on fMRI in this chapter, signals originate from multiple regions in the brain, which operate together to produce mental activity, further complicating the problem of finding source locations.
Another challenge with electrical measurement techniques is that the signals they measure can be contaminated with other electrical signals produced by the body. Muscle movement produces electrical signals in the same frequency ranges as the brain, but the signals are about a hundred times stronger than brain signals. This means the smallest muscle movements, like eye movements or head movements, can overwhelm the brain signals and make them difficult to detect separately. Therefore, researchers who specialize in studying electrical signals from the brain must expend considerable effort on artifact correction (the partially automated and partially manual process of separating brain signals from other signals that can show up in the electrical recording).
Electroencephalography
The coherent activity of many thousands of neurons produces electrical potential differences across the scalp, which can be detected using an electrode cap connected to a signal amplifier. The machinery is only moderately expensive and readily available from multiple equipment vendors. EEG is a noninvasive and silent technology that’s directly sensitive to neuronal activity. The time resolution of the EEG is limited only by the hardware, which, typically, can record a voltage every one to three milliseconds.
There are four main types of EEG analysis that are regularly used in neuromarketing — brain-wave frequency analysis, hemispheric asymmetry, event-related potentials (ERPs), and steady-state topography (SST). Each emphasizes a different aspect of the EEG signal, and each has its own pros and cons as a measurement technique for answering neuromarketing questions.
Brain-wave frequency analysis
The brain-wave signals naturally emitted by the brain have distinctive frequency characteristics. Electrical frequency is measured in cycles per second using the unit hertz (Hz). The most easily detected frequency emitted by the brain is around 10 Hz, or ten cycles per second. Frequencies change in response to different mental states and vary over time and across different parts of the brain, so there is lots of room for interpreting the signals and associating them with different mental processes.
Scientists have been studying brain waves for nearly a century, and a convention has emerged to classify commonly observed frequencies into frequency bands named after Greek letters:
![]() Delta: Less than 4 Hz; the dominant frequency in dreamless sleep
Delta: Less than 4 Hz; the dominant frequency in dreamless sleep
![]() Theta: 4 to 8 Hz; associated with internally focused processing, such as memory activation
Theta: 4 to 8 Hz; associated with internally focused processing, such as memory activation
![]() Alpha: 8 to 12 Hz; the brain’s “default” frequency, dominant when eyes are closed and the brain is in a relaxed state
Alpha: 8 to 12 Hz; the brain’s “default” frequency, dominant when eyes are closed and the brain is in a relaxed state
![]() Beta: 13 to 30 Hz; associated with alertness and active attention
Beta: 13 to 30 Hz; associated with alertness and active attention
![]() Gamma: More than 30 Hz; associated with information processing, learning, and emotional processing
Gamma: More than 30 Hz; associated with information processing, learning, and emotional processing
Two metrics are commonly used to measure brain-wave frequencies. The first is called power, and it measures the degree to which there is a large amount of activity within a particular frequency band over a specified period of time (usually seconds or minutes). The second is called coherence, and it measures the consistency or correlation of brain-wave frequencies across different regions of the brain. Greater coherence between regions often means the regions are communicating as part of a mental process.
There is a long tradition in EEG brain-wave analysis in market research, going back to original studies by Herbert Krugman in the 1970s. Early efforts tried to associate responses to marketing stimuli to overall power in different frequency bands, but this was found to be too crude a measure to identify meaningful differences. More recently, sophisticated statistical techniques have been applied to summarize power and coherence patterns over the whole brain, and these approaches have begun to yield interesting predictions of consumer behavior at both individual and market performance levels.
Hemispheric asymmetry
An application of EEG frequency analysis that is particularly relevant to neuromarketing is the measurement of frequency band asymmetries (differences) between the left and right frontal regions of the brain. Researchers have found that these asymmetries are associated with approach and avoidance motivation with regard to external objects or situations. When experiencing approach motivation, there is more alpha band power in the right hemisphere compared to the left, and the opposite is true when experiencing avoidance motivation.
Neuromarketing researchers have begun to use frontal asymmetry as a measure of approach-avoidance responses to products and brands and subsequent information processing and decision making. In a 2012 study by Niklas Ravaja and colleagues, hemispheric asymmetry was found to predict purchase decisions for different combinations of brand familiarity and price.
Event-related potentials
A subset of EEG measurement is the analysis of event-related potentials (ERPs). As the name implies, ERPs isolate brain signals that occur directly in response to some event. By averaging together responses to a large number of these exposures to a stimulus (usually a word or static image), the ERP researcher can isolate the sequence of brain-wave components elicited by the stimulus. By comparing ERPs for different stimuli, inferences can be made about different types of nonconscious and conscious responses, such as
![]() Perceived novelty or familiarity
Perceived novelty or familiarity
![]() Attention allocation
Attention allocation
![]() Surprise (called expectancy violation by ERP researchers)
Surprise (called expectancy violation by ERP researchers)
![]() Emotional arousal and valence
Emotional arousal and valence
![]() Personal motivational relevance
Personal motivational relevance
For example, the P300 component is a well-studied positive potential that occurs at about 300 milliseconds after exposure to a stimulus. It’s sensitive to attention shifts and novelty. It can be used to precisely measure attentional shifts that may occur either overtly (accompanied by eye or body movement) or covertly (occurring in the mind only). The N400 component is a very well-established measure of meaning mismatch and expectancy violation (surprise). It’s a negative potential that occurs after about 400 milliseconds if two stimuli are incongruent either in their meanings or with the subject’s personal beliefs or knowledge. This ERP component can be used to measure brand associations — for example, brand attributes that fit poorly with a given brand name would yield a larger N400 component in the brain. Another well-known ERP component is the late positive potential (LPP) that occurs after 600 milliseconds and that has been shown to be linked to emotional judgment and valence.
ERPs are usually measured in terms of two metrics: Amplitude is a measure of the magnitude of the ERP effect, and latency is a measure of the time lapse before the effect occurs. ERPs have been studied for a long time in research on attention, emotion, memory, language processing, and other areas. They’re especially useful for studying consumers’ nonconscious responses to brands and products.
Steady-state topography
SST is a variation on EEG brain-wave analysis that was first described by neuroscientist Richard Silberstein in 1990. Currently, the technique is licensed exclusively by Silberstein's neuromarketing firm, Neuro Insight (www.neuro-insight.com). SST begins with standard EEG, but it adds one element. While a subject is watching a stimulus (like an ad) and having his or her brain waves recorded with EEG, a dim flicker signal is presented at the edge of the subject's visual field. This flicker elicits a brain-wave response called a steady-state visual evoked potential (SSVEP), which causes the subject's brain to generate a matching brain wave at the same frequency. Using this evoked brain wave as a kind of timing baseline, the method infers properties of the EEG signal by comparing timing differences between the two signals.
According to Neuro Insight literature, SST can be used to determine second-by-second changes in a number of consumer responses to marketing materials, including long-term memory activation (both implicit and explicit memory), engagement (sense of personal relevance), approach-avoidance motivation (whether the material attracts or repels the viewer), emotional arousal, and visual attention.
A reported limitation of SST is that some people find the flicker distracting and the required visor headset somewhat uncomfortable. A strength of the method, compared to standard EEG, is its superior resistance to interference from body or eye movements and its ability to get robust results from single trial exposures to stimuli, an important advantage when trying to capture responses to novel versus familiar stimuli.
Magnetoencephalography
MEG is another electrical technique that is similar to EEG in that it is noninvasive, offers excellent temporal resolution (in the range of milliseconds), and can be used to measure neuronal activity continuously.
Like EEG, MEG relies on the coherent activity of many neurons that, in addition to producing electrical signals, also produce magnetic fields that can be detected outside the head. The strength of these fields is extremely small — typically one part in one billion of the Earth’s magnetic field. To date, the only instrument with the sensitivity required to record these fields is the superconducting quantum interference device (SQUID). Compared to EEG, MEG offers superior signal quality and very high time resolution.
The main limitations of MEG are its much greater cost and the complexity of its equipment. MEG machines are much more expensive than EEG equipment because they require operations at near absolute-zero temperatures. They use liquid nitrogen to achieve these temperatures, so they require a complex and expensive infrastructure to support each machine. As a result, they’re available to only a handful of academic researchers and have not been adopted by any commercial neuromarketing vendors.
Putting Technologies in Their Proper Place
New technologies are an important part of the new world of neuromarketing, but they aren’t the most important part. Neuromarketing vendors do their clients a disservice when they emphasize technology issues over business issues in their own marketing and sales communications. For example, fMRI vendors like to say that using EEG is like trying to follow a football game while standing outside the stadium. And EEG vendors like to respond by saying that using fMRI is like taking a picture of the football field after the game is over. In some sense, both statements are correct (and somewhat clever), but they exaggerate the limitations of technologies that have both produced breakthrough findings and insights about the brain and support thousands of active researchers around the world.
 Marketers don’t consider these distinctions to be big selling points. They see them as smoke screens. They would much rather have vendors differentiate themselves by showing what marketing questions they can answer — and why those answers are worth paying for.
The value in neuromarketing is first and foremost a function of three things:
![]() Asking the right business question: Determining what marketing outcomes you want to measure
Asking the right business question: Determining what marketing outcomes you want to measure
![]() Identifying the right consumer responses to measure: Matching the need for knowledge with the right measures and metrics to meet the need
Identifying the right consumer responses to measure: Matching the need for knowledge with the right measures and metrics to meet the need
![]() Designing the right kind of test to answer that question: Creating an appropriate experimental or field study design that makes the right comparisons, uses the right controls, collects the right data, and applies the right statistical tests to answer your question with a level of confidence you can use to make the best possible business decisions based on what you’ve learned
Designing the right kind of test to answer that question: Creating an appropriate experimental or field study design that makes the right comparisons, uses the right controls, collects the right data, and applies the right statistical tests to answer your question with a level of confidence you can use to make the best possible business decisions based on what you’ve learned
Measuring the brain simply to measure the brain is not enough to justify the adoption of new neuromarketing research approaches. The “gee whiz” element in brain research techniques dissipated long ago. “What your brain is doing” while watching an ad or experiencing a product is meaningless without a connection to either a decision or a behavior, or preferably both.
Technologies are means to an end. The new model of the intuitive consumer introduced in Chapter 2 gives us lots of new questions to ask. Neuromarketing gives us lots of new technologies to answer those questions. Only by bringing the questions and the technologies together to provide answers that have an impact in the marketplace will neuromarketing justify its place in the toolkit of market-research methodologies.
If you use neuromarketing insights or principles to ask the right questions and design the right test, you can sometimes find your answer without needing to apply the more advanced (and expensive!) technologies described in this chapter. Sometimes you can just observe consumer behavior or use less elaborate testing to make a reasonable determination of what’s going on in your consumers’ brains, why they’re acting the way they are, and what implications this has for your marketing, advertising, product design, store layout, and so on. We cover these additional techniques in the next chapter.