
Chapter 7
Education as a Service and Educational Service Systems
According to the American Heritage® Dictionary of the English Language (http://www.ahdictionary.com), education essentially is defined as follows:
- The act or process of educating or being educated when it is referred to a series of activities for imparting or acquiring knowledge.
- The knowledge or skill obtained or developed through a learning process when it is suggested as learning outcomes.
- A program of instruction of a specified kind or level, such as driver training, and K-12 and college education, when it is implied to types or purposes of learning;
- The field of study that is concerned with the pedagogy of teaching and learning if it indicates a discipline.
- An instructive or enlightening experience when it is meant as human cognitive development that improves one's ability or competency over the period.
Evidently, the implied meaning of education surely varies with the context in which a given type of education takes place or the subject that one genuinely wants to learn at a given time. In this book, education mainly implies the act or process of imparting or acquiring knowledge through school systems. In particular, we are interested in education in schools where formal educational service is offered.
More specifically, at a given education institution, instructors are education service providers and learners are education service consumers. Administrators and many daily support staff manage and assist instructors and learners to carry out a series of activities relevant to imparting and acquiring knowledge. The marketed programs and courses are the service products that will be offered by the institution. The learning outcomes might be accessed by items, such as how much the learners will learn and what impact the acquired knowledge can have on their lives at work or home in the short term or the long run.
In this chapter, we will first review systems of schooling from the Service Science's perspective. Then, we use two different examples to show how education service systems can be explored by applying the principles of Service Science. In the first example, we apply a systems performance approach to understand the dynamics of an educational school system as a whole. We focus on the mechanisms that can be practically and effectively utilized to adjust school policies and administrative practices for the purpose of improving the effectiveness of education service systems. In the second example, we use a high school off-campus education enrichment study to show how a systems approach can be adopted to reengineer off-campus learning processes to improve students' aptitude to science, technology, engineering, and mathematics over time.
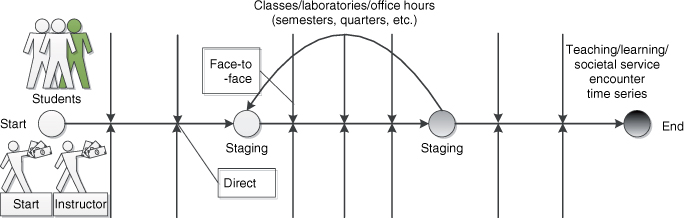
Figure 7.1 Teaching/learning service encounters in knowledge transformation processes.
7.1 Systems of Schooling: Service Science's Perspective
Regardless of the scope and goal of a school system, the school system is typically institutionalized with an array of curricula with the support of a variety of teaching and learning resources. At a given school, administrators, instructors, and staff are the people who provide educational services; learners then are the people who consume the provided educational services. Surely, individual learners' purposes for pursuing education vary, so does the school's. However, pursuit of effective learning should be the common goal for both the learners and the school.
Education surely is a service. Schools are educational service systems. On the basis of the discussion on Service Science we have had so far, the systems and holistic perspective of education service must include the following fundamental understandings (Figure 7.1):
- Education service is indeed a knowledge transformation process, delivering the values that are beneficial for both service providers and learners.
- Education service through a knowledge transformation process is centered at people rather than service products themselves.
- An education service provision system is a sociotechnical service system. It might consist of a number of interrelated and interacting domains systems empowered by a variety of resources, which are coordinated in a collaborative manner to help realize their common goal.
- The realized value of an education service is the total value that is perceived from learning outcomes derived from the education service. Note that the perception of education service by a learner is cumulative. In other words, the realized value of an education service is cumulatively perceived from a series of service encounters throughout the service lifecycle.
Regardless of private or public schools, systems of schooling should have no exception in organizational and operations management when compared to any other service systems. By complying with the principles of Service Science, we understand that systems of schooling should be managed and operated in delivering the daily educational needs to the students we serve. Hereinbelow, using a public high school as an example, we identify service encounters that are essential throughout the education service lifecycle.
At the market, discovery, and strategy phase, a list of courses might be developed based on the current and future market (i.e., students) needs. The participants in the discussion on new courses should include administrators, teachers, students, and parents. In addition to traditional ways of collecting the references from certain general guidelines provided by federal and state educational agencies and some course works available from the colleagues, peer-school websites, and well-recognized teaching materials in the field, the inputs that should be brought in could also come from market surveys and analyses, which could be well aggregated through online social media, such as school blogs, Facebook, or Twitter. Understanding and discovering the market and changing needs play a critical role in identifying the courses that should be developed and offered to students. A school's board and its administrators surely and significantly contribute to the strategic development for all the new courses that are planned to be developed and offered.
At the design and development phase, in general, course curricula will be revised and enriched as time goes. Unless a course is completely delivered, it is typical that its curriculum will keep changing to some extent. Surely, each revision will be the outcome of numerous discussions and meetings among related course stakeholders. In other words, although teachers are most likely the main contributors to the design and development of new courses, they revise and enrich contents and learning materials for each course by enhancing the adopted teaching pedagogies through collecting more suggestions and feedbacks from course stakeholders on an ongoing basis. Current and prospective students' viewpoints, if they can be collected in any way, should be thoroughly considered.
At the delivery, operations, and monitoring phases, courses are offered and delivered face-to-face, virtually, or in a hybrid manner. It takes time for the covered knowledge to get imparted and acquired. To the learners, the process of knowledge transformation consists of many interactive learning activities. On the basis of the principles of Service Science, knowledge acquired by students is essentially cocreated by the instructor and students. In other words, effective interactions within the community of the instructor and students substantially impact the learning outcomes. Figure 7.2 shows the classic residential teaching/learning service encounters experienced throughout a given learning period. The interactions include class discussions, questions and answers during after-class office hours, and other learning engagement activities. Students always appreciate these interactions with the instructor and other students on campus.
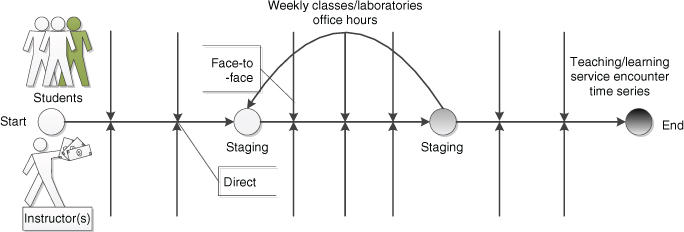
Figure 7.2 Classic residential teaching/learning service encounters.
At the optimization and improvement phase, all participants should be involved to some degree. However, the instructor and administrators mainly contribute to this stage although suggestive and constructive feedbacks could be further collected from students and parents. The instructor and administrators must analyze all collected data, understanding the weakness of the delivered course and identifying mechanisms to make changes in organizational structures and service operations for improved learning outcomes and stakeholders' satisfaction. Of course, they should take actions on the identified changes, monitor the changes, and ensure that the implemented changes indeed improve the offered service.
Residential instructor-led courses have proven effective in education (Figure 7.2). With the fast development of Internet and communication technologies, online courses (Figure 7.3) emerge as they provide a new learning model, called any time, any place, and any pace education paradigm. Indeed, by leveraging the strengths of both instructor-led and virtual courses, the blended approach (Figure 7.4) gradually becomes a popular educational model on campus.
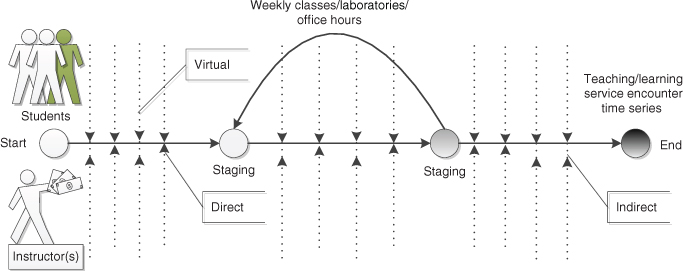
Figure 7.3 Online-based teaching/learning service encounters.
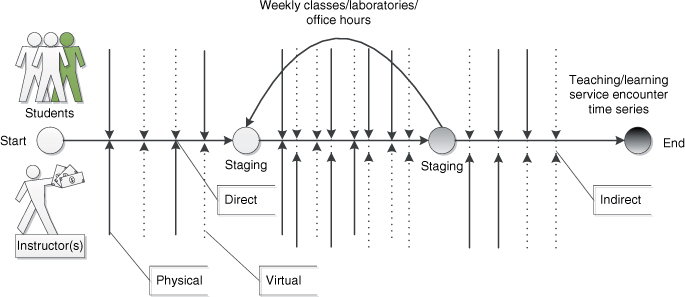
Figure 7.4 Blended teaching/learning service encounters.
When we study a specific topic in education, we must stay focused and pay much attention to the areas we can deal with as the available resources might be limited for the time being when we conduct the study. Surely, each study will have its unique objective. Education service delivery mechanisms change as time goes, which certainly vary with the service contexts. However, service encounters are always centered regardless of the changes of service delivery mechanism. Face-to-face education paradigms are essential for the resident pedagogical engagement. When the traditional pedagogical engagement is weakening in the virtual learning setting, we must explore state-of-the-art alternatives to compensate for the missing essential components and ensure that we can deliver education service that continuously meets the needs of learners.
7.2 A Quality Control and Management Case Study for Resident Education: The Systems Perspective
Whether a service is attractive and sustainable highly depends on a variety of factors, including what the service is in terms of what it offers to meet the needs of prospective customers, how it is delivered, and whether it meets the needs of customers during its service transformation process. In general, education is a service. College education surely is a service. Compared to a traditional resident college education, education service focusing on professionals is more challenging, given that professional students have varieties of backgrounds, work experiences, and expectations. In other words, for a given education program, the backgrounds of the student body in a school change fast, so do their expectations. Therefore, cocreation processes in building and managing a competitive program play a critical role in ensuring educational service offered and delivered to be competitive and satisfactory.
Empirical studies of education service quality using exploratory and confirmatory analyses have been conducted in academia for over several decades (Hill, (1995); Gruber et al., (2010); Duarte et al., (2012), aimed at gaining insights of higher education management through understanding the education market changes and identifying factors that influence education service quality and students' successes during their studies in college. The following example is an empirical study of the education quality for a resident professional school, aimed at identifying administrative actions for the potential of improving students' satisfaction.
7.2.1 A Typical System-Based Empirical Approach to Explore a Service System
Structural equation models (SEMs) have been widely used to study the social and/or economic behavior of organizations (Bollen, (1989); Kline, (2005); Martensen and Gronholdt, (2003); Raykov and Marcoulides, (2006). As compared to many covariance-based modeling approaches, the partial least squares approach to SEM (PLS SEM) is a soft modeling approach with relaxation of measurement distribution assumptions (Chin et al., (2003). PLS SEM requires only a small size of measurement samples and tolerates certain measurement errors. It is a perfect analytical model for this case study because our sample size can be small when compared to many other types of empirical studies adopted in the commercial world (Wang et al., (2009).
By focusing on providing customer (i.e., students) satisfaction excellence, the following SEM model is mainly applied to understand the operational and managerial structure of the service system with a variety of latent variables (i.e., constructs) (Figure 7.5). Manifest and latent variables for analyzing education programs in school vary with service contexts. Table 7.1 gives relevant indicators for manifest and latent variables used in this professional program exploratory example. This exploratory example aims at illustrating how an SEM can be applied to the modeling of an education service system. In particular, we analyze education service quality at the institutional level of a graduate professional study school. Through pinpointing weak areas across the studied service system, we recommend appropriate actions to school's administrators. Ultimately, after the suggested actions are properly and promptly carried out, the program quality and students' satisfaction can be significantly improved over time.
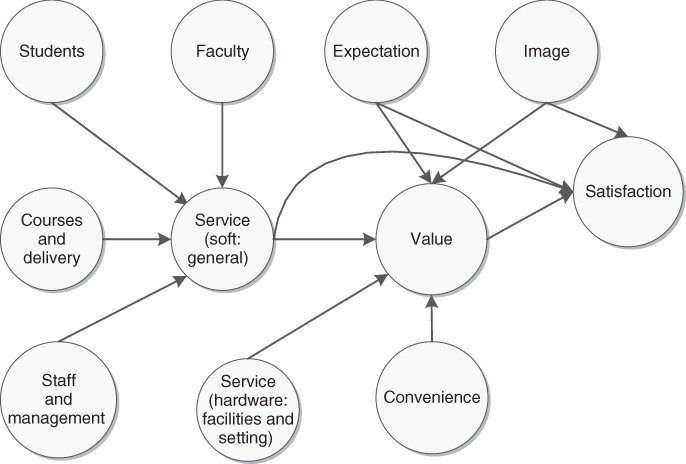
Figure 7.5 Structural equation modeling of education programs.
Formative and reflective measurements as two different measurement models have been widely used to construct SEMs (Fornell and Bookstein, (1982); Bollen and Lennox, (1991); Coltman et al., (2008); Diamantopoulos et al., (2008); Edwards, (2011). If measures are treated as causes of constructs, we apply formative measurements in modeling; if the constructs are viewed as causes of measures, we apply reflective measurements in modeling. Reflective measurement modeling is popularly used in developing a latent measurement model, which essentially is the principal factor model. In a reflective measurement model, covariation among the measures or indicators is caused by, and therefore reflects, variation in the underlying latent construct (Jarvis et al., (2003). The choice of formative and reflective measurements has been never easy as it depends on the dimensionality, internal consistency, identification, measurement error, construct validity, and causality of the subjects under study. Reflective measurement models surely have been applied widespread in practice over decades, while formative measurement models begin to receive more and more attention from researchers and practitioners.
By merging studies in the psychology, social science, management, and marketing fields to examine a variety of issues concerning the conceptualization, estimation, and validation of formative measurement models, Diamantopoulos et al. (2008) advocate that formative measurement models are advancing over the years. Coltman et al. (2008) demonstrate the viability of formative measurement modeling of two applications. However, Edwards (2011) criticizes that the presumed viability of formative measurement is a fallacy and concludes that formative measurement is not a viable alternative to reflective measurement.
Regardless of types of measurement models, it is essential for all researchers to justify their choice of measurement models (Jarvis et al., (2003). Coltman et al. (2008) articulate that using an incorrect measurement model for a service system undermines the content validity of constructs, which could misrepresent the structural relationships between constructs and lower or even put doubts on the usefulness of the identified insights of the explored service system. Therefore, the validity of models should be confirmed so that the insights of service systems in light of the system's principal factors and relationships, behavior, and performance can be meaningful and thus can be practically applied to the decision making in business operations and management by a service organization.
Table 7.1 Manifest and Latent Variables for Analyzing Education Programs in School
| Latent Variables | Mediators | Indicators (Formative/Reflective) |
| Image |
|
|
| Expectation |
|
|
| Service | Student |
|
| Faculty |
|
|
| Staff and administration |
|
|
| Courses and delivery |
|
|
| (In general) |
|
|
| Facility and settings |
|
|
| Convenience factors |
|
|
| Perceived value |
|
|
| Satisfaction |
|
The modeling validity should be applied to both measurement and structural models. There are a variety of discussions on how to validate and report constructed system models. The following validations are well utilized in the literature (Henseler et al., (2008). In particular, they are required as essential reports for publications when PLS SEMs are applied to model the dynamics of service systems:
- Evaluating reflective measurement models
- Factor Loadings. Factor loadings should be higher than 0.7. Otherwise, either the factors might be insignificant or the method of collecting the relevant data set of the factors should be revised.
- Composite Reliability
 .
.  , where
  is the component loading to an indicator and
  . The component reliability as a measure of internal consistency should be higher than 0.6.
 - Average Variable Extracted (AVE).
 , where
  is the component loading to an indicator and
  . The average variable extracted should be higher than 0.5.
 - Discriminant Validity. The extracted average variances of the latent variable should be greater than the square of the correlations among the latent variables. In other words, more variance should be shared between the latent variable component and its block of indicators than with another block representing a different block of indicators. Cross-loadings can be another test for discriminant validity, which will testify that each block of indicators loads higher for its respective latent variable than as indicators for other latent variables. If an indicator has a higher correlation with another latent variable, then the appropriateness of the model may be reconsidered.
- Evaluating formative measurement models
- Significance of Weights. Estimates for formative measurement models should be at significant levels. This significance can be evaluated using the bootstrapping procedure.
- Multicollinearity. Manifest variables in a formative block must be tested for multicollinearity. The variance inflation factor can be used for such test. Values that are higher thus reveal a critical level of multicollinearity, thereby indicating that the measurement model must be reconsidered.
- Evaluating the structural models
 of Latent Endogenous Variable.
  – results of 0.67, 0.33, and 0.19 for latent endogenous variable in the structural model are described as “substantial,” “moderate,” and “weak” (Chin, (1998), p. 323).
- Estimates for Path Coefficients. The estimated values for path relationships in the structural model should be at significant levels. This significance can be evaluated using the bootstrapping procedures.
Note that there are many other empirical methods that can be adopted in modeling people-centric service systems. In the following sections, we present step by step how PLS SEM is adopted to investigate the education service quality at the institutional level of a graduate professional study school (i.e., an education service system). We focus on pinpointing weakness across the studied service system, and aim at identifying appropriate actions for recommendation to school's administrators.
7.2.2 Questionnaires and Responses
As indicated earlier, education service in the professionals market is more challenging than focusing on traditional resident education service in which students are most likely engaged in full-time studies. In general, a professional school that serves part-time adult students faces more challenges in addition to typical ones faced by full-time resident college programs. For example, students in the professionals market typically have a variety of backgrounds, work experiences, and expectations. It could be even more challenging when students are financially sponsored by their employers because of the fact that their expectations vary with factors including their employers' reimbursement policies. Hence, the enrollments or attendances in the professional school could be substantially influenced by their employers' reimbursement policies, business travel schedules, and even their families' matters.
We know that a competitive and sustainable service of a service system mainly relies on customers' satisfaction, which highly depends on how effective the service system meets their expectations in a timely manner. Education in the professionals market is of no exception. To act on identified issues to meet students' needs at a graduate professional school, we, the school as a service provider, should have an effective way to answer the following questions from time to time:
- Do we really know how we perform in terms of meeting their needs?
- What are the main obstacles in achieving students' satisfaction excellence, so we can transform and outperform our competitors?
- Given the limited resources (which restrict us from having more programs/tracks), what will be the best approach to transform our educational service system (i.e., institution) into a more adaptable, responsive, and competitive one?
To analyze whether the offered education programs meet the students' needs and understand what they want over time, the best approach will be to capture what the served students think in real time. Although online social media using Facebook, blogs, Twitter, Google+, and others are attractive, it is still risky of missing the real voices from students as the technologies in support of mining the real insights of the served students' dynamics and thinking are not mature. Social media will be surely the best way to use down the road when the related technologies are fully enabled. At present, cross-sectional and longitudinal surveys using well-defined questionnaires prove effective. As a result, the appended questionnaire in this chapter is used, which helps us to collect sufficient data from time to time. It indeed demonstrates that well-executed surveys and responses allow us to analyze what the status of our educational service system is in light of meeting our students' needs in a timely manner.
Student participations play a key role in completing this investigation. A web site was designed and deployed. Current students are asked to fill in the web page questionnaire during the middle of each class. As usual, the questionnaire is designed to be volunteer based. No identity and confidential data are required. We clearly indicate that collected data are solely used for a research and/or internal decision-making reference purpose.
This conducted study aims at investigating a scientific approach to model the effectiveness of such an education service system. By focusing on finding ways to provide customer (i.e., students) satisfaction excellence, we identify certain factors substantially contributing to adversely affecting the quality of education and students' satisfaction and then determine how those priority issues should be addressed in order to transform the service system for competitive advantage. We also investigate certain measures and mechanisms to ensure that the proposed approach indeed works in terms of meeting our students' needs. Ultimately, as time goes and the job market and business environment change, we can always take a smarter action so that we can keep this graduate professional school as an education system more competitive.
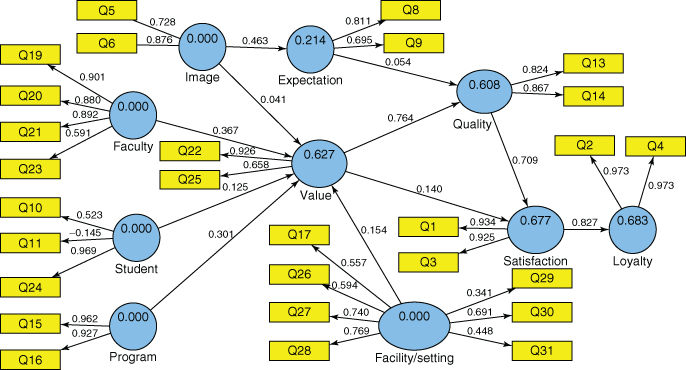
Figure 7.6 The first SEM: modeling the program quality of a graduate professional school.
7.2.3 Modeling and Analytics
Validity and reliability of instruments are critical in questionnaire-based empirical studies. Validity of instruments refers to whether our questionnaire that is used will actually measure what we want to measure. Reliability refers to two things. First, reliability means we would get similar results if we repeat our questionnaire soon afterwards with the same class. The “repeatability” of the questionnaire should be high. This is called test–retest reliability. The other aspect of reliability concerns the consistency among the questions. Because all the questions relate to the program quality in the school, we would expect all the answers to be fairly consistent when answered by numerous different groups of students.
Because we sent the request to a small group of students at the very beginning, we collected only 58 responses. The sample size surely was too small such that no meaningful insights could be concluded and then delivered to the administrators. The first step indeed was to check the validity and reliability of instruments and the validity of our proposed systems dynamics and behavioral model. We use SmartPLS tool to run all SEMs in this book (Ringle et al., (2005). Using these 58 responses, we create our first SEM that models the program quality of the graduate professional school under study (Figure 7.6).
Note that we have to assess the models, including both the measurement and structural models, before we can really use the interpreted insights from the modeling to arrive at a conclusion on the health of the service system. Table 7.2 provides the assessment data of the measurement and structural models during the first round of modeling using the collected 58 responses. It shows that both the measurement and structural models seem marginally appropriate.
Table 7.2 The Assessment Data of the Measurement and Structural Models (Round 1)
| AVE | Composite Reliability | Cronbach's Alpha | ||
| Expectation | 0.569852 | 0.724811 | 0.213610 | 0.248591 |
| Facility/setting | 0.372048 | 0.796720 | 0.721068 | |
| Faculty | 0.682682 | 0.893514 | 0.836747 | |
| Image | 0.648871 | 0.785741 | 0.469362 | |
| Loyalty | 0.946254 | 0.972385 | 0.683233 | 0.943203 |
| Program | 0.892106 | 0.942960 | 0.881620 | |
| Quality | 0.715262 | 0.833900 | 0.597523 | 0.603405 |
| Satisfaction | 0.864042 | 0.927061 | 0.675709 | 0.842846 |
| Student | 0.411014 | 0.511824 | 0.011536 | |
| Value | 0.651490 | 0.785893 | 0.616824 | 0.491644 |
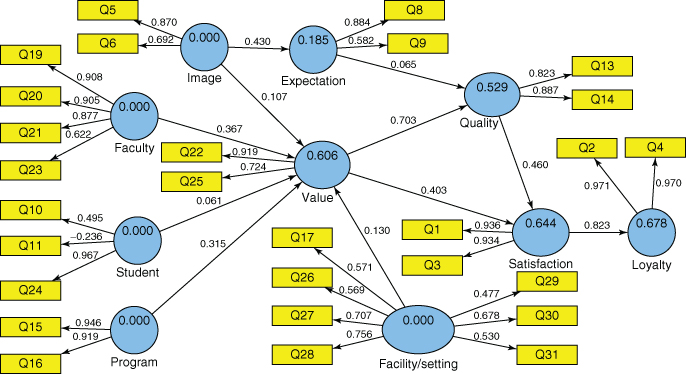
Figure 7.7 The second SEM: modeling the program quality of a graduate professional school.
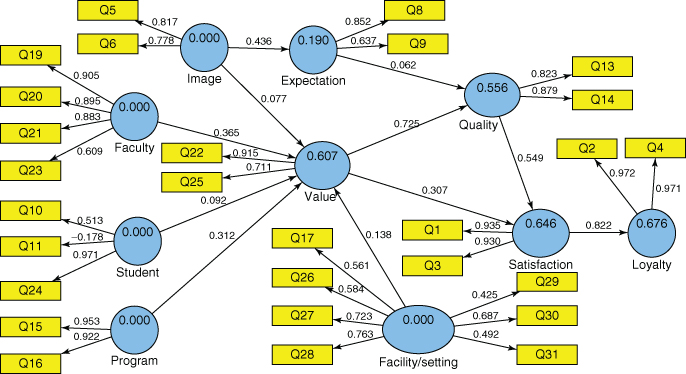
Figure 7.8 The overall SEM: modeling the program quality of a graduate professional school.
Table 7.3 The Assessment Data of the Measurement and Structural Models (Round 2)
| AVE | Composite Reliability | Cronbach's Alpha | ||
| Expectation | 0.560510 | 0.709870 | 0.184996 | 0.238394 |
| Facility/setting | 0.384121 | 0.810046 | 0.740291 | |
| Faculty | 0.699809 | 0.901327 | 0.849513 | |
| Image | 0.618270 | 0.761790 | 0.395998 | |
| Loyalty | 0.942398 | 0.970345 | 0.677691 | 0.938885 |
| Program | 0.870564 | 0.930790 | 0.852700 | |
| Quality | 0.731662 | 0.844860 | 0.528686 | 0.636544 |
| Satisfaction | 0.874561 | 0.933084 | 0.643735 | 0.856577 |
| Student | 0.411889 | 0.459742 | 0.145019 | |
| Value | 0.684238 | 0.810396 | 0.606353 | 0.564130 |
We resent the request to more groups of students after we finished our first round of modeling and we collected 79 more responses. Figure 7.7 shows the second SEM when we model the program quality of the graduate professional school using the second round of responses. Table 7.3 then presents the assessment data of the measurement and structural models during the second round of modeling using the collected 79 responses. Similar to the round 1 modeling, it shows that both the measurement and structural models again prove marginally appropriate. However, the outcomes highlighting service quality and students' satisfaction seem consistent, which indicates that the validity and reliability of instruments are well checked.
To increase the sample size of the collected responses, we combine the two rounds of surveys. Then, we use all the responses to develop our overall model for the program quality study, which is illustrated in Figure 7.8. Table 7.4 gives the assessment data of the measurement and structural models using all the collected responses. Note that it is necessary for researchers to continuously refine the instruments and models until the adopted instruments and models are completely validated if the study is really used to serve organizations and assist administrators to make informed decisions in facilitating organizational business development and improving operations management. Here, we simply use this example to demonstrate the applicability of the presented approach to model the dynamics and behavior of service systems.
7.2.4 Analytics and Decision-Making Supports
Given that a competitive and sustainable service relies on customers' satisfaction, we must keep our service system responsive and effective in order to meet students' expectations from time to time. As indicated earlier, the purpose of this modeling is to assist the administration to identify the overall campus-wide strategic and tactic actions to further improve school's program quality on an ongoing basis. Capturing systems' dynamics and ensuring the good understandings of the insights should help answer the following questions discussed earlier in a timely manner:
- Do we really know how we perform in terms of meeting their needs?
- What are the main obstacles in achieving students' satisfaction excellence, so we can transform and outperform our competitors?
- Given the limited resources (which restrict us from having more programs/tracks), what will be the best approach to transform our educational service system (i.e., institution) into a more adaptable, responsive, and competitive one?
Table 7.4 The Assessment Data of the Measurement and Structural Models (Overall)
| AVE | Composite Reliability | Cronbach's Alpha | ||
| Expectation | 0.565523 | 0.718315 | 0.190307 | 0.243258 |
| Facility/setting | 0.379210 | 0.804911 | 0.732110 | |
| Faculty | 0.692748 | 0.898164 | 0.844313 | |
| Image | 0.635863 | 0.777301 | 0.428032 | |
| Loyalty | 0.944123 | 0.971259 | 0.676171 | 0.940820 |
| Program | 0.879225 | 0.935716 | 0.864524 | |
| Quality | 0.724474 | 0.840083 | 0.555590 | 0.622111 |
| Satisfaction | 0.868986 | 0.929901 | 0.646310 | 0.849278 |
| Student | 0.412880 | 0.492218 | 0.096273 | |
| Value | 0.670964 | 0.800600 | 0.606728 | 0.535843 |
To better understand the behavior and systems performance of this explored school, we remove those indicators, either those that have little impact on the desirable outcomes or the ones there is nothing the school can do about at the time of investigation. As a result, by simply focusing on highly influential factors or potential actions that can be done to improve the levels of program quality and student satisfaction, we thus develop a new SEM as illustrated in Figure 7.9. Table 7.5 shows the assessment data of the measurement and structural models, in which constructs are mainly reflected by influential or actionable indicators. Table 7.6 lists the results of latent variable correlations in the focus model illustrated in Figure 7.9.
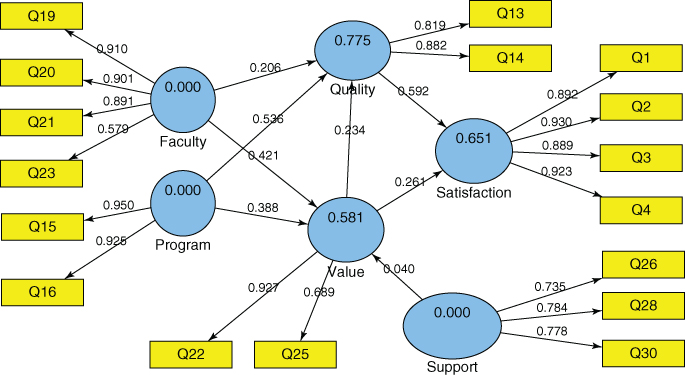
Figure 7.9 A focus SEM that models the program quality in a graduate professional school.
Table 7.5 The Assessment Data of the Measurement and Structural Models (A Focus SEM)
| AVE | Composite Reliability | Cronbach's Alpha | ||
| Faculty | 0.692209 | 0.897357 | 0.844313 | |
| Program | 0.879668 | 0.935971 | 0.864524 | |
| Quality | 0.724094 | 0.839783 | 0.774870 | 0.622111 |
| Satisfaction | 0.825928 | 0.949928 | 0.650854 | 0.929633 |
| Support | 0.586977 | 0.809888 | 0.654831 | |
| Value | 0.666706 | 0.796586 | 0.581142 | 0.535843 |

Figure 7.10 The bootstrapping results of path relationships in the focus SEM.
Table 7.6 Latent Variable Correlations in the Focus SEM
| Faculty | Program | Quality | Satisfaction | Support | Value | |
| Faculty | 0.692209 | |||||
| Program | 0.673252 | 0.879668 | ||||
| Quality | 0.731086 | 0.836926 | 0.724094 | |||
| Satisfaction | 0.699606 | 0.756430 | 0.787987 | 0.825928 | ||
| Support | 0.447598 | 0.510850 | 0.523520 | 0.560359 | 0.586977 | |
| Value | 0.700608 | 0.692432 | 0.749747 | 0.705272 | 0.427105 | 0.666706 |
To pinpoint how individual factors impact the outcomes of a modeled service system, we must estimate path coefficients in the developed SEM. The estimated values for path relationships in the structural model should be at significant levels. As discussed earlier, this significance can be evaluated using the bootstrapping procedures that are provided in SmartPLS (Ringle et al., (2005). We run bootstrapping with 100 cases and 300 samples. The corresponding bootstrapping results are shown in Figure 7.10. Table 7.7 lists the path coefficients (Mean, STDEV, T-values) for the developed SEM.
From Table 7.7, we find that we fail to pass the test as the path coefficient Value to Quality lacks the necessary confidence level. Therefore, we must revise our model to ensure that the path coefficient can pass the t-test. The final SEM is shown in Figure 7.11. Table 7.8 shows the assessment data of the final measurement and structural models, in which constructs are mainly reflected by influential or actionable indicators. Table 7.9 lists the results of latent variable correlations in the final model illustrated in Figure 7.11.
Cross-loadings are often used to show the discriminant validity of a reflective measurement model. Table 7.10 lists the results of cross-loadings in the final model illustrated in Figure 7.11. It is confirmed that each block of indicators loads higher for its respective latent variable than indicators for other latent variables.
We run bootstrapping with 100 cases and 300 samples using the final SEM. The corresponding bootstrapping results are shown in Figure 7.12. Table 7.11 lists the path coefficients (Mean, STDEV, T-values) for the final SEM. This bootstrapping test shows that the estimated values for path relationships in the final structural model are indeed at significant levels. Therefore, both the final measurement and structural models are valid and reliable.
To assist decision makers with insights of service operations and management, we can convert the performance index of a latent variable using estimates on a 1-to-100 scale basis for easy human interpretation. Thus, a weighted average of scores from corresponding measurement variables is used by converting the original 7-point scale to a 100-point scale. By converting the results shown in Figure 7.11, we show the converted results of the final SEM in Figure 7.13, which are illustrated using estimates on a 1-to-100 scale basis. In addition to the
Table 7.7 Path Coefficients (Mean, STDEV, T-Values) Report for the Focus SEM
| Original Sample (O) | Sample Mean (M) | Standard Deviation (STDEV) | Standard Error (STERR) | T-Statistics (|O/STERR|) | |
| Faculty → Quality | 0.206184 | 0.199749 | 0.075704 | 0.075704 | 2.723537 |
| Faculty → Value | 0.421154 | 0.415019 | 0.094873 | 0.094873 | 4.439138 |
| Program → Quality | 0.535961 | 0.541161 | 0.061804 | 0.061804 | 8.672009 |
| Program → Value | 0.388348 | 0.399482 | 0.102851 | 0.102851 | 3.775838 |
| Quality → Satisfaction | 0.591970 | 0.586952 | 0.106458 | 0.106458 | 5.560609 |
| Support → Value | 0.040210 | 0.079948 | 0.058911 | 0.058911 | 0.682567 |
| Value → Quality | 0.234177 | 0.235352 | 0.077571 | 0.077571 | 3.018858 |
| Value → Satisfaction | 0.261444 | 0.269461 | 0.105657 | 0.105657 | 2.474450 |
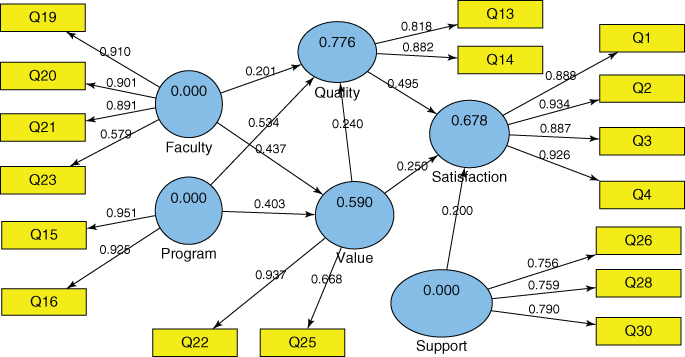
Figure 7.11 The final SEM that models the program quality in a graduate professional school.
Table 7.8 The Assessment Data of the Measurement and Structural Models (The Final SEM)
| AVE | Composite Reliability | Cronbach's Alpha | ||
| Faculty | 0.692226 | 0.897372 | 0.844313 | |
| Program | 0.879634 | 0.935952 | 0.864524 | |
| Quality | 0.724072 | 0.839767 | 0.775709 | 0.622111 |
| Satisfaction | 0.826129 | 0.949988 | 0.678209 | 0.929633 |
| Support | 0.590186 | 0.811982 | 0.654831 | |
| Value | 0.662208 | 0.792283 | 0.590154 | 0.535843 |
Table 7.9 Latent Variable Correlations in the Final SEM
| Faculty | Program | Quality | Satisfaction | Support | Value | |
| Faculty | 0.692226 | |||||
| Program | 0.673304 | 0.879634 | ||||
| Quality | 0.731001 | 0.837117 | 0.724072 | |||
| Satisfaction | 0.697838 | 0.755955 | 0.786953 | 0.826129 | ||
| Support | 0.438959 | 0.512730 | 0.516582 | 0.560036 | 0.590186 | |
| Value | 0.708142 | 0.696983 | 0.755148 | 0.707349 | 0.418563 | 0.662208 |
path coefficients and performance indices, Figure 7.13 also provides the weights of individual indicators. For the sake of convenience, we have all the weights shown in Figure 7.13 listed in Table 7.12. Total effects in the final SEM is then provided in Table 7.13, which essentially present how much one perceived construct might impact another perceived construct in the investigated service system.
Table 7.10 Cross-Loadings in the Final SEM
| Faculty | Program | Quality | Support | Value | Satisfaction | |
| Q1 | 0.660608 | 0.683556 | 0.732008 | 0.428316 | 0.703793 | 0.888106 |
| Q13 | 0.593550 | 0.544060 | 0.818422 | 0.409559 | 0.593901 | 0.645482 |
| Q14 | 0.648777 | 0.854105 | 0.882230 | 0.466578 | 0.685985 | 0.693108 |
| Q15 | 0.677687 | 0.950655 | 0.844523 | 0.454466 | 0.728331 | 0.722632 |
| Q16 | 0.576694 | 0.924945 | 0.714606 | 0.514630 | 0.564128 | 0.694342 |
| Q19 | 0.909940 | 0.706526 | 0.755019 | 0.379925 | 0.709701 | 0.697847 |
| Q2 | 0.592926 | 0.688390 | 0.700471 | 0.608285 | 0.616795 | 0.933561 |
| Q20 | 0.900549 | 0.529666 | 0.645550 | 0.310709 | 0.597193 | 0.603205 |
| Q21 | 0.891449 | 0.582194 | 0.638540 | 0.416317 | 0.580035 | 0.612982 |
| Q22 | 0.753876 | 0.704682 | 0.770847 | 0.329745 | 0.936786 | 0.708534 |
| Q23 | 0.579003 | 0.361575 | 0.283688 | 0.398547 | 0.433970 | 0.334659 |
| Q25 | 0.281010 | 0.355895 | 0.369957 | 0.412342 | 0.668468 | 0.375278 |
| Q26 | 0.249149 | 0.428591 | 0.279704 | 0.755613 | 0.263120 | 0.384230 |
| Q28 | 0.484586 | 0.372700 | 0.500332 | 0.758757 | 0.382257 | 0.473021 |
| Q3 | 0.672891 | 0.687021 | 0.717865 | 0.461890 | 0.649054 | 0.887431 |
| Q30 | 0.252472 | 0.385911 | 0.387386 | 0.789870 | 0.306630 | 0.423995 |
| Q4 | 0.611125 | 0.689025 | 0.710416 | 0.535686 | 0.601131 | 0.925588 |
Apparently, we can directly and indirectly collect adequate measurements of a service system that truly and timely capture the insights and dynamic behaviors of the service operations in a school. If appropriate information systems and services are well deployed (Figure 7.14), the presented approach should provide real-time business analytics to the administration in a school, resulting in that the administration can make informed decisions and take prompt and optimal actions in keeping the provided education service attractive, competitive, and satisfactory.
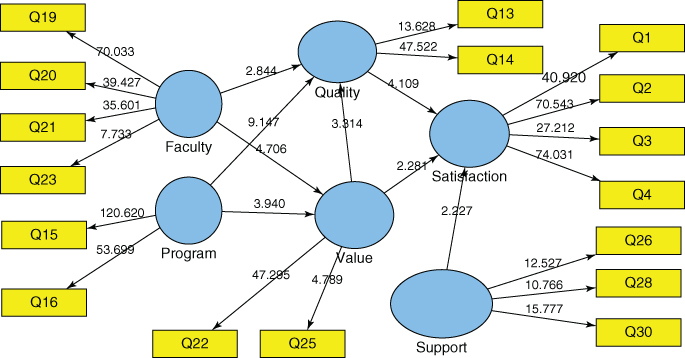
Figure 7.12 The bootstrapping results of path relationships in the final SEM.
Table 7.11 Path Coefficients (Mean, STDEV, T-Values) Report for the Final SEM
| Original Sample (O) | Sample Mean (M) | Standard Deviation (STDEV) | Standard Error (STERR) | T-Statistics (|O/STERR|) | |
| Faculty → Quality | 0.201083 | 0.199764 | 0.070711 | 0.070711 | 2.843728 |
| Faculty → Value | 0.436945 | 0.440188 | 0.092844 | 0.092844 | 4.706211 |
| Program → Quality | 0.534113 | 0.532635 | 0.058390 | 0.058390 | 9.147273 |
| Program → Value | 0.402786 | 0.407524 | 0.102226 | 0.102226 | 3.940169 |
| Quality → Satisfaction | 0.495082 | 0.487465 | 0.120478 | 0.120478 | 4.109310 |
| Support → Satisfaction | 0.199684 | 0.217621 | 0.089650 | 0.089650 | 2.227361 |
| Value → Quality | 0.240485 | 0.243602 | 0.072562 | 0.072562 | 3.314193 |
| Value → Satisfaction | 0.249909 | 0.246934 | 0.109539 | 0.109539 | 2.281449 |
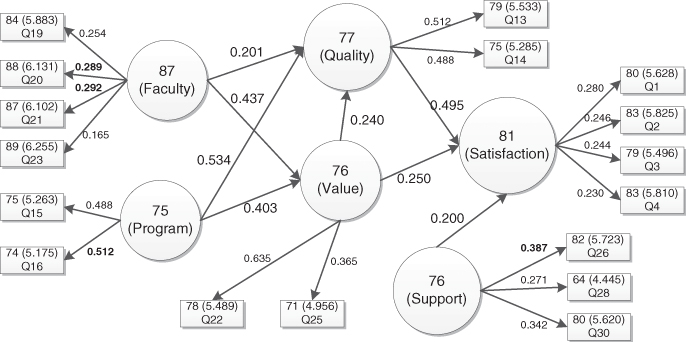
Figure 7.13 The final SEM that is illustrated using estimates on a 1-to-100 scale basis.
Table 7.12 Measurement Model Index (Weight)
| Faculty | Program | Quality | Satisfaction | Support | Value | |
| Q1 | 0.279928 | |||||
| Q13 | 0.512377 | |||||
| Q14 | 0.487623 | |||||
| Q15 | 0.488399 | |||||
| Q16 | 0.511601 | |||||
| Q19 | 0.253861 | |||||
| Q2 | 0.245576 | |||||
| Q20 | 0.289077 | |||||
| Q21 | 0.292138 | |||||
| Q22 | 0.635362 | |||||
| Q23 | 0.164923 | |||||
| Q25 | 0.364638 | |||||
| Q26 | 0.387226 | |||||
| Q28 | 0.270559 | |||||
| Q3 | 0.243989 | |||||
| Q30 | 0.342215 | |||||
| Q4 | 0.230506 |
Table 7.13 Total Effects in the Final SEM
| Value | Quality | Satisfaction | |
| Faculty | 0.436945 | 0.306162 | 0.260771 |
| Program | 0.402786 | 0.630977 | 0.413045 |
| Quality | 0.495082 | ||
| Support | 0.199684 | ||
| Value | 0.240485 | 0.368968 |
Apparently it is not easy for us to analyze a whole service system like a school in a book. Without loss of generality, we look into a small-scale service system in our next example so that we can easily present approaches to make informed decisions and take prompt and optimal actions in adjusting the service system's dynamics for improved outcomes.
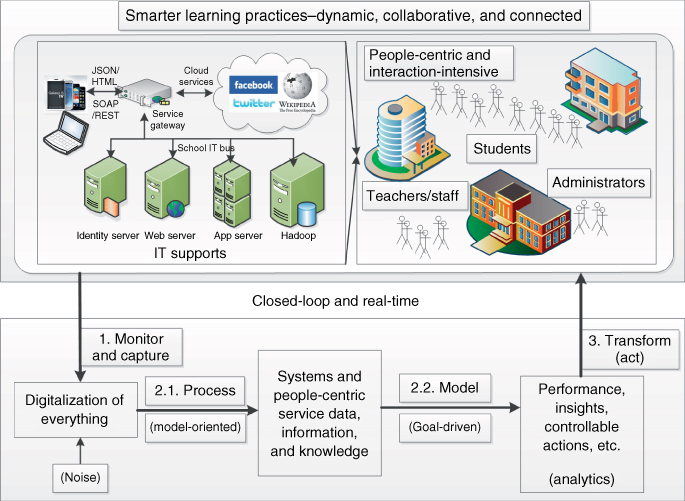
Figure 7.14 Retuning of a school service system in real time for competitive advantage.
7.3 Off-Campus Learning: An Example of High School STEM Education Enhancement
Without question, science and technology has played a more and more critical role in the world economy than ever before. However, the yearly percentage of students in the United States who choose science, technology, engineering, and mathematics (STEM) careers after their graduations from high schools continues to decline. Statistics shows that the United States now lags behind much of the world in terms of the percentage of students who want STEM careers when they join the workforce.
Mathematics is the foundation of the STEM fields as it essentially provides the knowledge and skills necessary for advancement and innovation in every other STEM field. However, the overall math competence of K-12 school students in the United States is worrisome, because many high school graduates in the United States do not possess good preparation in math to enter the workforce (Texas Instruments, (2006). For example, Saad (2005) reports, in a 2004 Gallup poll, that 37% of teens regarded math as their most difficult subject, while only 23% considered math as their favorite one. The 2006 Program for International Student Assessment (PISA) corroborated this, showing that the performance of 15-year-old students in math literacy in the United States was 24 points lower than the global average. At the 90th percentile, the United States was 22 points below the global average. These scores ranked the United States below all but six participating jurisdiction countries tested (Baldi et al., (2007).
On the basis of this observation, math performance among teens in the United States is inferior to that among teens in many other countries. This phenomenon can be attributed to many different reasons. In terms of broad sociocultural causes, a study of students with advanced math proficiency, over several decades, found that the US society does not accord mathematics with much recognition. For instance, social ostracism and ridicule make male and especially female students stay away from math as a career. Consequently, currently 80% of female math professors and 60% of male math professors hired in the past few years were born outside of the United States (Andreescu et al., (2008). In addition, family expectations, peer influences, and teacher qualifications all have a substantial impact on students' attitude to math and their math performance in schools. Interestingly, studies show that family expectations have the strongest impact on all ethnic groups when it comes to math achievement (National Center for Education Statistics, (2004); Wenglinsky, (2000); Yan and Lin, (2005); Matthews, (2007). Hence, an approach to positively changing family expectations could make a difference in improving students' overall attitude to the STEM.
Note that the US federal and state agencies and organizations have launched a variety of initiatives in the STEM education to change this situation. More specifically, many research projects on STEM education in both college and K-12 school have been conducted, and hundreds of school districts across the United States have established STEM programs since the early 1980s (NGA, (2009); NSB, (2010). More promisingly, significant attention has recently been directed to encourage and develop the talents of adolescents with interests in STEM, aimed at boosting the domestic STEM talent supply from the root (Schaefer et al., (2003); Miller and Barney Smith, (2006); Holmes et al., (2007); Atkinson et al., (2007); Qiu and Doris, (2013).
Academically, suggested solutions for improving students' math performance include a communal structure within schools, more cohesive curriculum, smaller class sizes, cooperative learning, and strategies that help students overcome math anxiety. Lee et al. (1997) discuss the results of a study focused on the elements of high school organizations that are directly related to the improved learning of mathematics and science as well as the “equity” between the first 2 years and the past 2 years of high school. The term “a mile wide and an inch deep,” first used by William Schmidt of Michigan State University, describes the US math curriculum as a vast series of topics that are covered in each grade. However, each topic is not covered in detail and little connection is made among topics. According to Roger Bybee, head of a Colorado Springs-based nonprofit science curriculum development organization, this leads to a curriculum that has no coherency. He and other educators advocate a national curriculum standard that determines core skill sets and promotes textbooks that establish connections between math topics. With a national curriculum, students will be pushed to master the core content and be evaluated as per established standards (Brown and Brown, 2007).
In addition, smaller class sizes, cooperative learning, and less math anxiety all play a role in improving individual student performance. Rice (1999) conducts a study on class sizes and analyzed their impacts on students' performance. She unveils that class size had a greater impact on math classes than science classes, inversely affecting three instructional variables, namely, small group time, innovative instructional practices, and whole group discussions. For cooperative learning, Slavin et al. (2009) review effective programs in middle school and high school mathematics and found that math curricula and the use of existing computer-based instruction had little effect on achievement, while there was significant positive effect for cooperative learning programs. Programs emphasizing teaching quality and student interaction along with textbooks and technology have more positive results than those that emphasize textbooks and technology only. Finally, Tobias (1993) defines math anxiety as a conditioned emotional response to participate in a math class and/or talking about math. This response produces a fear that precludes students from maximizing their performance in the subject at school and from pursuing possible careers in the future. Curtain-Phillips (1999) indicates that such anxiety results from three common classroom practices, namely, imposed authority, public exposure, and deadlines. Teachers and parents can also heighten the anxiety by forcing their perspective of math on the students. Rossman (2006) suggests that math teachers should encourage their students to be active learners, make the math relevant to the children's world, and promote collaborative learning.
In summary, improving math performance in the United States requires providing the necessary resources and making positive changes for students from different social and economic strata, building a better communal structure within schools, creating more cohesive math curricula, offering smaller classes, encouraging cooperative learning, and helping students overcome math anxiety. As teens spend significant time outside school, their interests toward a STEM field would be substantially influenced by their after-school activities. Therefore, when we address STEM education at school, it is enticing and effective if we can promote STEM education in an after-school setting by fully leveraging certain after-school advantages (e.g., any time, any pace, relaxing and less anxiety, family's involvement, etc.).
Currently, even though many web sites with online K-12 learning materials exist (OnlineK12, (2013) (for instance, a Google search will return hundreds of web sites), it remains difficult to locate pertinent literature for quality STEM education outside the school setting. It is equally difficult to find literature that focuses on incorporating the state-of-the-art cyber-based self-service technologies and uncovered in-school STEM education knowledge for effective off-campus STEM education, although “open educational resources” initiatives (e.g., The William and Flora Hewlett Foundation at http://www.hewlett.org/programs/education-program/open-educational-resources) focusing on improving students learning experience while leveraging external resources are gaining momentum (OER, (2010).
Furthermore, few effective approaches that were derived from empirical research are available to substantiate the success of STEM programs (Cavanagh, (2008). Brody (2006) notes that most measures regarding STEM programs in place focus on “inputs,” which refer to the number of participating teachers or attitudinal changes among students. She points out that there lacks a systematic approach in the current array of research, resulting in nebulous findings regarding the effectiveness. Clearly, there is an array of research questions that must be well addressed, including what short-term and long-term outcomes should be measured, what are the strengths and weaknesses of various outcome metrics, and what other success definitions should be studied. We are indeed concerned about the absence of a sound knowledge base for determining the effectiveness of a STEM program in light of meeting the nation's STEM talent growth objectives (Subotnik et al., (2007); Subotnik et al., (2009). However, we believe that an approach to retune a service system in a real-time and gradual manner for competitive advantage, as shown in Figure 7.14, can be viable in practice.
More specifically, the emergence of Service Science brings in a promising approach to facilitate STEM program offering in meeting the needs of education. By applying the concept of Service Science to the development process of a web-based education service system, we understand that the learning experiences that public school students have outside of the classroom positively impact on their learning outcomes (Qiu and Doris, (2013). We fully understand that we should avoid one-size-fits-all thinking. In other words, different paradigms might be more appropriate for certain circumstances. Therefore, “What kind of approach and proactive guidance should be provided to effectively customize and enrich such an outside school learning experience for improved impact on STEM education?” becomes an obvious question in the long run. The solution to this question with scientific rigor is truly critical for the continuous improvement and widespread adoption of the discussed model on a large-scale basis.
As indicated earlier, when we study a specific topic in education, we must stay focused and pay much attention to the areas in which we are interested. On the basis of the early discussion, we are motivated by the fact that effectively creating more interest among high school students and providing an outside-school, self-learning experience, through optimally leveraging state-of-the-art cyber-based technologies, will significantly enrich and enhance our nation's STEM education. By having a strong connection with the fast-changing and digitalized living environments, the potential influence on high school students' attitudes and perceptions is enormous.
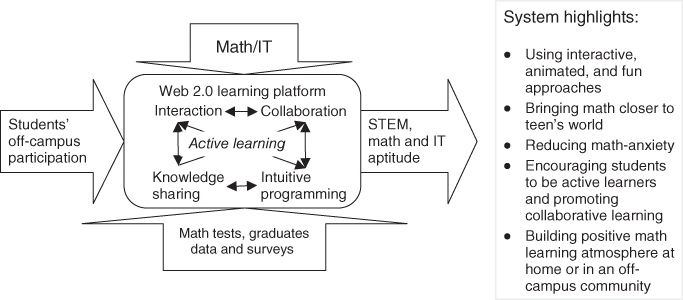
Figure 7.15 Overview of TESS with a focus on off-campus STEM education service (Qiu and Lee, 2013).
To essentially enrich the knowledge base of STEM education, we present how a transformative education service system (TESS) can significantly address the defined challenges, namely, “Do the learning experiences that K-12 students have outside of the classroom contribute significantly to their choice of a STEM career?,” “How does the effectiveness of an off-campus STEM education module get evaluated quantitatively?,” and “What kind of approach and proactive guidance should be provided to effectively improve and enrich such a learning experience for improved impact on STEM education?” By taking the above-mentioned challenges into consideration during our TESS prototyping, we can ensure that the developed TESS meets the needs of the school, students, and their parents. Therefore, the desirable off-campus STEM education service can be well offered.
The detailed explanation of this example will be presented in the remaining parts of this section. More specifically, we thus discuss a Service-Science-based approach to enrich this off-campus high school STEM education program. The adopted approach includes the following three focused areas:
- Web 2.0 System Prototyping. We fully utilize the discovered knowledge on how to improve STEM education at school. Appropriate instruments and measures are developed, implemented, and enriched to assess engagement, persistence, and other relevant constructs of student motivation and learning.
- Systems Performance Analysis. We then use SEMs to answer the exploratory questions. As tests, data collection, and analyses are conducted semester by semester, an effective and applicable off-campus STEM education approach can evolve and mature over time.
- Optimization and Improvement. By using goal-driven tractable approximations and stochastic modeling, a guideline for potentially improving STEM education can be synthesized and compiled (Qiu, (2009); Qiu et al, (2011).
7.3.1 A Transformative Education Service System (TESS)
Given the increased dynamics and complexity of this fast-changing world, it could be extremely difficult to fully address the challenges. As a breakthrough exploration, the study explores an innovative STEM program with an initial focus on math education in a high school off-campus setting (Figure 7.15). Using the latest Web 2.0 technology, an off-campus, self-learning STEM service system will be easy and fun to use, encouraging teens to appreciate math and math learning. Visualization, interaction, collaboration, knowledge sharing, and intuitive programming will help to create and nurture an active learning environment, keeping students pedagogically engaged. This service system is designed in a way that promotes a cohesive and hierarchical arrangement for anxiety-free math learning and gaining positive IT experience. High school students shall exit with greater proficiency in math, scoring higher on standardized testing and in school math programs. As a result, more students will choose a college major in a STEM field,
As discussed earlier, this example shows how to design, implement, test, and synthesize an innovative and systemic approach for enriching and improving math education (Figure 7.16). Using well-defined longitudinal studies, we focus on the mechanisms of retuning the service system in a comprehensive, quantitative, and qualitative manner. To further prove and demonstrate this example's exploratory potential, an approach to identify appropriate guidance for further improving STEM education, synthesized from longitudinal analytical studies, is provided in Section 7.3.3.
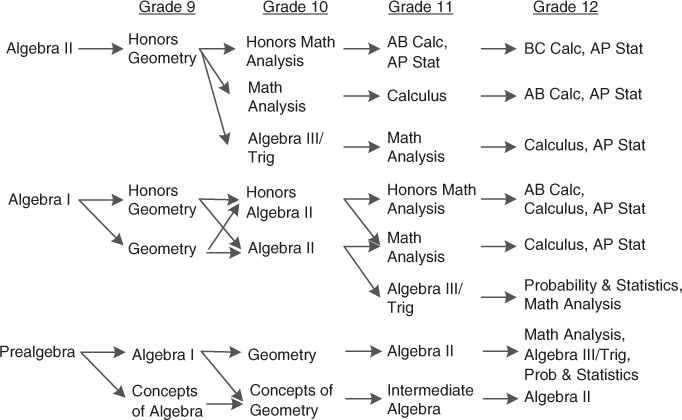
Figure 7.16 Math courses and offering sequence in a typical US high school.
By collaborating with high schools, we design and develop a Web 2.0-based system to provide students with interactive math learning materials and some intuitive programming skills in an off-campus setting. For example, by closely working with math teachers in a high school, we can first identify 500 math cases that are difficult for high school students to learn in class. These cases can be evenly distributed across different math subjects that are offered in school (Figure 7.16). As an example, many students make mistakes in answering a question related to the object dilation of a xyz factor (e.g., 2, 0.2). We can create an animation page that is linked to this question as shown in Figure 7.17. By interacting with the object, students can directly watch its animated dynamic change with the change of the factor value or types of objects.
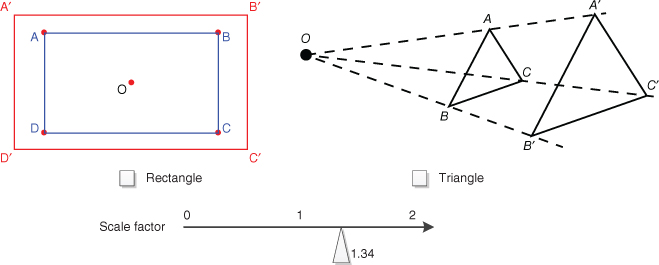
Figure 7.17 Learning through visualization and interaction.
Features in support of visualization (3D), interaction, collaboration, knowledge sharing, and intuitive programming can also be fully integrated, which create and nurture an active learning environment that helps students learn off-campus while having a lot of fun. This will promote a cohesive and hierarchical arrangement for anxiety-free math learning, within an open, positive, constructive, and collaborative atmosphere (Gokhale, (1995), while gaining state-of-the-art IT experience (Cuff and Molinaro, (2005). Essentially, we design and develop a Web 2.0-based animated learning system (Figure 7.18), focusing on keeping students engaged in a positive way.
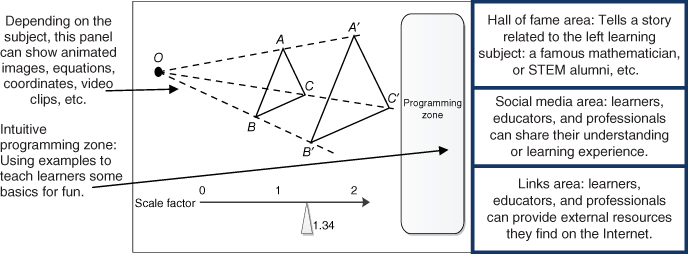
Figure 7.18 Web 2.0-based animated learning system: an interface view.
7.3.1.1 Web 2.0 Services in a Real-Time and Collaborative Manner
Today's high school students are frequently called generation next or the Millennial Generation in a broad sense. Five important characteristics, “tech-savvy,” “impatient,” “fickle,” “ambitious,” and “communicators,” have been used to describe them. Indeed, significant advancements in the computing, networking, and telecommunication technologies have been made since the turn of this new millennium. As a result, they grow up essentially with constant connection to the Internet. They like to use smart phones and tablet computing devices or the like, enjoying the power, convenience, and connections enabled by the mobile computing devices and technologies. Indeed, “they're accustomed to using technology in every part of their lives and fully believe in its power to make their lives easier” (Ippolito, (2012). With the future becoming ever-more computer-oriented, network-connected, they have a stronghold on how to function in the digital age. Therefore, a learning service system should be well equipped with supports, meeting the needs of their interests and passions.
By allowing the individual users to interact and collaborate with each other, a Web 2.0 site focuses on leveraging end users' collective contributions to its served community. The quick advances in online social media have made possible interactions among end users in real time and at ease while engendering more fun and better personalization. Figure 7.19 shows how the TESS leverages the Web 2.0 services and takes advantage of the rich information over the Internet to deliver modules on a daily basis to subscribers. More importantly, online chats and instant messages are enabled, which allow students to interact and learn in a collaborative manner.
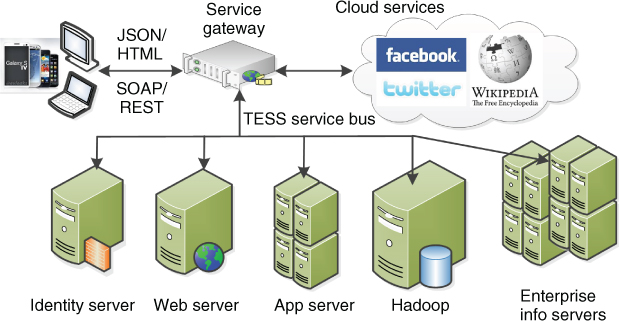
Figure 7.19 Web 2.0 services in a collaborative learning setting.
7.3.1.2 Big Data: Architecture and Transformation
To provide effective and customized learning practices for students, we must know how they perform and what they like. To enable real-time guidance in support of their daily learning activities, we then have to analyze their learning practices as time goes. Capturing the dynamics of students as time goes becomes critical for us to develop and operate the Web 2.0 system, so that better guidance for individual learners over time can be truly provided.
TESS is designed with the capability of collecting daily learning activities for all the individuals. In other words, the activities of accessing the system are fully logged by TESS. As the system has links to many external sources, the data becomes big and overwhelming. For instance, the discussions on the provided forums, communications over Facebook and Twitters, and online chatting are most likely unstructured data. That is to say, the majority of data coming from disparate and heterogeneous sources are semistructured or unstructured (e.g., text and media data); thus, conventional approaches and tools that were designed to work with large structured data sets simply cannot handle this big data if learning analytics is the goal for the collecteddata.
The prototype of TESS does not include the big data component. Figure 7.20 shows the overall big data architecture that can be used in the TESS when data for all learning activities managed by external sites can be well retrieved and logged. Figure 7.21 illustrates how we can appropriately deal with the voluminous data transformation services in support of Web 2.0-based collaborative learning. More importantly, new analytic methodologies and frameworks must be explored and introduced to the market to help the TESS bring order to the big data from diverse sources and thus harness the power of the big data. By doing so, we can further glean the insights and values of the application of TESS by conducting learning analytics to meet the needs of TESS in the long run (IBM Global Business Services, (2012) (2013).
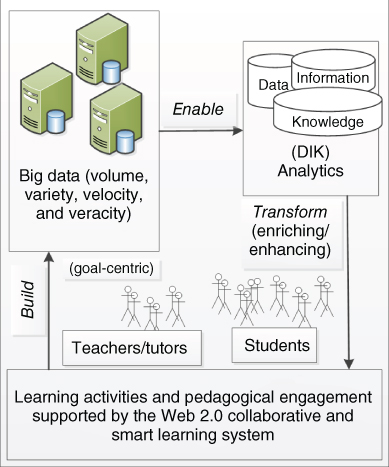
Figure 7.20 Big data architecture applied to TESS.
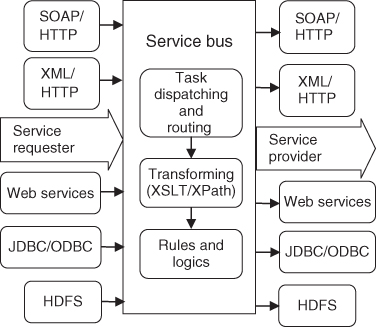
Figure 7.21 Integration service bus used in TESS (Qiu, (2013).
7.3.2 Systems Performance Analysis
The goal of this TESS is to help high school students gain more interests in STEM-related subjects and careers through active participations in an out-of-school, self-learning program. In practical terms, the study will attempt to prove STEM's practical value by implementing a Web 2.0 learning system and investigating whether students using the learning system will produce a better math performance. Furthermore, it will investigate whether the learning system leads them to choose a college major in a STEM field, meeting the growing demand for professionals and information technology workers in the US STEM workforce (NGA, (2009); NSB, (2010).
By incorporating the concept and principles of Service Science into this study, we show an innovative approach to encourage and improve high school STEM education through well-defined longitudinal studies. This study explores how our off-campus, self-learning module (i.e., a scaled-down version of the STEM program) will function in today's digitized world from a comprehensive, quantitative, and qualitative perspective. The developed approach is generic so that any STEM program in the United States can apply it to analyze challenges within its operations. On the basis of the analysis, a STEM program can then identify optimal countermeasures and priorities that will facilitate transforming learning processes in an effective manner.
The early stage of TESS development and relevant experiments can be used as the foundation for the study with a focus on the test of hypotheses. For example, before we fully design and develop the TESS, we should initially answer this question: “How much will the impact on high school students choosing STEM careers be after they receive enriched, cyber-based Math/IT education in an outside-school setting?” Using a cross-sectional empirical study that is simply based on SEM and principal component analysis (PCA) methods, we can conduct a full model fitting study, aimed at improving the adopted questionnaires and identifying features and functionalities capable of collecting the needed data from the TESS for further analytics.
Students in high schools can be invited to use the TESS. Depending on the course a student is taking, he/she will have different privileges to access relevant course materials. On the basis of the defined math course sequence (Figure 7.16), a student will be allowed to access the materials for all the courses that he/she already completed. By doing so, students will provide more comprehensive feedback information to this study over time. By working with teachers, administrators, and some volunteer students, numerous sets of questionnaires for students based on groups and grades can be developed. As a result, by fully leveraging the data collection mechanisms embedded in the system, data measuring the learning process, materials, interactions, usage, and outcomes (e.g., tests scores) can be collected in a timely manner (Figure 7.22).
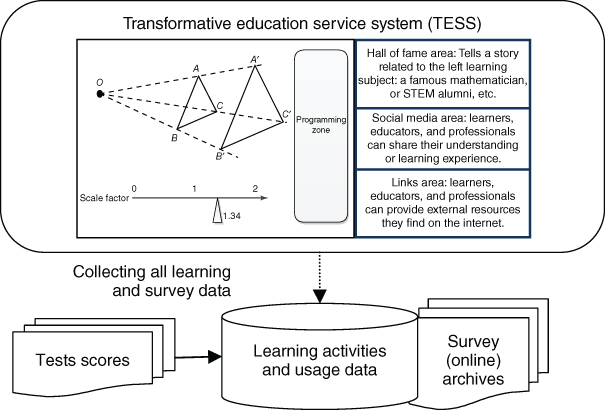
Figure 7.22 Data collection mechanisms used in the Web-based interactive learning system.
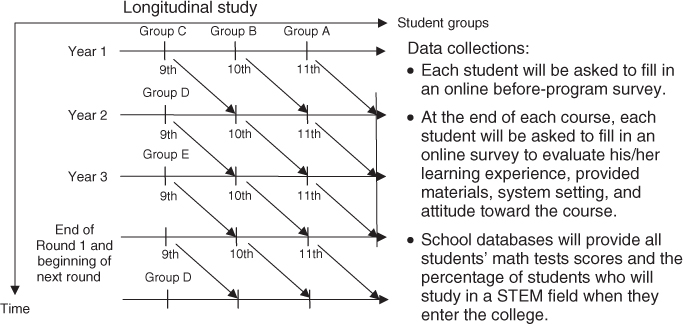
Figure 7.23 Tests and data collections for a period of 3 years.
Voluminous data and rich information on students' learning practices can be collected as the experiments continue year by year (Figure 7.23). Promisingly, the conducted study will go beyond a cross-sectional empirical one; a longitudinal study shall result, which can provide much better understanding of learning practices in an online and off-campus setting. More importantly, the learned insights of students' learning behavior and needs can help us improve TESS system designs (e.g., interfaces, features, and interactions) and enrich learning materials (e.g., more examples and cases if possible). Ultimately, students' off-campus learning experience can be substantially impacted in a positive way.
Note that data preprocessing is critical for SEM and PCA analyses (Wang et al., (2010). Most of the logged TESS data will be in standard XML formats, with the exceptions of the survey data that are mainly in Likert scale. Data collection and transformation algorithms are essential for discovering and extracting the needed data. Transformed data and texts are mapped as the required formats such as Likert-scale data, integers, or binary numbers can be properly loaded into SEM and PCA models (Agrawal et al., (1993); Zeng et al., (2007); Wang et al., (2009). Essentially, data from individuals' learning practices, different learning modules, and collaborative learning activities through the TESS must be fully collected and appropriately transformed, and then made ready for conducting learning analytics.
7.3.2.1 Learning Analytics in the TESS
Engendering more interest among high school students, providing an outside-school active learning experience, and nurturing a societal culture of highly respectful STEM recognition substantially contribute to the teen development. As discussed earlier, we focus on the fundamental understanding of how we can create and maintain active and self-paced STEM learning atmospheres in off-campus settings, resulting in positive STEM workforce development, participation, and improvement. As it takes place in the context of the family, the peer group, and the neighborhood or community with the support of the advanced cyber technologies, the learning relying on the TESS becomes essentially a contemporary and dynamic sociotechnical phenomenon.
By referring to a variety of SEM-based STEM studies such as ones conducted by Dauphinee et al. (1997), Bernold et al. (2007), and Tempelaar et al. (2007), we develop an SEM based on indicators covering areas from study help, students' attitude, engagement, persistence, motivation, and other relevant latent constructs that are known to impact off-campus learning processes one way or another. From the constructed SEM illustrated in Figure 7.24, these latent variables are measured and analyzed using the following measurable variables in groups.
- Value. A list of questions is used to understand students' attitudes regarding the usefulness, relevance, and worth of math and IT through their personal observations and life experience.
- Difficulty. A list of questions is used to measure students' attitudes toward the difficulty level of math or IT as a learning subject.
- Motivation. A list of questions is used to measure societal recognition and respect in students' mind.
- Effort. A list of questions is used to measure the amount of work that a student expends to learn math and IT over the exploratory period.
- Study Help. A list of questions is used to measure the learning setting and available learning assistance and supports: availability of online help, easiness of getting the learning subjects, appropriateness of learning materials, etc.
- Cognitive Competence. A list of questions is used to measure students' intellectual competence, subject knowledge, and skills applied to the process of learning math and IT.
- Aptitude Toward Math. A list of measures is used to gauge the enjoyment aspect of intrinsic value and the acquired knowledge of learned relevant math subjects.
- Aptitude Toward IT. A list of measures is used to gauge the student's perceptions, state of mind, or feelings toward IT: I have fun using state-of-the-art web technologies; I enjoy the visualization and interactions, etc.
- Aptitude Toward STEM. A list of questions is used to measure the changes concerning STEM improvement: improved percentage of students choosing STEM career, better a variety of testing results, etc.
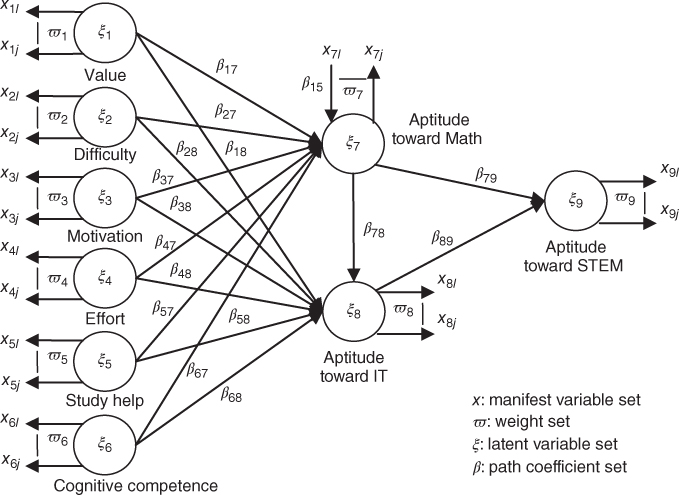
Figure 7.24 An SEM model for the needed cross section and longitudinal empirical study.
The perceived learning outcomes are extremely subjective and also vary with groups of students and schools. Hence, a suite of priority measures (i.e., the main factors influencing students' attitude toward STEM) must be developed for evaluating the effectiveness of the TESS and conducted experiments. Although it is clear that the yearly percentage change in students' attitude toward STEM is what we will use to measure the effectiveness of this study, a generic effectiveness measure can be more appealing in practice. This generic effectiveness measure might shed a light of establishing better quantitative measures for achieving different objectives when circumstances change over time or similar explorations are conducted in different schools:
where ![]() is the number of constructs considered at the time when such a study takes place,
is the number of constructs considered at the time when such a study takes place, ![]() is a mapping function for a given objective latent variable, and
is a mapping function for a given objective latent variable, and ![]() is the weight defined by a given school district and can be adjusted as time goes. The defined weight can be determined using analytic hierarchy process, analytic network process, or other decision-making methodologies (Ahmad and Qiu, (2009).
is the weight defined by a given school district and can be adjusted as time goes. The defined weight can be determined using analytic hierarchy process, analytic network process, or other decision-making methodologies (Ahmad and Qiu, (2009).
In this analytical study, by relying on PCA and SEM mediator and moderator effect analyses, we can analyze how certain factors (i.e., more visual geometry models, hands-on programming, or more interactions) highly correlated, and understand how an action will quantitatively impact the high school students' inclination toward STEM as time goes. As a result, rules of thumb for students and tutors can be developed, which can be then applied to guide teaching and learning practices to improve students' inclination toward math, in particular, and STEM, in general.
7.3.3 A Goal-Driven Learning System: Optimization and Improvement
“The only constant is change.” Student inclination toward STEM could vary with changes (Figures 7.15 and 7.24): new IT technologies, changed user profiles because of improved individual's learning and cognitive ability, etc. To tackle changes and assure the desirable trend of STEM education in the focused group, stochastic processes and algorithms, to ensure tractable approximations, should be incorporated into the study. Once again, we fully understand that we should avoid one-size-fits-all thinking as different paradigms might be more appropriate for certain circumstances. Therefore, one way to gain a quantitative understanding of off-campus math learning by relying on the TESS is what we mean in the following discussion.
A goal-driven approach to optimize and improve the TESS essentially focuses on answering the following question, “What kind of approach and guidance should be used to effectively enhance and enrich such a learning experience for improved impact on STEM education?” We discuss one possible way to meet the defined needs. In this subsection, we will focus on (i) defining a vector-continued fractions interpolation method for trajectory approximations (Qiu et al., (2011); (ii) developing a robust optimization approach to address changes as time goes; and (iii) further enhancing the developed TESS by fully incorporating the research findings. Ultimately, the developed mechanisms support retuning of the learning guidance in a proactive and real-time manner, so that students would have tractable and desirable performances (see Figures 7.23 and 7.25). The developed Service-Science-based framework essentially could lay out a solid foundation for a future scale-up study regionally or nationally.
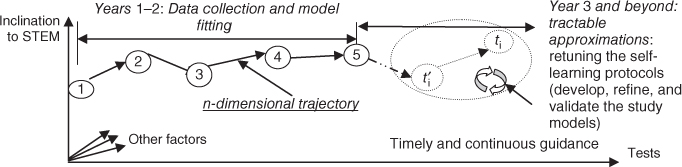
Figure 7.25 Test, effectiveness metrics, and tractable trajectory approximations.
7.3.3.1 Cause–Effect Analysis and Prediction
For a given n-dimension-based performance trajectory (Figure 7.25), vector-continued fractions can be used to find its fitting or path approximation equation (Roberts, (1999); Haydock et al., (2004). We use the equation to approximate the student inclination toward STEM by predicting its next dynamic behavior. Assume that there is a data set from 1 to ![]() (e.g., each test period derives one set in the TESS), which is denoted as
(e.g., each test period derives one set in the TESS), which is denoted as ![]() . Each
. Each ![]() has m + n vectors
has m + n vectors ![]() (see Figure 7.24). The dynamic trajectory of the TESS can be approximately described by the SEM data set of loadings and coefficients. By introducing an interpolation method, we aim to improve the precision of the trajectory approximations, which was successfully done in our hotel service quality project (Qiu et al., (2011).
(see Figure 7.24). The dynamic trajectory of the TESS can be approximately described by the SEM data set of loadings and coefficients. By introducing an interpolation method, we aim to improve the precision of the trajectory approximations, which was successfully done in our hotel service quality project (Qiu et al., (2011).
7.3.3.1.1 Goal-Driven Tractable Approximation Algorithm
On the basis of the definitions given earlier, we construct the following interpolation function sets, based on ![]() and
and ![]() , for improved path approximations:
, for improved path approximations:
- Step 1. Divide
 and
and  into two sets:
  ,
,  , and
, and  ,
,  . On
. On  and
and  , we construct a k − 1-order Newton interpolation polynomial
  , or a vector-continued fraction interpolation
  ,
,  ;
;  .
. - Step 2. For
 , define
  or
or  , we have
  , where
  .
. - Step 3. Consider
 or
or  .
. - Step 4. Construct continued fraction interpolation function:
7.3
where
 .
.
Equation 7.3 essentially can be used to predict how a student will be performing next (e.g., ![]() if point 5 indicates the current status in Figure 7.25 when no guidance will be provided proactively and in real time. Genetic algorithm, using iterative processes, can be applied to find the value of
if point 5 indicates the current status in Figure 7.25 when no guidance will be provided proactively and in real time. Genetic algorithm, using iterative processes, can be applied to find the value of ![]() for optimal approximation based on the longitudinal study (Qiu et al., (2011).
for optimal approximation based on the longitudinal study (Qiu et al., (2011).
7.3.3.2 Robust Optimization to Develop STEM Education Guidance
If the prediction model shown in Figure 7.25 demonstrates that a student trajectory, in terms of meeting the objectives, is heading to ![]() (not likely to meet goals), the question becomes what actions can be undertaken with confidence to guide the student toward
(not likely to meet goals), the question becomes what actions can be undertaken with confidence to guide the student toward ![]() (likely to meet the goals).
(likely to meet the goals).
Stochastic optimization is one of the most popular approaches used to address data uncertainty in operation research (Dantzig, (1955). We used a Markov Chain method to find optimal policies for group decision making in a changing IT project management circumstance (Shen et al., (2008). However, the underlying probability distribution of the data is, in general, impossible to know. Robust optimization circumvents this difficulty and has been used as an alternative to stochastic optimization since it was introduced (Soyster, (1973); Goldfarb and Iyengar, (2003); Bertsimas et al., (2004); Ben-Tal et al., (2005); Bertsimas and Thiele, 2004). A budget of uncertainty on the data is an efficient way to measure the trade-off between conservativeness and performance (Bertsimas and Sim, (2003) (2004). The budget of uncertainty represents the overall cumulative amount of variation away from nominal values that must be shared among uncertain data. Yamashita et al. (2007) discuss a robust optimization model for a project scheduling problem. Adida and Joshi (2009) then present a robust optimization approach to project scheduling and resource allocation problems.
By analyzing all the collected measurable data from the TESS, a budget of uncertainty can be determined to reflect the overall cumulative amount of variation away from the nominal values in this study. On the basis of this established budget, a robust optimization approach can be defined to address a variety of uncertain circumstances. As a result, a list of self-learning guidelines for students and administrators can be developed, which can help to guide their teaching/learning practices in a proactive manner.
7.3.4 Continuously Enhancing STEM Education
Through iterations of design, implementation, and synthesis, the discussed approach can surely help high school students to learn STEM subjects in off-campus online learning settings. However, as a laboratory research project, the implemented framework will truly require more tremendous efforts than we have done to make this TESS full-blown operational in practice. We understand that the applicability of the discussed approach might also be limited because of some restricted accessibility for certain groups of students, which must be further addressed in practice.
Note that although this study initially focuses on enriching math education for high school students, it will create a solid foundation for developing an integrated and systematic approach and framework to enrich STEM education in general. The presented approach and framework can then be applied for K-12 education on a large-scale basis. With the guidance of Service Science principles, the developed models, algorithms, and Web 2.0-based system can also be significantly revised and enhanced and then integrated with evolving in-school education systems for general educational improvement.
As there is lacking sufficient data for us to present detailed analytics as of the time we are writing this chapter, we cannot generate a concrete set of rules of thumb that can guide schools' administrators and teachers, students, and parents to carry out best practices in off-campus education. To show how Service Science modeling and analytics help to improve education management and operations, we provided a data-rich analytics earlier using an example of education program quality control and management study. More concrete and detailed analytics examples are provided in Chapter 8.
7.4 A Lifecycle and Real-Time-Based Approach to Service Engineering and Management
As compared to approaches taken in the fields of psychology, social science, and marketing, the discussed systems approach in this chapter is not focusing on hypothetic tests. Instead, we focus on methodologies of enhancing the effectiveness of business practices through a series of real-time and proactive guidance to offer and deliver satisfactory services. Using computational and transformative thinking, (i) a suite of mathematical models in the form of computation, data mining, and integrated structural equation modeling and PCA are applied to describe a variety of service circumstances; (ii) vector-continued fractions and robust optimization are then utilized for cause–effect analysis and prediction over time or on a daily operation basis when enabled technologies are fully implemented; accordingly, (iii) rules of thumb are identified to assist stakeholders to manage and govern service systems to meet their needs in a satisfactory manner. Ultimately, by responding to the principles of Service Science and putting them into use, we can act to retune management and operational practices in a proactive and real-time manner, resulting in further improving the performance of service systems as illustrated in Figure 7.14.
For instance, in the first example, the administrative team at a school frequently question themselves:
- Do we really understand our campus as an education service system?
- What can we change in school so that we can achieve student satisfaction excellence?
- What will be the best approach to transform our education service system into a more adaptable, responsive, and competitive one?
Note that these questions surely have no easy answer, given that the changes in the education market are becoming faster than ever before. The answers also certainly vary with the schools. With the fast advancing technologies and accelerating globalization, it becomes significantly challenging because viable solutions can also change and be substantively different over time.
For example, we know that providing state-of-the-art programs matters significantly from the analysis that is clearly indicated in Figure 7.13. However, to make a change in the offer programs would take considerable efforts and lot of investments over a long period. In a real-life situation, the school surely should have strategic and tactic plans in place to have practical and applicable approaches to achieve the goal. The enriched process must also be monitored and adjusted during the implementation. In other words, when we determine an action for education program improvement that is strategically viable and tactically implementable, we must take into consideration all the inputs from all the stakeholders. Therefore, we must adopt a lifecycle and holistic approach that is essentially promoted and supported in Service Science.
To briefly illustrate an example in applying closed-loop and real-time analytics to enhance service quality and students' satisfaction, let us use the construct called “support” in the above-discussed school service system. In Figure 7.13, Q26 (i.e., “whether the classrooms are appropriately equipped for classes offered on campus”) carries the highest weight (i.e., 0.387) in reflecting students' perceived learning support on campus. Surely, we know that students appreciate investment on retaining classrooms well-equipped and keeping up campus learning supports with top-notch information, computing, and mobile technologies. However, given the constrained IT budget on campus, an effective and practical teaching equipment and IT transformation or investment plan should be first created.
The literature suggests surveys to collect the inputs from stakeholders (i.e., employees and students). The framing questions on IT investment needs and directions from a website at Penn State (http://www.psu.edu/dept/it/strategies/strategicplan/openforums-alt.php) could be asked in the questionnaire that focuses on how IT could facilitate and transform services in a school system. Similar to any investment made (or simply an action taken) on campus, its plan, design, delivery, operation, and improvement comprise its lifecycle. Integrating qualitative and quantitative approaches to define and carry out the investment should be an effective way to improve our education service in overall and ensure our service system's sustainability and competitiveness. In other words, the adopted approach must be executed throughout the service lifecycle:
- Market, discovery, and strategy
- Design and development
- Delivery, operations, and monitoring
- Optimization and improvement
Only if we could carry out closed-loop and real-time explorations of our service systems, we would keep the service systems competitive and retain in the world-class club.
7.5 Summary
In this chapter, we first reviewed systems of schooling in the Service Science's perspective. Then, we used two different examples to show how education service systems can be explored by applying the principles of Service Science. In the first example, we applied a systems performance approach to understand the dynamics of an educational school system as a whole. To introduce the concept of real-time and proactive actions for the purpose of guiding systems dynamics trajectory, in the second example, we used a high school off-campus learning system to show how a systems approach could be adopted to reengineer the off-campus learning system to help improve students' aptitude to science, technology, engineering, and mathematics over time.
Using systems thinking, this chapter focused on retuning a service system in real time for competitive advantage. To capture and understand people-centric service management and operations, we must explore what kind of service products people as individuals want, how they participate in the process of transformation of needs, and how they change their expectations during the service transformation. A social network approach to look into the insights of service systems is discussed with examples in our next chapter, which further enrich our explorations of Service Science in service engineering and management.
Acknowledgment
Part of Section 7.3—Off-campus learning example was delivered as a keynote speech by the author at 2013 IEEE International Conference on Software Engineering and Service Science, May 23–25, 2013, Beijing, China. A brief paper was also published in the conference proceedings, entitled “Transformative education Web 2.0 systems for enriching high school STEM education.” Dr. Doris Lee, Professor of Education at Penn State, significantly contributed to the literature review of the STEM education in the United States in this chapter.
References
- Adida, E., & Joshi, P. (2009). A robust optimization approach to project scheduling and resource allocation. International Journal of Services Operations and Informatics, 4(2), 169–193.
- Agrawal, R., Imieli
 ski, T., & Swami, A. (1993). Mining association rules between sets of items in large databases. ACM SIGMOD Record, 22(2), 207–216.
 - Ahmad, N., & Qiu, R. G. (2009). Integrated model of operations effectiveness of small to medium-sized manufacturing enterprises. Journal of Intelligent Manufacturing, 20(1), 79–89.
- Andreescu, T., Gallian, J. A., Kane, J. M., & Mertz, J. E. (2008). Cross-cultural analysis of students with exceptional talent in mathematical problem solving. Notices of the AMS, 55(10), 1248–1260.
- Atkinson, R., Hugo, J., Lundgren, D., Shapiro, M., & Thomas, J. (2007). Addressing the STEM Challenges by Expanding Specialty Math and Science High Schools. The Information Technology and Innovation Foundation.
- Baldi, S., Jin, Y., Skemer, M., Green, P., Herget, D., & Xie, H. (2007). Highlights from PISA 2006: Performance of U.S. 15-Year Old Students in Science and Mathematics Literacy in an International Context. U.S. Department of Education.
- Ben-Tal, A., Golany, B., Nemirovski, A., & Vial, J. P. (2005). Retailer-supplier flexible commitments contracts: a robust optimization approach. Manufacturing & Service Operations Management, 7(3), 248–271.
- Bernold, L. E., Spurlin, J. E., & Anson, C. M. (2007). Understanding our students: a longitudinal-study of success and failure in engineering with implications for increased retention. Journal of Engineering Education, 96(3), 263–274.
- Bertsimas, D., Pachamanova, D., & Sim, M. (2004). Robust linear optimization under general norms. Operations Research Letters, 32(6), 510–516.
- Bertsimas, D., & Sim, M. (2003). Robust discrete optimization and network flows. Mathematical Programming, 98(1–3), 49–71.
- Bertsimas, D., & Sim, M. (2004). The price of robustness. Operations Research, 52(1), 35–53.
- Bertsimas, D., & Thiele, A. (2004). A Robust Optimization Approach to Supply Chain Management in Integer Programming and Combinatorial Optimization, 86–100. Berlin, Heidelberg: Springer.
- Bollen, K. (1989). Structural Equations with Latent Variables. John Wiley & Sons, Inc.
- Bollen, K., & Lennox, R. (1991). Conventional wisdom on measurement: a structural equation perspective. Psychological Bulletin, 110(2), 305–314.
- Brody, L. (2006). Measuring the Effectiveness of STEM Talent Initiatives for Middle and High School Students in Identifying and Developing STEM Talent: A Planning Meeting. September, 2006. Washington, DC: National Academy of Sciences.
- Brown, A. S., & Brown, L. L. (2007). What are science and math test scores really telling US. The Bent of Tau Beta Pi, 13–17.
- Cavanagh, S. (2008). Federal projects' impact on STEM remains unclear: few U.S. programs have studies evaluating their effectiveness. Education Week, 27(30), 20–21.
- Chin, W. (1998). The Partial Least Squares Approach for Structural Equation Modeling in Modern Methods for Business Research, 295–336, ed. by George A. Marcoulides. Lawrence Erlbaum Associates.
- Chin, W., Marcolin, B., & Newsted, P. (2003). A partial least squares latent variable modeling approach for measuring interaction effects: result from a Monte Carlo simulation study and an electronic-mail emotion/adoption study. Information Systems Research, 14(2), 189–217.
- Coltman, T., Devinney, T. M., Midgley, D. F., & Venaik, S. (2008). Formative versus reflective measurement models: two applications of formative measurement. Journal of Business Research, 61(12), 1250–1262.
- Cuff, K. E., & Molinaro, M. (2005 December). Improving attitudes toward STEM by providing urban-based environmental science research opportunities. AGU Fall Meeting Abstracts, Vol. 1, 0327.
- Curtain-Phillips, M. (1999). Math Attach: How to Reduce Math Anxiety in the Classroom, at Work, and in Everyday Personal Use. Marilyn Curtain-Phillips.
- Dantzig, G. B. (1955). Linear programming under uncertainty. Management Science, 1(3–4), 197–206.
- Dauphinee, T. L., Schau, C., & Stevens, J. J. (1997). Survey of attitudes toward statistics: factor structure and factorial invariance for women and men. Structural Equation Modeling: A Multidisciplinary Journal, 4(2), 129–141.
- Diamantopoulos, A., Riefler, P., & Roth, K. P. (2008). Advancing formative measurement models. Journal of Business Research, 61(12), 1203–1218.
- Duarte, P. O., Raposo, M. B., & Alves, H. B. (2012). Using a satisfaction index to compare students' satisfaction during and after higher education service consumption. Tertiary Education and Management, 18(1), 17–40.
- Edwards, J. R. (2011). The fallacy of formative measurement. Organizational Research Methods, 14(2), 370–388.
- Fornell, C., & Bookstein, F. L. (1982). Two structural equation models: LISREL and PLS applied to consumer exit-voice theory. Journal of Marketing Research, 19(Nov.), 440–452.
- Gokhale, A. (1995). Collaborative learning enhances critical thinking. Journal of Technology Education, 7(1), 22–30.
- Goldfarb, D., & Iyengar, G. (2003). Robust portfolio selection problems. Mathematics of Operations Research, 28(1), 1–38.
- Gruber, T., Fuß, S., Voss, R., & Gläser-Zikuda, M. (2010). Examining student satisfaction with higher education services: using a new measurement tool. International Journal of Public Sector Management, 23(2), 105–123.
- Haydock, R., Nex, C. M. M., & Wexler, G. (2004). Vector continued fractions using a generalized inverse. Journal of Physics A: Mathematical and General, 37(1), 161–172.
- Henseler, J., Hubona, G., & Ringle, C. (2008). Structural equation modeling using SmartPLS. SmartPLS Workshop Lecture Notes, George State University, Atlanta, GA, January 2008.
- Hill, F. M. (1995). Managing service quality in higher education: the role of the student as primary consumer. Quality Assurance in Education, 3(3), 10–21.
- Holmes, M., Rulfs, J., & Orr, J. (2007). Curriculum development and integartion for K-6 engineering education. Proceedings of the 2007 American Society for Engineering Annual Conference & Exposition.
- IBM Global Business Services. (2012). Analytics: the real-world use of big data—how innovative enterprises extract value from uncertain data. IBM Global Business Services Business Analytics and Optimization Executive Report. Retrieved on Mar. 5, 2013 from http://www-935.ibm.com/services/us/gbs/thoughtleadership/ibv-big-data-at-work.html.
- IBM Global Business Services. (2013). Analytics: a blueprint for value: converting big data and analytics insights into results. IBM Global Business Services Business Analytics and Optimization Executive Report. Retrieved on Mar. 5, 2013 from http://public.dhe.ibm.com/common/ssi/ecm/en/gbe03575usen/GBE03575USEN.PDF.
- Ippolito, E. (2012). Meeting millennials: 5 characteristics that define your newest customers. Plume & Post. Retrieved June 19, 2012 from http://www.matchstickstrategies.com/.
- Jarvis, C. B., MacKenzie, S. B., & Podsakoff, P. M. (2003). A critical review of construct indicators and measurement model misspecification in marketing and consumer research. Journal of consumer research, 30(2), 199–218.
- Kline, R. (2005). Principles and Practice of Structural Equation Modeling. New York, NY: The Guilford Press.
- Lee, V. E., Smith, J. B., & Croninger, R. G. (1997). How high school organization influences the equitable distribution of learning in mathematics and science. Sociology of Education, 70, 128–150.
- Martensen, A., & Gronholdt, L. (2003). Improving library user's perceived quality satisfaction and loyalty: an integrated measurement and management system. The Journal of Academic Librarianship, 29(3) 140–147.
- Matthews, C. M. (2007). CRS Report for Congress/Science, Engineering, and Math Education: Status and Issues. Washington, DC: U.S. Congress, Resource, Science, and Industry Division, Congressional Research Service.
- Miller, R., & Barney Smith, E. H. (2006). Education by design: connecting engineering and elementary education. Proceedings Hawaii International Conference on Education, 4539–4550.
- National Center for Education Statistics. (2004). Qualifications of the Public School Teacher Workforce: Prevalence of Out-of-Field Teaching 1987-88 to 1999-2000. U.S. Department of Education.
- NGA. (2009). Innovation America: A Final Report. Retrieved Oct. 10, 2009 from http://www.nga.org.
- NSB. (2010). Science and Engineering Indicators. National Science Foundation. Retrieved Oct. 10, 2012 from http://www.nsf.gov.
- OER. (2010). (1) OER Commons, http://www.oercommons.org/. 2) MIT, http://ocw.mit.edu/OcwWeb/web/home/home/index.htm, (2) Carnegie Mellon, http://oli.web.cmu.edu/openlearning/forstudents/freecourses.
- OnlineK12. (2013). (1) Study Island, http://www.studyisland.com, (2) http://edhelper.com/, (3) American Education Corporation http://www.amered.com/, (4) K 12 Software http://www.k12software.com/, (5) PLATO Learning http://www.plato.com/, (6) Engineering, Go For It!. http://teachers.egfi-k12.org/, (7) http://www.hsalliance.org/stem/index.asp, (8) Google search “k-12 STEM education” to get many others.
- Qiu, R. G. (2009). Computational thinking of service systems: dynamics and adaptiveness modeling. Service Science, 1(1), 42–55.
- Qiu, R. G. (2013). Business-Oriented Enterprise Integration for Organizational Agility. Hershey, PA: IGI Global.
- Qiu, R. G., & Doris, L. (2013). Transformative education Web 2.0 systems for enriching high school STEM education. 2013 IEEE International Conference on Software Engineering and Service Science, May 23–25, 2013, Beijing, China, 352–355.
- Qiu, R. G., Wu, Z., & Yu, Y. (2011). A tractable approximation approach to improving hotel service quality. Journal of Service Science Research, 3(1), 1–20.
- Raykov, T., & Marcoulides, G. (2006). A First Course in Structural Equation Modeling, 2nd ed. Mahwah, NJ: Lawrence Erlbraum Associates.
- Rice, J. K. (1999). The impact of class size on instructional strategies and the use of time in high school mathematics and science courses. Educational Evaluation and Policy Analysis, 21(2), 215–229.
- Ringle, C. M., Wende, S., & Will, S. (2005). SmartPLS 2.0 (M3) Beta, Hamburg, Germany. Retrieved Oct. 10, 2010 from http://www.smartpls.de.
- Roberts, D. (1999). On a representation of vector continued fractions. Journal of Computational and Applied Mathematics, 105, 453–466.
- Rossman, S. (2006). Overcoming math anxiety. Mathitudes, 1(1), 1–4.
- Saad, L. (2005). Math Problematic for U.S. Teens. Retrieved January 13, 2010 from Gallup.com: www.gallup.com/poll/16360/math-problematic-us-teens.aspx?version=print.
- Schaefer, M. R., Sullivan, J. F., Yowell, J. L., & Carlson, D. W. (2003). A collaborative process for K-12 engineering curriculum development. Proceedings of the 2003 American Society for Engineering Education Annual Conference & Exposition.
- Shen, H., Zhao, J., & Qiu, R. G. (2008). A group decision-support method for IT project management based on Markov chain. 2008 IEEE International Conference on Systems, Man and Cybernetics, Singapore, October 12–15, 862–866.
- Slavin, R. E., Lake, C., & Groff, C. (2009). Effective programs in middle and high school mathematics: a best-evidence synthesis. Review of Educational Research, 79(2), 839–911.
- Soyster, A. (1973). Convex programming with set-inclusive constraints and applications to inexact linear programming. Operations Research, 21(5), 1154–1157.
- Subotnik, R., A. Edmiston, K. Rayhack. 2007. Developing National Policies in STEM Talent Development: Obstacles and Opportunities in Science Education: Models and Networking of Student Research Training under 21, 28–38, ed. by P. Csermely, K. Korlevic, and K. Sulyok. Amsterdam, The Netherlands: IOS Press.
- Subotnik, R., Orland, M., Rayhack, K., Schuck, J., Edmiston, A., Earle, J., Crowe, E., Johnson, P., Carroll, T., Berch, D., & Fuchs, B. (2009). Identifying and Developing Talent in Science, Technology, Engineering, and Mathematics (STEM): An Agenda for Research, Policy, and Practice. Chapter 69 in International Handbook on Giftedness, ed. by L. V. Shavinina. Springer.
- Tempelaar, D. T., Schim van der Loeff, S., & Gijselaers, W. H. (2007). A structural equation model analyzing the relationship of students' attitudes toward statistics, prior reasoning abilities and course performance. Journal of Statistics Education Research, 6(2), 78–102.
- Texas Instruments. (2006). Texas Instruments National Math Month Survey Finds Teens Lack Math Requirements for Hottest Careers. Retrieved January 13, 2010 from Texas Instruments Press Center: http://focus.ti.com/pr/docs/preldetail.tsp?sectionId=594&prelId=et060019.
- Tobias, S. (1993). Overcoming Math Anxiety. New York: W.W. Norton Company.
- Wang, J., Qiu, R. G., & Mi, C. (2009). The sources of customer's satisfaction and dissatisfaction. 2009 INFORMS International Conference on Service Science, Hong Kong, China, Aug. 6–8, 231–235.
- Wang, G., Wang, J., Ma, X., & Qiu, R. G. (2010). The effect of standardization and customization on service satisfaction. Journal of Service Science, 2(1), 1–23.
- Wenglinsky, H. (2000). How Teaching Matters: Bringing the Classroom Back into Discussions of Teacher Quality. Educational Testing Service.
- Yamashita, D. S., Armentano, V. A., & Laguna, M. (2007). Robust optimization models for project scheduling with resource availability cost. Journal of Scheduling, 10(1), 67–76.
- Yan, W., & Lin, Q. (2005). Parent involvement and mathematics achievement: contrast across racial and ethnic groups. The Journal of Educational Research, 99(2), 116–127.
- Zeng, L., Zhang, Y., & Qiu, R. G. (2007). Adaptive user profiling in enhancing RSS-based information services. 2007 IEEE International Conference on Service Operations and Logistics and Informatics, Philadelphia, USA, Aug. 27–29, 63–67.
Appendix A
Questionnaire that is Used to Evaluate the Quality of Education in a Graduate Professional School
This group questions are related to your personal satisfaction with your enrolled program at this graduate professional school. Please choose a number from 1 to 7 for each question: 1 indicates the least satisfaction and 7 indicates the most satisfaction.
- Satisfaction measures
- To what extent is your graduate professional school experience meeting your expectations? Q1
- If you had a chance to do it over again, would you choose to attend this graduate professional school? Q2
- What is your overall impression of the quality of education at this graduate professional school? Q3
- Would you recommend your friend or colleague to attend this graduate professional school if you had an opportunity? Q4
- Expectation and school image measures, and tuition matters
- How much did you know about this graduate professional school when you applied for your graduate study at Penn State? Q5
- How much did Penn State's reputation impact your decision in your enrollment process? Q6
- When you applied for your graduate study, which of the following school reputation or characteristic made you choose this graduate professional school? (If you choose “other,” your manual input is required.) Q7
- Program quality
- Research
- Outreach and community services
- Sports and alumni
- Location
- Other
- Please rate the extent to which you expected the quality of the program you applied for. Q8
- When you applied for your graduate study at this graduate professional school, to what extent did you expect that your graduate professional school experience would enhance your current or future career? Q9
- How do you rate yourself in light of your background, readiness, and commitment when you applied for your graduate study at this graduate professional school? Q10
- To what extent do you rely on your employer's tuition reimbursement to actively maintain your graduate student status at this graduate professional school? Q11
- Academic experience measures
- What was your primary objective when you first chose to enroll in this program? (If you choose “other,” your manual input is required.) Q12
- Career enhancement or promotion
- Change of career
- Other
- Has your graduate study at this graduate professional school been meeting your needs of your primary objective? Q13
- What is your general opinion on the quality of courses? In other words, are all courses truly and appropriately designed and taught at the graduate level? Q14
- How do you feel the challenges provided by the classes you have taken so far? Q15
- What do you think about the “state-of-the-art” of programs at this graduate professional school? In other words, has the program been well adapted to accommodate developments in the field or positioned to do so in the future? Q16
- How do you like the profession-kind atmosphere provided by this graduate professional school as the majority of students are professional on campus? Q17
- Which of the following change would you prefer to see in the near future? (If you choose “ other,” your manual input is required.) Q18
- More full-time faculty
- More part-time professional faculty
- Program enhancement in terms of adding the “state-of-the-art”
- More challenging courses
- More seminars by guest speakers from business and industry
- Other
- What was your primary objective when you first chose to enroll in this program? (If you choose “other,” your manual input is required.) Q12
- Faculty and student measures
- Please rate the general quality of the faculty in your program. Q19
- What do you think about the general adequacy of instructors' knowledge in the field? Q20
- Do you think that the instructors' background is qualified for offering the subject matter? Q21
- Do you think that the amount of learned information and knowledge is adequate and meets your expectation? Q22
- To what extent do you value instructors' industrial experience that impacts the effectiveness of the instructors in demonstrating the significance of the subject matter? Q23
- Please try to accurately rate your general readiness in terms of your background and commitment when you take each class. Q24
- How well did your graduate professional school experience prepare you for your current or future career? Q25
- Campus services and facilities measures
- Do you think that the classrooms are appropriately equipped for classes offered on campus? Q26
- To what extent are you satisfied with the academic advising services? Q27
- How do you feel about course descriptions provided by the university? Q28
- Are the services from the library, computer labs, campus networks, bookstore, administration, and other logistics easily accessible and meeting your needs on campus? Q29
- What is your overall impression of the ease of class scheduling at this graduate professional school? Q30
- Is it important for the campus to provide assistance with your career development? Q31
- What campus service change or addition you like to see in the near future? (input-based question) Q32
MISC (Choices or Input-Based Questions)
- What is your major? Q33
- INSC 1
- SWENG 2
- SYSENG 3
- Other MBA 4
- How many years have you been enrolled in the program? Q34
- Less than 1 year 1
- 1–2 years 2
- 2–3 years 3
- 3 or more years 4
- When you were first enrolled, how many years had it been since the receipt of your baccalaureate degree? Q35
- 0–5 years 1
- 6–10 years 2
- 11 or more years 3
- When you were first enrolled, how many years had it been for you to work in the same field as your program? Q36
- 0–5 years 1
- 6–10 years 2
- 11 or more years 3
- Please provide the one aspect that you like most about this graduate professional school. Q37
- Course scheduling (7 weeks)
- Summer session classes
- Faculty
- Staff
- Program quality
- Location
- Parking
- Other
- Please provide the one aspect that you like least about this graduate professional school. Q38
- Course scheduling (7 weeks)
- Summer session classes
- Faculty
- Staff
- Program quality
- Location
- Parking
- Other
- What is your gender? Q39
- Male 1
- Female 2