
Chapter 8
Online Education Service and MOOCs
Radically, this chapter continues the discussion in Chapter 7, essentially serving as supplementary contents that complement the previous chapter. In Chapter 7, based on the known systems performance of a service system, we mainly focused on identifying some high priority factors that impacted the outcomes of consumed services and then recommended viable actions to retune the service system in real time for competitive advantage. To fully capture and understand people-centric service management and operations, we must explore what kind of service products people as individuals want, how they participate in the process of service transformation, and why they change their expectations throughout the service lifecycle. We understand that a service network approach must be investigated in order to accomplish this exploratory objective so that competitive services can be promptly discovered, personalized, designed and engineered, delivered, and improved in a repetitive and sustainable manner.
Approaches to improve education services in light of meeting different needs under different circumstances were the exploratory theme in Chapter 7. As we know, currently online teaching/learning is growing at a phenomenal rate. Indeed, online education is becoming a new trend, transforming the approach to higher education (Burnsed, (2011). The news on massive open online courses (MOOCs), starting from May 2012 when MIT and Harvard announced their launch of edX.com, has been overwhelming. MIT and Harvard operate edX (2012), Stanford and Berkeley run coursera (Coursera, (2013), and there are many others running as profit or nonprofit organizations that offer and deliver online higher education worldwide. Impressively, a growing number of elite private and public universities around the globe have joined these organizations to start to open their digital doors to the masses regardless of their locations, backgrounds, and educational purposes.
The participating universities are delivering some of their popular courses online for free. This new online education service engenders the opportunities to let anyone with an Internet connection learn from world-renowned professors and experts in the corresponding fields. Indeed, there is nothing new if the community is only interested in providing courses over the Internet. Distance education through broadcasting systems (e.g., TV-based course programs) has been widely adopted in China for over 30 years as of the fifth day of March in 2013. Distance education over the Internet has been particularly popular around the world since the Internet became pervasive in the 1990s. Many profit or nonprofit schools have offered degree-based courses for decades, and profit or nonprofit organizations around the world have been enjoying delivering their training programs to employees and customers by fully leveraging the Web technologies. However, the participation of top-tier research universities clearly marks a crucial milestone in the growing trend of digital learning. Disruptively, the proliferation of MOOCs “has the potential to transform higher education at a time when colleges and universities are grappling with shrinking budgets, rising costs and protests over soaring tuition and student debt” (Chea, (2012).
Although MOOC is still in its embryonic period and lacks sustainable business models, MOOC has notorious student retention rates. Massive opinions on MOOC in a negative way are centered at one that lacks the traditional pedagogies of engagement. Nevertheless, we will eventually find its business models that could be adapted, tailored, or customized by profit or nonprofit organizations. One potential use of MOOC surely is to help higher institutions improve their ongoing online and residential educations. In particular, degree-based online higher education can surely be improved by understanding the education market trend in terms of what individuals want and how they prefer to be pedagogically engaged over the virtual learning settings.
Truly online continuing higher education is quite different from residential college programs. Online degree students are typically part-time and much more diversified in both an educational background and work experience. Despite many higher education institutions providing online graduate professional studies, there is remarkably little published literature addressing scientific approaches that can be adopted to help online education service providers effectively apply pedagogies of engagement in an online higher education setting. By relying on the “known” knowledge in the pedagogies of engagement in college education, in this chapter we explore a system-based framework to acquire a better understanding of given online higher education settings. Through capturing the insights of formed learning networks, we discover methods and tools to positively leverage online students' engagement with a focus on improving learning effectiveness in online education in the long run.
More specifically, a suite of mathematical models in the form of integrated structural equation modeling (SEM) and social network analysis (SNA) approaches and corresponding relevant measures are defined and then applied to help evaluate and guide problem-based collaborative teaching/learning practices. As instructors and students are centered at this particular service context, we will focus on the analysis of their pedagogic interactions and relevant dynamics in the service system, aimed at identifying mechanisms to influence their teaching and learning behaviors in a positive manner (Figure 8.1). In other words, rules of thumb are generalized to help students/instructors retune collaborative practices in a proactive manner whenever possible for retaining life-long effective learning engagement in an online education setting. Using the lifecycle perspective of service improvements, Figure 8.1 is enriched from Figure 4.4. Note that Figure 8.1 focuses on the dynamics and interactions in a learning service system.
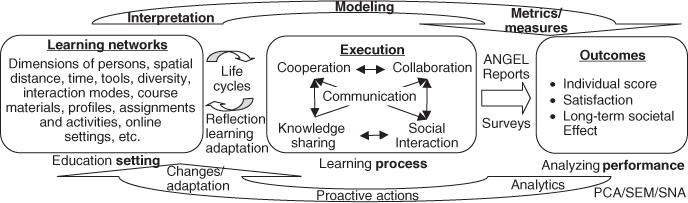
Figure 8.1 An integrative and interactive approach to manage and engineer a learning service system.
The remaining chapter is organized as follows. After a short introduction in Section 8.1, Section 8.2 briefly discusses a computational model of collaborative learning, which essentially describes the dynamics of collaborative learning with a focus on harnessing collaboration in a virtual learning setting. Sections 8.3 and 8.4 present an introductory approach to evaluate collaborative learning performance and the formed learning networks, aimed at identifying best practices to help transform collaborative learning so that learning effectiveness can be significantly improved over time. Section 8.5 highlights the significance of the illustrated case study. Finally, Section 8.5 provides a brief conclusion for this chapter.
8.1 Introduction
Cooperative learning and face-to-face interactions are an essential part of pedagogies of engagement defined as a necessity in the best practices of classroom-based undergraduate and graduate college education. Pedagogies of engagement in a traditional college setting have been studied for decades. Many researchers have focused on three of the main principles, namely exemplary practices; they are cooperation/interaction among students, student–faculty interaction, and active learning. A large-scale correlational study of what matters in college (involving 27,064 students at 309 colleges) finds that interaction among students and interaction between faculty and students were the two learning practice factors best predictive of a positive change in college students' academic development, personal development, and satisfaction (Astin, (1997).
In the early years of this millennium, the project entitled “The National Survey of Student Engagement” (NSSE) (NSSE, (2003) furthered the understanding of how students perceive classroom-based learning in their college education. The NSSE project confirms the proposition that student engagement, the frequency with which students participate in a variety of learning activities, represents an effective educational practice and is a meaningful proxy for quality of education. After conducting a comprehensive classroom-based learning practice study, Smith et al. (2005) conclude that the faculty who create and maintain education programs must consider not only the content and topics that constitute the degree but also how students are engaged with these materials over time. Simply put, engaged and consistent interactions over the learning period are an essential part of pedagogies of engagement in higher education. Wyatt (2011) recently explores and confirms the best practices at University of Memphis for nontraditional student engagement.
In engineering education, according to Tryggvason and Apelian (2006), “Countless committees, task forces, panels, and commissions have already addressed the need and eloquently emphasized that the competitiveness of the country and thus the general standard of living hinges on the ability to educate a large number of sufficiently innovative engineers.” Varieties of education research projects have been successfully completed, topics covering from pedagogy, policy, leadership, group learning, reengineering management for effectiveness, to new education paradigms (e.g., distance, blended/hybrid, self-learning) by leveraging the advancement of computing, networks, and telecommunication technologies (Gokhale, 1995; Garrison and Kanuka, 2004; Cheng, (2005); Moore, 2005; Tryggvason and Apelian, (2006); GHFP, 2006; NSB, (2007); NAP, (2009).
However, as the current way of educating the majority of engineers has changed remarkably little since the 1960s, there is a troubling lack of a good connection with the fast-changing reality of the global environment. It becomes necessary to transform the way we educate to produce the twenty-first century entrepreneurial engineer (O'Sullivan, 1999; Moore, 2005; Tryggvason and Apelian, (2006); Larson, 2009). Recently, many researchers have studied transformative education to address the twenty-first century phenomena of consumerism and globalization and have made progress in the ideological and pedagogical areas in a qualitative manner (O'Sullivan, 1999; Garison, 2000; Duerr et al., 2003; Mayo, 2003; Illeris, 2004; Moore, 2005; GHFP, 2006). One of the main challenges for transformative education is collaborative learning that receives much attention (Gokhale, 1995; Baker and Lund, 1997; Dillenbourg, (1999); Qiu, (2010). However, in the education community, little work has focused on promoting collaborative learning using a quantitative approach.
Collaborative learning is different from conventional structure-based cooperative learning. Collaborative learning as part of active learning emphasizes a group-based learning setting that is often complicated by cognitive, emotional, and social factors. It empowers members, and promotes the positive outcomes for both the group and individuals by motivating varieties of interaction and knowledge sharing (Cheng, (2005); Ebrahim et al., (2009); NAP, (2009); NSB, (2007); Thoms, (2011). Research in the classroom-based educational system has been done in promoting collaborative learning to address the twenty-first century phenomena of consumerism and globalization (Tryggvason and Apelian, 2006; Qiu, (2010). Little scientific research work on collaborative learning to improve students' learning engagement has been done for graduate professional studies, particularly in an online learning setting. Given that adult education is collaborative or participatory in nature (Dillenbourg, (1999); Marks et al., (2005); Fincher, (2010), collaborative learning should be fully leveraged for online and residential education.
Because of the quick advancements of digitalization and globalization, many scholars pay substantial attention to the descriptive and/or empirical study of virtual team-based project management (Andriessen and Verburg, (2004); Pauleen, 2004). Through an empirical study, Vickery et al. (1999) evaluate the inferred positions of virtual teams by examining the organizational structures' impact on team performance, and Lurey and Raisinghani (2001) focus on finding best practices in virtual teams. Shachaf and Hara (2005) then use an ecological approach to discuss team effectiveness in a virtual setting. A recent and quite comprehensive literature review on the study of virtual teams can be found in the work of Ebrahim et al. (2009), focusing on the analysis of innovation and activities and concluding that the knowledge and information that can be effectively captured, shared, and internalized is vital for innovation in a virtual R&D team.
A formal information-based network model of organizational performance in a distributed decision-making environment is presented by Carley and Lin (1997). Jin and Levitt (1996) develop a computational model of virtual design teams to understand the coordination needs derived from activity interdependencies. They model team members, activities, communications tools, and organizations; the developed model simulates the actions and interactions to evaluate organization performance by measuring project duration, cost, and coordination quality. Computational model approaches have also been used to study interventions, contingency, and cultural influences in virtual teams (Levitt et al., 1999; Wong and Burton, 2000; Thomsen et al., 2005). The question is if these newly explored approaches could be appropriately adopted in an online learning environment, in particular, for online engineering education.
To reduce the education cost by leveraging the advancement of e-learning, Goodwin et al. (2011) show the success of developing emulation-based virtual lab to give students an introduction to real-world control engineering design. By taking advantage of the convenience and richness of the Internet and multimedia technologies, Djenic et al. (2011) present an advanced and enriched variant of learning through delivering lessons over the Internet to enhance residential programs. As more and more higher education institutions offer online education to some extent, it becomes necessary for these higher institutions to understand how students perceive the delivery of e-learning. On the basis of a survey of 538 university students, Selim (2007) uses confirmatory factor models to reveal eight categories of e-learning critical success factors. These factors include instructor's attitude toward and control of the implemented e-learning technology, instructor's teaching style, student motivation and technical competency, student interactive collaboration, course coverage and structure, ease of on-campus Internet access, effectiveness of information technology (IT) infrastructure, and university support of e-learning activities. More recently, Orange et al. (2012) conclude a comprehensive evaluation of HigherEd 2.0—a Web 2.0-based pedagogical and technology framework for teaching STEM courses—in undergraduate mechanical engineering courses across four universities, aimed at identifying best practices in leveraging advanced online technologies to enrich and enhance higher education on campus.
However, online education is quite different from residential college programs. Quite often, they do not live on campus or in the same location. As they are geographically populated in different locations and around the world, the inherent on-campus types of interaction discussed earlier do not exist. Thus, the traditionally well-structured and mainly subject-based teaching/learning becomes less effective in an online education environment (Qiu, (2010). Unless online teaching/learning can be effectively adjusted, the same benefits of pedagogies of engagement will not result because of the absence of the needed learning engagement.
A pilot study concerned with the design, development, and evaluation of online courses for adult learners has been conducted by Antonis et al. (2011). They present a framework for the evaluation of three important educational issues, information, and support provided to learners at the start of and during their studies, learners' performance, and learners' satisfaction, involved in the process of online learning. They articulate the means to improve the proposed learning environment and the need for maintaining an optimal balance between synchronous and asynchronous activities, enhanced collaboration, and interactions among adult learners and instructors, aimed at optimally improving the effectiveness of online learning.
As an explanatory example for this book, we focus on online education. Relying on the concepts and principles of Service Science, this chapter presents a quantitative model and relevant measures to help evaluate and accordingly guide problem-based collaborative teaching/learning practices, aimed at positively leveraging online students' engagement to improve learning effectiveness in engineering degree-based education. A web-based course management system (eCMS) is used to manage the online courses under this study. The eCMS logs considerable data on how and when students have accessed learning materials and what kinds of and how teaching/learning interactions have occurred. The logged data in the eCMS, such as learning processes, teaching/learning activities, and student profiles and performance are used to evaluate and confirm the norm of pedagogies of engagement in an online learning setting. Similar to Chapter 7, by relying on the collected data, a suite of mathematical models—in the form of integrated SEM and SNA—is adopted to illustrate the dynamics of online learning circumstances. Rules of thumb are thus identified and generalized, aimed at guiding students/instructors to retune collaborative practices in a proactive manner for furthering the effective learning engagement.
8.2 A Systemic Approach to Analyze Collaborative Learning
Although an offered online course in college is only an education system miniature on campus, it surely involves all the educational necessities, including an instructor, teaching assistants, students, learning materials, and IT support systems that are used to assist the teaching and learning. As discussed earlier, adult education is collaborative or participatory in nature (Dillenbourg, (1999). Therefore, collaborative and problem-based learning that essentially relies on teams and projects are assumed to be the most predictive of positive outcomes in graduate professional education, particularly in an online setting. However, little scientific research work has been done in analyzing and accordingly helping enrich collaborative learning in this presumably preferable learning setting for professionals. As opposed to the qualitative approach to explore project team dynamics proposed by Andriessen and Verburg (2004), an integrative and interactive approach in a quantitative manner (Thompson et al., (2009); Qiu, (2010) to achieve a better understanding of the online learning dynamics throughout semesters is necessary.
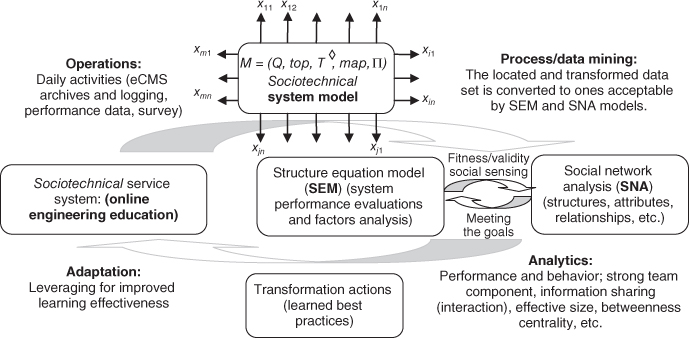
Figure 8.2 A detailed approach to leverage collaborative learning.
By relying on the “known” in the pedagogies of engagement in college education, we explore a systemic approach to guide online education practices. More specifically, quantitatively analyzing and accordingly facilitating collaborative learning in a project and team-based learning setting is the focus of this case study. As computational thinking can fully leverage today's ubiquitous digitalized information, computing capability, and computational power, it has evolved as one of the optimal ways of solving problems, designing systems, and understanding human behavior. Computational thinking promotes quantitative thinking in terms of abstractions, modeling, and understanding of the dynamics of a studied people-centric service system (Qiu, (2009). Derived from the discussion in the preceding chapters, and from Figure 5.12, Figure 8.2 gives a detailed view of the adopted computational thinking and systemic approach (Qiu, (2009); Qiu, (2010), aimed at leveraging collaborative learning for improved learning effectiveness in an online engineering education setting.
In general, factors that considerably impact online education include instructor's attitude toward and control of the implemented e-learning technology, instructor's teaching style, student motivation and technical competency, social interaction and collaboration, and course coverage and structure (Beldarrain, (2006); Selim, (2007); Department of Education, (2008); Dymalski, (2011); Parry, (2012). When compared to resident instruction (RI)-based education, online education is disruptively confronted with unprecedented challenges, such as how to nurture and nourish students' self-discipline, encourage social interaction and collaborative learning, and develop a system that can monitor course progression and suggest swift actions to enhance the positive learning atmosphere in an online setting.
In this chapter, we focus on exploring a framework to help monitor and facilitate students' online learning experience so that a pleasant and positive environment is maintained for effective online learning. Without the loss of generality, we mainly show an approach to conduct longitudinal empirical studies of collaborative learning. Initially, the focus is on understanding students' self-disciplines and their interactions and collaborations throughout a course. We collect data related to student profiles, course materials, learning activities, class interaction, performance, as well as their responses to questionnaires. We then apply an integrative approach using principal component analysis (PCA), SEM, and SNA to pinpoint any weakness in the formed online learning networks and identify appropriate actions that the instructor might take to enrich the students' learning experiences within an online learning setting. All of this can be applied to further improve learning outcomes over time.
Self-discipline plays a key role in online education. Frequently, online students make a learning plan at the very beginning of a course, and then follow that plan to realize the course learning objectives. The literature (Dillenbourg, (1999); Qiu, (2010); Djenic et al., (2011); Thoms, (2011); Wyatt, (2011) clearly demonstrates that collaborative learning substantively compensates for the missing conventional social interactions and on-campus engagements. For an online course, collaborative learning, which essentially relies on a variety of interactive and collaborative activities throughout the semester, is the best predictor of positive learning outcomes (Qiu, (2010).
Conceptually, Figure 8.3 illustrates how the collaborative learning network dynamics for a given week, in a given class, exists in a virtual setting. As indicated in Figure 8.3a, the learners' profiles, online activities (e.g., class interaction, discussion activities, communications, etc.), performance, and their responses to designated questionnaires are quantitatively aggregated, algorithmically mined, and analytically processed, which can then be modeled using a SNA tool. Furthermore, the class interaction social network model can be augmented by adding learning activities related to assignments (e.g., Q1: video clip and online question, Q2: online quiz, and Q3: hands-on), which provides the data needed to understand the evolving nature of social networks varying with different topics/assignments from week to week. By developing a sequence of models throughout a semester, model variations might be indicative of an impeding problem, and appropriate actions to help can be suggested to retune teaching/learning practices in a virtual learning environment.
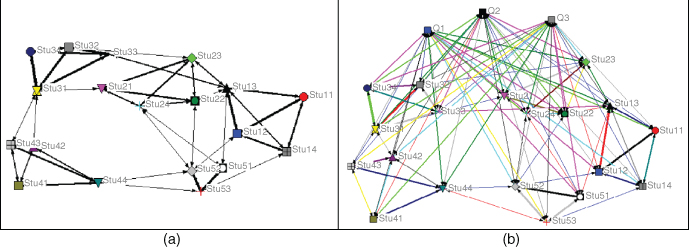
Figure 8.3 Models of learners' social interaction in an online collaborative learning network. (a) PCA/SNA: class interaction social network; (link thickness: tie strength (interaction); darkness and shape: personal profile; size of nodes: class activities). (b) PCA/SNA: augmented class interaction (adding Q1, Q2, and Q3 assignments).
The above-mentioned exploratory scenario based on an integrative and interactive approach to achieve a better understanding of the online learning settings can be extended semester by semester (Figure 8.4). As an illustrative case study for this book, we focus on identifying a couple of mechanisms for fostering self-motivation and learning the best practices for leveraging collaborative learning to improve online education. Therefore, only relevant rather than comprehensive data will be presented hereafter.
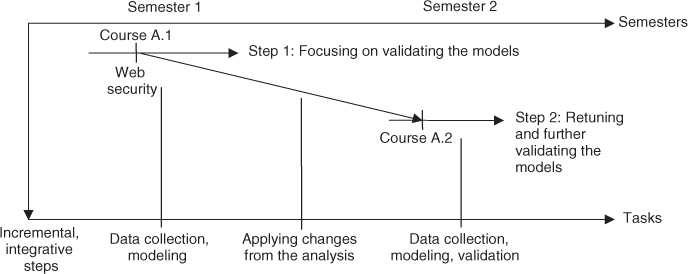
Figure 8.4 Exploratory tasks and milestones.
We focus on showing how the framework presented in Figure 8.2 can be well applied in practice. In Figure 8.4, we provide the stages for this conducted exploration and what the relevant tasks must be completed during each of these stages.
- Exploring an Online Course Twice. One engineering graduate course is studied. The selected course is then taught again during semester II (Figure 8.4). Data for courses are fully collected through the eCMS, including class activities, interaction, student profiles, and learners' performance. For each class, data are logged week by week throughout a semester. In addition, a precourse survey is used to get a better understanding of the general background of each class; peer and self-reviews are conducted at the end of each course to know how students feel about the adopted collaborative learning practice.
- Performing Analytics With Scientific Rigors. A suite of mathematical models in the form of integrated SEM, PCA, and SNA are applied. First (in Section 8.3), SEM is used to conduct confirmatory factor analysis for the selected online course during semester I (Qiu, (2010). PCA and SNA are also applied to analyze the teaching/learning dynamics and performance to pinpoint the strength and weakness of studied online course. Appropriate actions are identified for the studied course in semester II. Secondly (in Section 8.4), we make some changes from what we learned from semester I. Instead of exploring system-level performance and factor analysis, we will focus on data and network analysis to decipher how students interact within teams and in class, aimed at finding ways to change team structures and help individuals be better engaged within teams and in class to enhance their learning experience. In addition, an enriched data (or instruments) set is used for the second time in order to show if the list of identified changes actually makes a difference if applied.
In this demonstrative example, we show how to explore mechanisms that can be used to cultivate and/or nourish the needed self-discipline and determine learn collaborative learning best practices so as to compensate for the missing on-campus interaction in a residential course. Specifically, we show how to find and identify progress and potential problem areas for students in an online class in a real-time, integrative, and evolving manner. Ultimately, this developed framework can be essentially utilized to adjust and enhance teaching/learning practices and promote students' active and positive engagements in online education so that effective learning outcomes can be systematically achieved.
8.3 Collaborative Learning Analytics: Part I
As discussed earlier, collaborative learning relies on an interactive group-based learning setting to promote the positive outcomes for both the group and group members. Collaborative learning leverages the diversity and richness of a group and the different strength of individuals. Compared to subject-based assignments, problem-based assignments can considerably motivate and encourage varieties of interaction and knowledge sharing in such a learning environment. When collaborative learning and problem-based assignments are properly combined, the most predictive of positive outcomes in the graduate professional education, particularly in an online setting, should result (Astin, (1997); NSSE, (2003); Hansen, (2006); Antonis et al., (2011). This chapter presents a model, theory, and framework for quantitatively analyzing the systemic dynamics of an online class, aimed at developing rules of thumbs for online classes to retune collaborative protocols for improved learning outcomes.
Once again, it is fully understood that a one-size-fit-all thinking should be avoided as different paradigms might be more appropriate for certain circumstances. Therefore, by simply addressing a fundamental understanding of collaborative learning, the following essential three exploration steps, data collection, SEM for learning effectiveness evaluation (Qiu, (2010), and SNA for analyzing the interaction dynamics within teams and in class to pinpoint the strength and weakness of teams' behavior in an online learning setting, will be mainly studied.
8.3.1 Data Collection
An online class was used to validate the applicability of the proposed approach. As mentioned earlier, an eCMS was used to manage the online courses under study. The web system logged all data on how each student accessed learning materials and how they interacted with instructors and each other. The logged students' access data, archived teaching/learning activities, and student profiles and performance are first collected, and then appropriately transformed; all are thus made ready for conducting analytics.
The learning outcomes of teams and individuals largely depend on how team members perform collectively, how they collaborate with each other, and how a team as a whole acts when challenges are confronted from time to time. In general, the following aggregated core measurements collectively reflect how a team is doing at the point of measure: norms (indicated by respects, preferred learning styles, personalities, trust, etc.), communication and mutuality (indicated by learning setting, communication tools, betweenness, information sharing methods and tools, etc.), team capability (indicated by self-learning capability, skills/knowledge on the subject, team competency, etc.), teaching/learning methods, and others (Astin, (1997); Thompson et al., (2009); Qiu, (2010).
As known, adult education is collaborative or participatory in nature (Dillenbourg, (1999); Marks et al., (2005). Thus, collaborative learning should be fully leveraged for graduate professional online education. According to the “known” knowledge of effective adult online learning (Imel, (1991); Smith and Smarkusky, (2005); Marks et al., (2005); Thompson et al., (2009), when leveraging online students' engagement to improve learning effectiveness in graduate professional engineering degree education is the focus, the following learning manifest variables and performance indicators should be essentially included:
- Instructor–student pedagogical engagement
- Q1 The instructor provided sufficient questions through email, online board, social media, etc.
- Q2 The instructor answered sufficient questions through email, online board, etc.
- Q3 The instructor always responded to student inquiries in a timely manner.
- Q4 The adequacy of the instructor's knowledge of the subject matter.
- Q5 The appropriateness of the instructor's encouragement of student discussion.
- Student's background, readiness, and commitment
- Q6 Student's aptitude for collaborative learning before he/she took the course.
- Q7 Student's background for the course subject before he/she took the course.
- Q8 Student's readiness before he/she took the course.
- Student–student pedagogical engagement
- Q9 Student's aptitude for collaborative learning before he/she took the course.
- Q10 Student's background for the course subject before he/she took the course.
- Q11 Student's readiness before he/she took the course.
- Q12 The student always participated in team activities when working on assignments within his/her team.
- Learning materials and supports
- Q13 The usefulness of team problem-based assignments.
- Q14 The effectiveness of the integration of instructional materials (textbooks, lecture notes, papers, online forums, etc.).
- Q15 The adopted teaching that helps to maintain a climate conducive to learning.
- Q16 The adopted learning methods that help to maintain a climate conducive to learning.
- Perceived learning
- Q17 The amount of information provided in this online course is adequate.
- Q18 This online course experience meets the student's learning expectations.
- Q19 The appreciation of online collaborative learning activities after taking this course.
- Q20 Performance. Individual's contribution and quality of work (peer evaluation).
- Q21 Performance. Learned and individual expectation met (self-evaluation).
- Q22 Performance. Final score (instructor's evaluation).
In this studied course, three to four students were randomly assigned to teams and in total five teams were created. After the teams were formed, the eCMS automatically logged data on how each team and individuals participated in class activities and interacted with each other and the instructor during the study period (i.e., one semester). One precourse survey collected students profile information, which is mainly concerned with individual's backgrounds, work experience, and expectations. One postcourse survey at the end of the semester was used to collect information on what and how teams and individuals performed using peer reviews and self-evaluations (Smith and Smarkusky, (2005), which also asked whether their expectations were met. The instructor evaluated the quality of the interactions (e.g., postings, responses, etc.). Table 8.1 summarizes all the data that were essentially collected in this study. If the same category data were collected from more than one source, the final data of that category for each student were the average calculated from all sources.
Table 8.1 Data Sources Information
| eCMS | Precourse Survey | Postcourse Survey | Peer and Self-Reviews | Instructor Evaluation |
| Q1, Q2, Q6, Q7, Q9, Q10, Q11, Q12 | Q6, Q8, Q11, Q12, Q20, Q21 | Q2, Q3, Q4, Q5, Q6, Q8, Q13, Q14, Q15, Q16, Q17, Q18, Q19 | Q6, Q8, Q11, Q12, Q20, Q21 | Q22 |
8.3.2 Evaluating Learning Effectiveness
As discussed in the preceding chapters, SEM has been widely used to study social and/or economic behavior of organizations. Using the indicators (i.e., measurements, or manifest variables) from both social and technical perspectives of a service system, SEM can be effectively applied in this service-oriented interdisciplinary field (Chin et al., (2003); Marks et al., (2005); Qiu, (2009); Qiu, (2010). As compared to many covariance-based modeling approaches, the partial least squares approach to structural equation modeling (PLS SEM) is a soft modeling approach with relaxation of measurement distribution assumptions (Figure 8.5). In addition, PLS SEM requires only a small size of measurement samples and tolerates measurement errors.
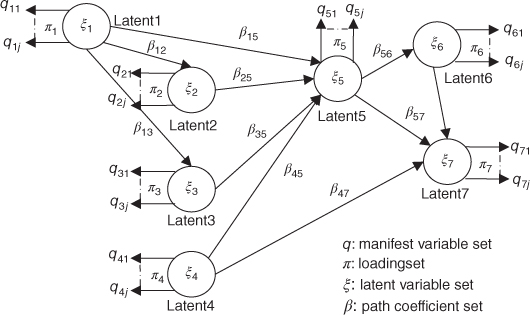
Figure 8.5 A PLS SEM for a service system.
Let us briefly review the models first. For a reflective measurement model, measurement variables are a linear function of their latent variable ![]() plus a residual
plus a residual ![]() , and
, and ![]() is the loading set, that is,
is the loading set, that is,
The previous equation implies that the residual ![]() has a zero mean and is uncorrelated with the latent variable
has a zero mean and is uncorrelated with the latent variable ![]() . For a formative measurement model, the latent variable
. For a formative measurement model, the latent variable ![]() is a linear function of its measurement variable plus a residual
is a linear function of its measurement variable plus a residual ![]() , that is,
, that is,
For the structural model, the path coefficients between latent variables ![]() is given by
is given by
where ![]() is the vector of residual variance.
is the vector of residual variance.
With the exception of survey data that will be in Likert scale, logged data in the eCMS are in numbers, regular texts, or standard XML formats. These non-Likert data must be converted into Likert-scale data accepted by SEM (Qiu et al., (2011). An SEM diagram is generated using data of one semester (Figure 8.6). As indicated in Figure 8.6, the coefficient of students' profile is 0.429, standing at the highest influence path. This clearly indicates that the learning outcomes of students mostly depend on students' background, commitment, and diligence. However, the analytical result surely confirms that the student–student (with a path coefficient of 0.276) and student–instructor (with a path coefficient of 0.414) interactions play a key role in improving student's learning experience in graduate professional studies (Marks et al., (2005).
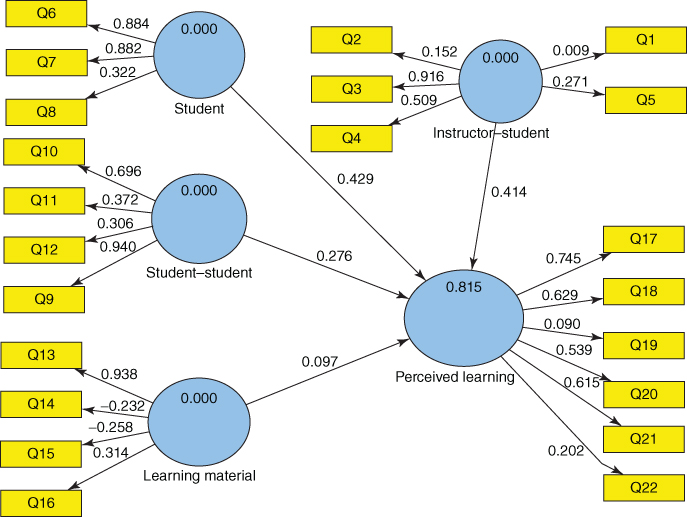
Figure 8.6 An SEM study of online collaborative and problem-based learning.
8.3.3 Identifying Best Practices
Varieties of collaborative behavior, such as time to communicate, the frequency of interactions within a team, how team members communicate, and the frequency of an individual's class discussion participation, are highly correlated to the SEM structural and relation attributes at a given time (Selim, (2007). Although it is well proven in empirical studies that group or component structural properties and information flow characteristics substantially impact on the effectiveness of team interaction and collaboration (Imel, (1991); Smith and Smarkusky, (2005); Marks et al., (2005); Thompson et al., (2009); Qiu, (2010), a quantitative understanding of how these factors affect the learning service system dynamics is not seen in the literature. In other words, the outcomes of an online professional class by encouraging positive pedagogical engagement within the class should be explored in a quantitative manner. In this section, we show a systemic approach to identify best practices in leveraging online students' engagement to improve learning effectiveness in graduate professional engineering degree education.
Figure 8.6 shows that many factors substantially affect the final learning outcomes of online students. To understand how pedagogical engagement affects the outcome of online learning in a practical manner, SEM for problem-based and collaborative learning can be further retuned by simplifying its structure by removing these factors that are not directly related to pedagogical engagement. As indicated in Figure 8.7, this focused SEM aims at finding the casual relationships between engagement-related learning factors and the class performance. Table 8.2 shows how a quantitative improvement of each of these engagement-related learning factors would impact the learning performance. The impact score is essentially the potential unit improvement after one unit change in the corresponding learning factor (Chin et al., (2003); Qiu, (2009); Qiu, (2010). In instructor–student interaction category, Q3 (instructor–student interaction after class) substantially and positively influences the students' learning outcomes. In student–student interaction category, Q9 (student–student asking each other questions) and Q10 (student–student interaction, in general) outperform other factors.
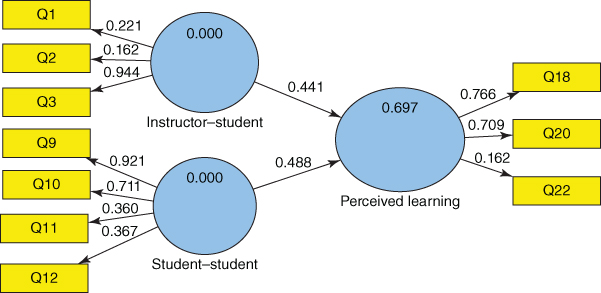
Figure 8.7 An SEM mainly concerned with pedagogical engagement.
Table 8.2 Class Learning Performance Main Factors and their Effects
| Learning Factors | >Mean | Loading | Coefficient | Impact Score |
| Q1 (instructor asking questions) | 4.44 | 0.221 | 0.441 | 0.221 × 0.441/1.33 = 0.07 |
| Q2 (instructor–student interaction in class) | 4.50 | 0.162 | 0.162 × 0.441/1.33 = 0.05 | |
| Q3 (instructor–student interaction after class) | 3.00 | 0.944 | 0.944 × 0.441/1.33 = 0.31 | |
| Q9 (student–student asking each other questions) | 2.50 | 0.921 | 0.488 | 0.921 × 0.488/2.36 = 0.19 |
| Q10 (student–student interaction, in general) | 2.61 | 0.711 | 0.711 × 0.488/2.36 = 0.15 | |
| Q11 (student's cooperation) | 4.50 | 0.360 | 0.36 × 0.488/2.36 = 0.07 | |
| Q12 (student's participation) | 4.56 | 0.367 | 0.367 × 0.488/2.36 = 0.08 |
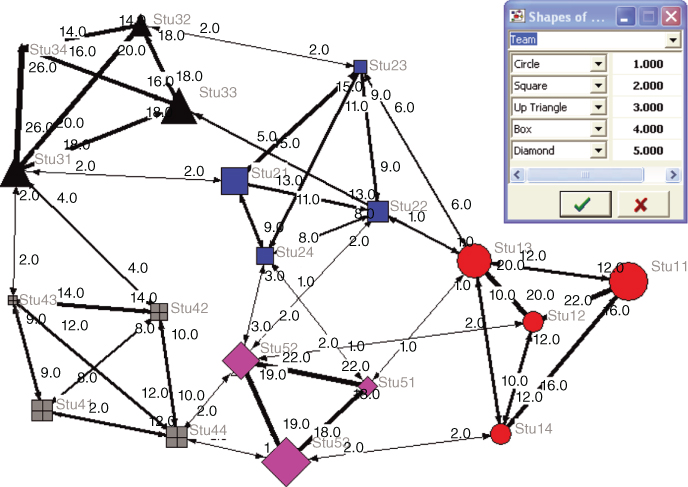
Figure 8.8 An SNA model of collaborative learning network.
Table 8.3 Collaborative Learning Effectiveness
| Weighted Average Grade | Team Activities in Class ( |
Team Activities in Group ( |
Cooperation Within the Group ( |
Participation Within the Group ( |
Collaborative Learning Effectiveness |
|
| Team 1 | 9 | 7 | 6 | 9 | 10 | 0.78 |
| Team 2 | 8 | 4 | 3 | 9 | 9 | 0.58 |
| Team 3 | 9 | 6 | 8 | 9 | 9 | 0.78 |
| Team 4 | 8 | 7 | 2 | 9 | 9 | 0.64 |
| Team 5 | 10 | 7 | 9 | 10 | 10 | 0.88 |
Derived from network theory, SNA has been widely used in the study of sociology, anthropology, communication, economics, information science, organizational behavior, and psychology (SNA, (2011). Note that SNA has been recently moved from being a suggestive metaphor to an analytic approach, focusing on the understanding and management of sociotechnical systems in a quantitative manner. For example, without assumption that groups are the building blocks of society, the approach becomes open to studying less-bounded sociotechnical systems, leading to the research scope extended from bounded communities to virtual connections among websites. How the dynamic structures of physical and virtual ties affect the individuals and their relationships have recently attracted substantial attention worldwide. Conventional analyses assume that socialization into norms determines the behavior; on the contrary, network analysis explores how and why the structure and composition of ties might affect norms (SNA, (2011). Thus, collaboration graphs describing virtual learning settings are used to measure and improve the effectiveness of collaborative relationships between the participants in the formed learning network in this case study.
UCINET (Borgatti et al., (2002) is a popular SNA tool. When data on interaction dynamics within teams and in class are loaded into UCINET, a social learning network model is generated (Figure 8.8). In Figure 8.8, link thickness shows the tie strength (i.e., interaction between individuals), darkness and shape indicate team information, and the size of nodes then illustrates individual class participation activities such as posting questions and answers. Detailed explanations of these activities are provided in Table 8.3. Team activities in class (![]() ) were derived from Q9 (i.e., student–student asking each other questions); team activities in group (
) were derived from Q9 (i.e., student–student asking each other questions); team activities in group (![]() ) were derived from Q10 (i.e., student–student interaction when they worked on problem-based projects); cooperation within group (
) were derived from Q10 (i.e., student–student interaction when they worked on problem-based projects); cooperation within group (![]() ) were derived from Q11 (i.e., cooperation when working on problem-based projects within the team); and finally participation within group (
) were derived from Q11 (i.e., cooperation when working on problem-based projects within the team); and finally participation within group (![]() ) were derived from Q12 (i.e., participation when working on problem-based projects within the team).
) were derived from Q12 (i.e., participation when working on problem-based projects within the team).
To compare how individuals in a team collaborate, team-based collaborative learning effectiveness must be defined. On the basis of the previous analyses, collaborative learning effectiveness can be defined as follows
where ![]() is the set of indicators defined as collaborative team activities. For a given factor
is the set of indicators defined as collaborative team activities. For a given factor ![]() , 10 is the maximum. For a given team,
, 10 is the maximum. For a given team, ![]() ,
, ![]() is the
is the ![]() th team member for the
th team member for the ![]() th factor and
th factor and ![]() is the number of team members. In Equation 8.4,
is the number of team members. In Equation 8.4, ![]() is the corresponding weights that are defined in Figure 8.5 and computed using SmartPLS (as shown in Figure 8.6), and 0 ≤
is the corresponding weights that are defined in Figure 8.5 and computed using SmartPLS (as shown in Figure 8.6), and 0 ≤ ![]() ≤ 1. If a given team's
≤ 1. If a given team's ![]() is close to 1, the team is doing well in terms of collaboration when the team works on the team-based class assignments. Table 8.3 gives how teams collaborated based on collected data during this case study. It clearly indicates that Team 5 is more collaborative than other teams. The collaborative effectiveness is highly correlated to the learning outcomes as Team 5's weighted average grade in 10 (Maximum).
is close to 1, the team is doing well in terms of collaboration when the team works on the team-based class assignments. Table 8.3 gives how teams collaborated based on collected data during this case study. It clearly indicates that Team 5 is more collaborative than other teams. The collaborative effectiveness is highly correlated to the learning outcomes as Team 5's weighted average grade in 10 (Maximum).
When the outcomes in Tables 8.2 and 8.3 are considered together, it becomes clear that learning effectiveness is positively and highly correlated with students' engagement in an online learning setting. In other words, although online education lacks varieties of in-person interaction affluent in traditional residential programs, best collaborative learning practices in a virtual setting can be appropriately leveraged, resulting in achieving positive and effective learning engagement for improved graduate engineering degree education.
Through this system-based quantitative exploration and with the support of the qualitative feedbacks from the students, the following best collaborative teaching practices are identified:
- Preparing more team-based assignments and activities, so students can be more actively involved in class and team discussions.
- Allowing students to use different communication means. Different teams might prefer to use some different collaborative tools with which they are familiar. When they can choose their own ways to share and interact, they tend to be more active.
- Encouraging a team to have coleaders for each team assignment. By doing this way, the team can stay active without disruption in case that an emergency circumstance with one of team leaders occurs.
- Initiating and maintaining constant communications with students by asking questions, sharing new findings on the Internet, and answering their questions in a timely manner.
All the above-identified best practices essentially focus on encouraging students to get more involved in the activities described in Table 8.3. The identified rules of thumb could be embedded in the eCMS as a teaching/learning guidance. For instance, at the beginning of each week, the system provides a relevant alert message that reminds students/instructors of retuning their collaborative practices in a proactive manner. As a result, we can improve or retain effective learning engagement with the class from week to week.
8.3.4 Brief Remarks on Part I of Collaborative Learning Analytics
By taking advantage of the rich data in the eCMS, a web-based course management system for online engineering degree education, this section aimed at providing a systemic approach to help instructors and administrators evaluate and guide problem-based collaborative teaching/learning practices. More specifically, by relying on the collected system data and course surveys, an integrated SEM and SNA approach was proposed to describe a variety of learning circumstances, which helps to identify certain rules of thumb that could be used to guide students/instructors to retune their collaborative practices in a proactive manner for improving or retaining effective learning engagement.
As compared to many traditional empirical studies that focus on hypotheses testing, this study relied on the “known” in the pedagogies of engagement in college education, and then proposed a systemic approach to explore effective mechanisms of leveraging students' engagement in pursuit of effective online learning practices. More specifically, this exploration confirmed the general norms in the pedagogies of engagement in education and innovatively presented a system-based framework that could be practically and fully integrated in online education settings.
However, this exploration is limited because of the limited availability of online classes during the first study period. More experiments to further validate the presented model should be conducted. The limits of this exploration and corresponding further works are summarized as follows:
- The data sample size was small. Other new findings might be revealed using empirical studies, which can enrich the presented effectiveness index model. Indeed, this is what we discuss in the next section.
- The simplified model illustrated in Figure 8.6 requires further investigation. For example, probabilistic-based analysis methodology such as SEM-based and semisupervised Bayesian networks can be included to improve the accuracy of analyses. This will be further discussed in Chapter 9.
- The identified best practices were applied manually in the following courses offered online. This should be ultimately applied in real time. In other words, the framework proposed in Figure 8.1 should be fully implemented in a closed-loop manner. As a matter of fact, this is exactly the purpose of Service Science research in the long run, which was discussed in Chapter 7 and is further articulated in Chapter 9.
In summary, instead of simply finding the facts and proving the hypotheses using empirical studies, this exploration took a system-based approach, aimed at resulting in better qualitative and quantitative guidelines that can be applied and integrated in the eCMS or the like to help students/instructors retune collaborative practices in a proactive manner for improving or retaining effective learning engagement. Thus, online learning could overall have the same effect as that of classroom-based education in light of the appreciation of pedagogies of engagement, although the traditional on-campus and face-to-face interactions largely disappear over the Internet.
8.4 Collaborative Learning Analytics: Part II
We conducted our second exploration as planned. During the second semester, we had more students. More importantly, we made certain changes based on the “rules of thumb” we developed in our previous analysis. Hence, it will be intriguing to see if any improvement has been made in light of improving collaborative learning effectiveness.
8.4.1 Individual's Profile, Learning Activities, and the Learning Outcomes
We first check how the class was doing overall in terms of their participation in the discussion forums. It is well known that learning outcomes are positively correlated to learning objectives. Table 8.4 shows the number of individual activities throughout the semester. It is clear that individuals' learning outcomes are highly correlated with their participations on the discussion forums. In other words, students' interactions in a virtual learning setting play a critical role in helping them achieve their learning objectives.
Table 8.4 The Overall Online Interactive Discussions in Terms of Individual's Participation
| User ID | Final Grade | Total Posts | Posts | Replies | Peer replies |
| S201 | 89 | 16 | 9 | 7 | 5 |
| S202 | 92 | 16 | 7 | 9 | 17 |
| S203 | 84 | 21 | 12 | 9 | 10 |
| S204 | 97 | 74 | 19 | 55 | 47 |
| S205 | 89 | 14 | 7 | 7 | 5 |
| S206 | 94 | 28 | 10 | 18 | 27 |
| S207 | 98 | 47 | 21 | 26 | 43 |
| S208 | 91 | 16 | 8 | 8 | 3 |
| S209 | 94 | 16 | 8 | 8 | 13 |
| S210 | 92 | 17 | 10 | 7 | 5 |
| S211 | 94 | 46 | 10 | 36 | 20 |
| S212 | 86 | 15 | 9 | 6 | 6 |
| S213 | 90 | 21 | 11 | 10 | 11 |
| S214 | 91 | 32 | 14 | 18 | 22 |
| S215 | 82 | 18 | 9 | 9 | 7 |
| S216 | 96 | 51 | 19 | 32 | 35 |
| S217 | 87 | 27 | 13 | 14 | 9 |
| S218 | 90 | 17 | 8 | 9 | 10 |
| S219 | 98 | 31 | 14 | 17 | 12 |
| S220 | 93 | 16 | 7 | 9 | 17 |
| S221 | 76 | 15 | 9 | 6 | 6 |
| S222 | 92 | 18 | 9 | 9 | 19 |
| S223 | 93 | 19 | 8 | 11 | 12 |
| S224 | 87 | 13 | 7 | 6 | 4 |
| S225 | 96 | 23 | 8 | 15 | 14 |
| S226 | 78 | 18 | 9 | 9 | 10 |
| S227 | 90 | 57 | 18 | 39 | 34 |
| S228 | 96 | 33 | 15 | 18 | 28 |
| S229 | 98 | 52 | 20 | 32 | 24 |
| S230 | 99 | 63 | 31 | 32 | 58 |
| S231 | 93 | 16 | 7 | 9 | 15 |
| S232 | 100 | 83 | 11 | 72 | 33 |
| S233 | 92 | 36 | 10 | 26 | 23 |
| S234 | 89 | 15 | 7 | 8 | 5 |
| S235 | 98 | 39 | 10 | 29 | 22 |
| Correl (Xi, Final Grade) | 0.597 | 0.438 | 0.57785 | 0.6266 |
We can look into insight of students' online interactions by analyzing the correlations between different kinds of participations, including submitting an original post, responding to others' posts and receiving responses from classmates. Three corresponding correlations are depicted in Figure 8.9. Evidently, if one is active in submitting posts, one replies others and also receives more responses.
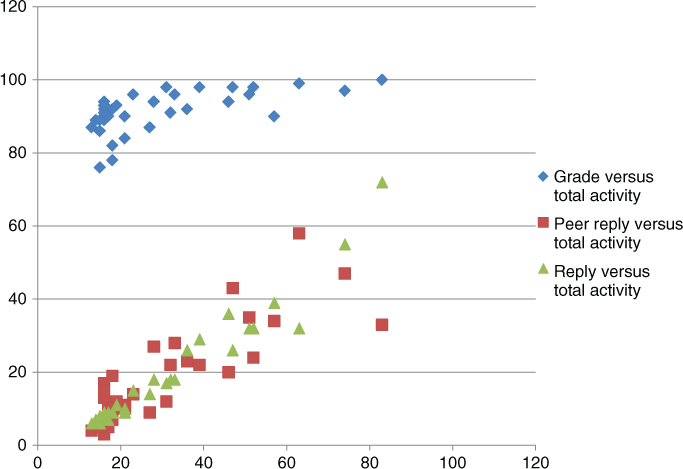
Figure 8.9 Individual's activity versus performance (i.e., individual learning outcomes).
Team assignments were mainly used to encourage students to get engaged pedagogically. It is well recognized that team projects can significantly promote and facilitate collaborative learning. Thus, we secondly check how individuals performed within their team settings. People might think that one has more team experience in the past could contribute more to the team work. The same speculation is also often applied to team attitude. We found that neither was true (Table 8.5), although we did find that individual's team experience is highly correlated to one's team attitude in this second exploration. Dots are sporadic in Figure 8.10, which indicates that individual's team experience and attitude are not well correlated to one's contribution to the quality of team work.
Table 8.5 Individual's Team Contribution Versus Team Experience and Attitude
| User ID | Team Experience | Team Attitude | Contribution to the Team |
| S201 | 5 | 4 | 97 |
| S202 | 5 | 5 | 100 |
| S203 | 6 | 7 | 90 |
| S204 | 7 | 6 | 92 |
| S205 | 7 | 6 | 72 |
| S206 | 6 | 6 | 95 |
| S207 | 7 | 6 | 87 |
| S208 | 6 | 5 | 95 |
| S209 | 1 | 5 | 95 |
| S210 | 5 | 5 | 92 |
| S211 | 6 | 6 | 72 |
| S212 | 1 | 5 | 100 |
| S213 | 4 | 4 | 90 |
| S214 | 6 | 5 | 80 |
| S215 | 5 | 5 | 45 |
| S216 | 6 | 4 | 82 |
| S217 | 5 | 4 | 90 |
| S218 | 7 | 6 | 85 |
| S219 | 7 | 5 | 95 |
| S220 | 7 | 7 | 97 |
| S221 | 5 | 7 | 67 |
| S222 | 6 | 5 | 95 |
| S223 | 5 | 4 | 100 |
| S224 | 5 | 6 | 85 |
| S225 | 4 | 5 | 100 |
| S226 | 2 | 1 | 65 |
| S227 | 4 | 7 | 65 |
| S228 | 4 | 3 | 100 |
| S229 | 6 | 5 | 10 |
| S230 | 5 | 7 | 95 |
| S231 | 6 | 6 | 100 |
| S232 | 5 | 5 | 100 |
| S233 | 1 | 5 | 90 |
| S234 | 4 | 6 | 85 |
| S235 | 7 | 7 | 100 |
| Correl (Xi, Team Quality | −0.054 | 0.028 | |
| Correl (Experience, Aptitude) | 0.422 |
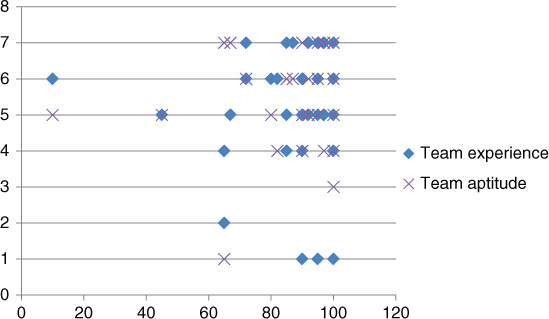
Figure 8.10 Individual's team experience/attitude versus contribution to the team.
Thirdly, we study how individuals performed in their team settings. We were particularly interested in how individual's team involvements, in general, are correlated to their contributions to the team work. Table 8.6 shows three measurements we used to evaluate individuals' involvements within their teams.
Table 8.6 Individual's Team Contribution Varying With Participations Within the Team
| User ID | Cooperation | Dependability | Participation | Contribution to the Team |
| S201 | 95 | 90 | 90 | 97 |
| S202 | 100 | 100 | 97 | 100 |
| S203 | 90 | 85 | 90 | 90 |
| S204 | 90 | 95 | 87 | 92 |
| S205 | 85 | 80 | 70 | 72 |
| S206 | 95 | 90 | 90 | 95 |
| S207 | 90 | 90 | 95 | 87 |
| S208 | 100 | 97 | 92 | 95 |
| S209 | 100 | 100 | 95 | 95 |
| S210 | 95 | 95 | 95 | 92 |
| S211 | 100 | 100 | 85 | 72 |
| S212 | 95 | 97 | 95 | 100 |
| S213 | 90 | 82 | 87 | 90 |
| S214 | 92 | 75 | 90 | 80 |
| S215 | 65 | 45 | 45 | 45 |
| S216 | 95 | 95 | 90 | 82 |
| S217 | 85 | 75 | 70 | 90 |
| S218 | 90 | 90 | 90 | 85 |
| S219 | 95 | 95 | 95 | 95 |
| S220 | 100 | 100 | 100 | 97 |
| S221 | 95 | 77 | 62 | 67 |
| S222 | 100 | 100 | 95 | 95 |
| S223 | 95 | 95 | 90 | 100 |
| S224 | 85 | 85 | 85 | 85 |
| S225 | 100 | 100 | 100 | 100 |
| S226 | 70 | 60 | 65 | 65 |
| S227 | 95 | 65 | 65 | 65 |
| S228 | 80 | 95 | 95 | 100 |
| S229 | 100 | 100 | 95 | 10 |
| S230 | 100 | 95 | 85 | 95 |
| S231 | 100 | 97 | 100 | 100 |
| S232 | 100 | 100 | 100 | 100 |
| S233 | 95 | 95 | 90 | 90 |
| S234 | 100 | 95 | 90 | 85 |
| S235 | 95 | 97 | 95 | 100 |
It comes with no surprise. We found that individual's participations in a team setting are also highly correlated to one's contribution to the quality of team work. Figure 8.11 shows how individual's team involvements correspond to one's contribution to the team work, which clearly shows that both individuals' dependability of finishing assignments within teams and their participations are correlated to their contributions to the quality of team work. Cooperation was measured in a subjective way. We did not find that this perceived measurement of individual's team attitude was well correlated to one's contribution to the quality of team work.
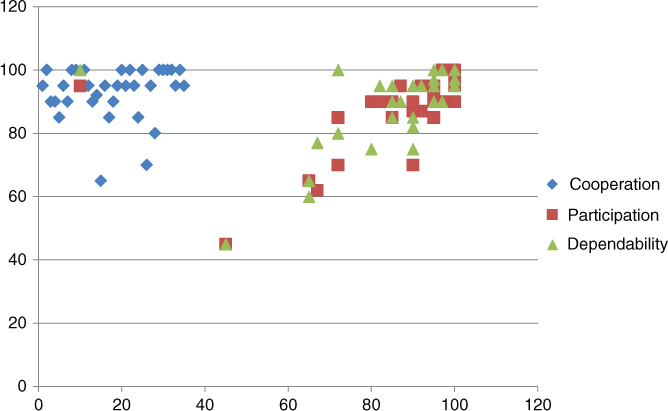
Figure 8.11 Individual's team involvements versus individual's contribution to the team.
Finally, we look into how individual's backgrounds impact one's online learning performance in the class and team settings. The course under exploration was Web Security. Therefore, we mainly explore how individual's knowledge of web servers and web programming and general experience in programming are related to one's class participation and final learning achievements. For this particular course, we found that individual's knowledge of web servers had a strong correlation to one's class participation and final learning achievements (Table 8.7). However, individual's experience in neither web programming nor general programming mattered. Amazingly, these findings are true in the whole class or within their team settings (Figures 8.12 and 8.13).
Table 8.7 Background Versus Performance and Participation in Team Activities
| User ID | Final Grade | Total Posts | Programming | Web Server | Web Programming | Participation |
| S201 | 89 | 16 | 5 | 5 | 6 | 90 |
| S202 | 92 | 16 | 7 | 7 | 6 | 97 |
| S203 | 84 | 21 | 1 | 2 | 1 | 90 |
| S204 | 97 | 74 | 5 | 5 | 6 | 87 |
| S205 | 89 | 14 | 5 | 1 | 5 | 70 |
| S206 | 94 | 28 | 4 | 3 | 3 | 90 |
| S207 | 98 | 47 | 1 | 4 | 1 | 95 |
| S208 | 91 | 16 | 7 | 6 | 6 | 92 |
| S209 | 94 | 16 | 2 | 1 | 1 | 95 |
| S210 | 92 | 17 | 4 | 1 | 2 | 95 |
| S211 | 94 | 46 | 2 | 6 | 4 | 85 |
| S212 | 86 | 15 | 5 | 6 | 1 | 95 |
| S213 | 90 | 21 | 1 | 1 | 1 | 87 |
| S214 | 91 | 32 | 1 | 7 | 4 | 90 |
| S215 | 82 | 18 | 4 | 1 | 4 | 45 |
| S216 | 96 | 51 | 1 | 2 | 1 | 90 |
| S217 | 87 | 27 | 5 | 4 | 2 | 70 |
| S218 | 90 | 17 | 1 | 1 | 5 | 90 |
| S219 | 98 | 31 | 4 | 1 | 1 | 95 |
| S220 | 93 | 16 | 5 | 3 | 6 | 100 |
| S221 | 76 | 15 | 1 | 1 | 1 | 62 |
| S222 | 92 | 18 | 1 | 1 | 7 | 95 |
| S223 | 93 | 19 | 7 | 3 | 7 | 90 |
| S224 | 87 | 13 | 1 | 1 | 1 | 85 |
| S225 | 96 | 23 | 6 | 7 | 7 | 100 |
| S226 | 78 | 18 | 6 | 2 | 4 | 65 |
| S227 | 90 | 57 | 6 | 4 | 4 | 65 |
| S228 | 96 | 33 | 6 | 6 | 4 | 95 |
| S229 | 98 | 52 | 6 | 1 | 1 | 95 |
| S230 | 99 | 63 | 3 | 1 | 1 | 85 |
| S231 | 93 | 16 | 7 | 7 | 6 | 100 |
| S232 | 100 | 83 | 5 | 7 | 4 | 100 |
| S233 | 92 | 36 | 2 | 6 | 1 | 90 |
| S234 | 89 | 15 | 1 | 1 | 2 | 90 |
| S235 | 98 | 39 | 1 | 7 | 2 | 95 |
| Correl (X, Final Grade) | 0.6 | 0.090512863 | 0.297 | 0.061591291 | 0.68140137 | |
| Correl (X, Team Participation) | 0.019446771 | 0.361 | 0.093930016 | |||
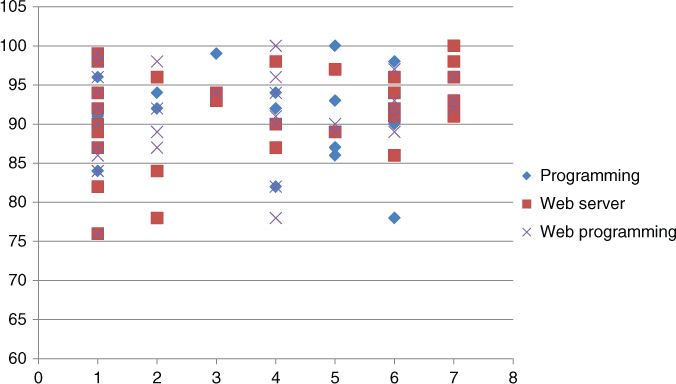
Figure 8.12 Background versus individual overall performance for the class.
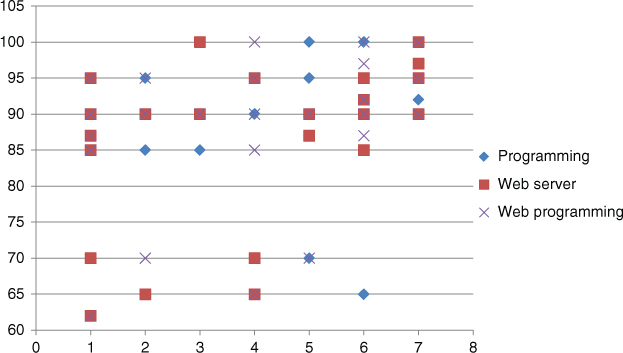
Figure 8.13 Background versus individual participations within teams.
In summary, we applied the “rules of thumb” identified in Semester I to Semester II's teaching/learning management and operations. Students seemed to be more active than those who took the same course in Semester I. More importantly, we found the following compelling facts in the second exploration:
- Students' learning outcomes are highly correlated with their active participations in class activities. Simply put, students' active interactions in a virtual setting play a critical role in helping them improve their learning outcomes.
- Individual's team experience and attitude are not well correlated to one's contribution to the quality of team work. However, one's active involvement positively impacts one's contribution to team work.
- Both individuals' dependability of finishing assignments and their active participations within teams are truly correlated to their contributions to the quality of team work.
- Individuals' certain education background and work experience could influence one's involvement in both the class and team settings.
8.4.2 Pedagogical Engagements and Learning Outcomes in the Network Perspective
Surely, instructors must take all the available means to get pedagogically engaged with students. Usually, sending out messages to guide students through each lesson and assignment is much appreciated by students. Students can feel the presence of instructors. Synchronous communications through live chats, virtual meetings, etc., help to improve the faculty–student pedagogical engagement. In collaborative learning, the frequent discussions among students play a critical role in improving learning outcomes. Therefore, we must explore students' interaction analytics, aimed at getting more insights of the interactive learning dynamics in both the class and team settings.
As an example, Table 8.8 shows online interactive activities throughout the course during the exploration in Semester II. When the interactive activities are depicted using NetDraw (Borgatti et al., (2002), we can find appealing results (Figure 8.14). Figure 8.14 illustrates interactive learning network based on individual's class activities, background, and performance. In Figure 8.14, we use darkness levels to represent the web server knowledge levels, the thickness to indicate the tie strength between students, and different shapes to tell their team assignments, and node size to provide individual's final grade information (i.e., individual's performance evaluated by the instructors).
A brief summary of identified insights of the learned network can be stated as follows: individuals who are active tend to receive better grades; individuals who have better general understandings of web servers tend to be more active; although individuals who have better knowledge of web servers tend to interact with each other, some students who have no good experience using web servers like to interact with those who have better knowledge of web servers would lead to improved learning outcomes.
From the previous observation, it might make sense to balance all the teams with an equivalent number of students who have good backgrounds in the field, which could ensure that the interactive dynamics within the teams and in the class are well balanced and retained. Let us check how the teams under study were formed in terms of their backgrounds. Table 8.9 shows the team distribution of individuals who has prior knowledge of web servers above the average in the class. Apparently, based on team formation information (Table 8.9), we observed that the team formation might have some unbalanced issues between teams in terms of the average of prior knowledge of web servers before they took the course. Therefore, to make the whole class achieve improved learning outcomes, we might have to have better ways to assign or form teams.
Table 8.8 Online Interactive Activities Throughout the Course
| S201 | S202 | S203 | S204 | S205 | S206 | S207 | S208 | S209 | S210 | S211 | S212 | S213 | S214 | S215 | S216 | S217 | ||
| S201 | 9 | 0 | 1 | 0 | 0 | 0 | 1 | 0 | 0 | 0 | 3 | 0 | 0 | 0 | 0 | 0 | 1 | |
| S202 | 0 | 7 | 0 | 2 | 0 | 0 | 2 | 2 | 0 | 0 | 0 | 1 | 0 | 0 | 0 | 1 | 2 | |
| S203 | 1 | 0 | 12 | 1 | 0 | 0 | 1 | 0 | 0 | 1 | 0 | 0 | 0 | 1 | 1 | 0 | 1 | |
| S204 | 0 | 2 | 1 | 19 | 0 | 2 | 7 | 0 | 0 | 0 | 5 | 1 | 1 | 2 | 1 | 10 | 0 | |
| S205 | 0 | 0 | 0 | 0 | 7 | 0 | 0 | 0 | 0 | 0 | 0 | 1 | 1 | 0 | 2 | 0 | 0 | |
| S206 | 0 | 0 | 0 | 2 | 0 | 10 | 5 | 0 | 0 | 0 | 2 | 1 | 0 | 2 | 0 | 4 | 0 | |
| S207 | 1 | 2 | 1 | 7 | 0 | 5 | 21 | 0 | 0 | 0 | 5 | 0 | 0 | 1 | 0 | 3 | 0 | |
| S208 | 0 | 2 | 0 | 0 | 0 | 0 | 0 | 8 | 0 | 0 | 0 | 0 | 0 | 0 | 1 | 0 | 0 | |
| S209 | 0 | 0 | 0 | 0 | 0 | 0 | 0 | 0 | 8 | 0 | 0 | 1 | 1 | 1 | 0 | 1 | 0 | |
| S210 | 0 | 0 | 1 | 0 | 0 | 0 | 0 | 0 | 0 | 10 | 0 | 0 | 1 | 0 | 0 | 1 | 0 | |
| S211 | 3 | 0 | 0 | 5 | 0 | 2 | 5 | 0 | 0 | 0 | 10 | 0 | 2 | 0 | 0 | 3 | 0 | |
| S212 | 0 | 1 | 0 | 1 | 1 | 1 | 0 | 0 | 1 | 0 | 0 | 9 | 0 | 0 | 0 | 1 | 0 | |
| S213 | 0 | 0 | 0 | 1 | 1 | 0 | 0 | 0 | 1 | 1 | 2 | 0 | 11 | 2 | 0 | 0 | 0 | |
| S214 | 0 | 0 | 1 | 2 | 0 | 2 | 1 | 0 | 1 | 0 | 0 | 0 | 2 | 14 | 1 | 3 | 1 | |
| S215 | 0 | 0 | 1 | 1 | 2 | 0 | 0 | 1 | 0 | 0 | 0 | 0 | 0 | 1 | 9 | 2 | 0 | |
| S216 | 0 | 1 | 0 | 10 | 0 | 4 | 3 | 0 | 1 | 1 | 3 | 1 | 0 | 3 | 2 | 19 | 0 | |
| S217 | 1 | 2 | 1 | 0 | 0 | 0 | 0 | 0 | 0 | 0 | 0 | 0 | 0 | 1 | 0 | 0 | 13 | |
| S218 | 1 | 0 | 0 | 0 | 0 | 0 | 0 | 1 | 5 | 0 | 0 | 1 | 0 | 0 | 1 | 1 | 0 | |
| S219 | 0 | 0 | 2 | 0 | 0 | 1 | 3 | 1 | 1 | 1 | 0 | 0 | 0 | 1 | 0 | 0 | 1 | |
| S220 | 0 | 0 | 0 | 4 | 0 | 1 | 2 | 0 | 0 | 0 | 0 | 0 | 0 | 1 | 0 | 1 | 3 | |
| S221 | 0 | 0 | 0 | 0 | 0 | 0 | 0 | 0 | 0 | 0 | 2 | 0 | 0 | 1 | 0 | 1 | 0 | |
| S222 | 1 | 0 | 1 | 2 | 1 | 0 | 2 | 2 | 2 | 0 | 2 | 0 | 0 | 1 | 0 | 0 | 0 | |
| S223 | 0 | 1 | 1 | 5 | 0 | 0 | 0 | 0 | 0 | 0 | 0 | 0 | 1 | 0 | 0 | 3 | 1 | |
| S224 | 0 | 1 | 2 | 0 | 0 | 0 | 0 | 0 | 0 | 0 | 0 | 0 | 0 | 0 | 0 | 1 | 2 | |
| S225 | 0 | 0 | 0 | 0 | 2 | 3 | 2 | 0 | 0 | 0 | 3 | 0 | 0 | 0 | 0 | 0 | 1 | |
| S226 | 1 | 0 | 0 | 0 | 0 | 1 | 2 | 1 | 1 | 1 | 1 | 0 | 1 | 1 | 0 | 0 | 0 | |
| S227 | 0 | 0 | 2 | 8 | 0 | 2 | 6 | 0 | 1 | 0 | 6 | 0 | 0 | 3 | 2 | 6 | 0 | |
| S228 | 0 | 1 | 0 | 6 | 0 | 5 | 3 | 1 | 0 | 0 | 0 | 0 | 2 | 1 | 0 | 2 | 3 | |
| S229 | 1 | 0 | 3 | 6 | 1 | 0 | 1 | 1 | 2 | 2 | 1 | 0 | 2 | 3 | 0 | 10 | 2 | |
| S230 | 0 | 0 | 0 | 9 | 0 | 7 | 11 | 0 | 1 | 0 | 6 | 2 | 1 | 5 | 2 | 4 | 0 | |
| S231 | 1 | 1 | 0 | 0 | 1 | 0 | 2 | 0 | 0 | 0 | 0 | 0 | 0 | 1 | 0 | 0 | 0 | |
| S232 | 1 | 10 | 0 | 19 | 1 | 3 | 3 | 0 | 2 | 3 | 6 | 0 | 3 | 6 | 3 | 6 | 1 | |
| S233 | 0 | 1 | 0 | 0 | 1 | 0 | 1 | 0 | 0 | 0 | 0 | 0 | 0 | 1 | 0 | 0 | 1 | |
| S234 | 0 | 0 | 1 | 1 | 0 | 0 | 2 | 1 | 0 | 0 | 2 | 1 | 0 | 0 | 0 | 0 | 1 | |
| S235 | 0 | 0 | 0 | 7 | 1 | 1 | 2 | 0 | 0 | 1 | 3 | 2 | 3 | 1 | 0 | 0 | 1 | |
| S218 | S219 | S220 | S221 | S222 | S223 | S224 | S225 | S226 | S227 | S228 | S229 | S230 | S231 | S232 | S233 | S234 | S235 | |
| S201 | 1 | 0 | 0 | 0 | 1 | 0 | 0 | 0 | 1 | 0 | 0 | 1 | 0 | 1 | 1 | 0 | 0 | 0 |
| S202 | 0 | 0 | 0 | 0 | 0 | 1 | 1 | 0 | 0 | 0 | 1 | 0 | 0 | 1 | 10 | 1 | 0 | 0 |
| S203 | 0 | 2 | 0 | 0 | 1 | 1 | 2 | 0 | 0 | 2 | 0 | 3 | 0 | 0 | 0 | 0 | 1 | 0 |
| S204 | 0 | 0 | 4 | 0 | 2 | 5 | 0 | 0 | 0 | 8 | 6 | 6 | 9 | 0 | 19 | 0 | 1 | 7 |
| S205 | 0 | 0 | 0 | 0 | 1 | 0 | 0 | 2 | 0 | 0 | 0 | 1 | 0 | 1 | 1 | 1 | 0 | 1 |
| S206 | 0 | 1 | 1 | 0 | 0 | 0 | 0 | 3 | 1 | 2 | 5 | 0 | 7 | 0 | 3 | 0 | 0 | 1 |
| S207 | 0 | 3 | 2 | 0 | 2 | 0 | 0 | 2 | 2 | 6 | 3 | 1 | 11 | 2 | 3 | 1 | 2 | 2 |
| S208 | 1 | 1 | 0 | 0 | 2 | 0 | 0 | 0 | 1 | 0 | 1 | 1 | 0 | 0 | 0 | 0 | 1 | 0 |
| S209 | 5 | 1 | 0 | 0 | 2 | 0 | 0 | 0 | 1 | 1 | 0 | 2 | 1 | 0 | 2 | 0 | 0 | 0 |
| S210 | 0 | 1 | 0 | 0 | 0 | 0 | 0 | 0 | 1 | 0 | 0 | 2 | 0 | 0 | 3 | 0 | 0 | 1 |
| S211 | 0 | 0 | 0 | 2 | 2 | 0 | 0 | 3 | 1 | 6 | 0 | 1 | 6 | 0 | 6 | 0 | 2 | 3 |
| S212 | 1 | 0 | 0 | 0 | 0 | 0 | 0 | 0 | 0 | 0 | 0 | 0 | 2 | 0 | 0 | 0 | 1 | 2 |
| S213 | 0 | 0 | 0 | 0 | 0 | 1 | 0 | 0 | 1 | 0 | 2 | 2 | 1 | 0 | 3 | 0 | 0 | 3 |
| S214 | 0 | 1 | 1 | 1 | 1 | 0 | 0 | 0 | 1 | 3 | 1 | 3 | 5 | 1 | 6 | 1 | 0 | 1 |
| S215 | 1 | 0 | 0 | 0 | 0 | 0 | 0 | 0 | 0 | 2 | 0 | 0 | 2 | 0 | 3 | 0 | 0 | 0 |
| S216 | 1 | 0 | 1 | 1 | 0 | 3 | 1 | 0 | 0 | 6 | 2 | 10 | 4 | 0 | 6 | 0 | 0 | 0 |
| S217 | 0 | 1 | 3 | 0 | 0 | 1 | 2 | 1 | 0 | 0 | 3 | 2 | 0 | 0 | 1 | 1 | 1 | 1 |
| S218 | 8 | 0 | 1 | 1 | 0 | 0 | 0 | 0 | 1 | 1 | 1 | 0 | 1 | 1 | 0 | 1 | 0 | 0 |
| S219 | 0 | 14 | 0 | 0 | 0 | 0 | 0 | 1 | 1 | 0 | 1 | 1 | 2 | 0 | 0 | 1 | 0 | 4 |
| S220 | 1 | 0 | 7 | 0 | 0 | 2 | 0 | 0 | 0 | 0 | 0 | 2 | 1 | 1 | 6 | 0 | 1 | 0 |
| S221 | 1 | 0 | 0 | 9 | 0 | 0 | 0 | 0 | 0 | 0 | 0 | 1 | 1 | 1 | 2 | 1 | 1 | 0 |
| S222 | 0 | 0 | 0 | 0 | 9 | 0 | 1 | 1 | 0 | 3 | 1 | 2 | 2 | 1 | 1 | 0 | 1 | 0 |
| S223 | 0 | 0 | 2 | 0 | 0 | 8 | 0 | 0 | 0 | 0 | 3 | 0 | 1 | 0 | 2 | 1 | 0 | 1 |
| S224 | 0 | 0 | 0 | 0 | 1 | 0 | 7 | 0 | 0 | 0 | 0 | 0 | 0 | 0 | 1 | 0 | 0 | 1 |
| S225 | 0 | 1 | 0 | 0 | 1 | 0 | 0 | 8 | 4 | 0 | 1 | 0 | 3 | 0 | 4 | 0 | 0 | 2 |
| S226 | 1 | 1 | 0 | 0 | 0 | 0 | 0 | 4 | 9 | 1 | 0 | 0 | 0 | 0 | 1 | 0 | 0 | 0 |
| S227 | 1 | 0 | 0 | 0 | 3 | 0 | 0 | 0 | 1 | 18 | 4 | 3 | 6 | 0 | 5 | 1 | 1 | 9 |
| S228 | 1 | 1 | 0 | 0 | 1 | 3 | 0 | 1 | 0 | 4 | 15 | 0 | 2 | 1 | 6 | 1 | 0 | 1 |
| S229 | 0 | 1 | 2 | 1 | 2 | 0 | 0 | 0 | 0 | 3 | 0 | 20 | 3 | 0 | 4 | 2 | 1 | 1 |
| S230 | 1 | 2 | 1 | 1 | 2 | 1 | 0 | 3 | 0 | 6 | 2 | 3 | 31 | 1 | 8 | 5 | 0 | 5 |
| S231 | 1 | 0 | 1 | 1 | 1 | 0 | 0 | 0 | 0 | 0 | 1 | 0 | 1 | 7 | 12 | 0 | 0 | 0 |
| S232 | 0 | 0 | 6 | 2 | 1 | 2 | 1 | 4 | 1 | 5 | 6 | 4 | 8 | 12 | 11 | 4 | 1 | 1 |
| S233 | 1 | 1 | 0 | 1 | 0 | 1 | 0 | 0 | 0 | 1 | 1 | 2 | 5 | 0 | 4 | 10 | 0 | 0 |
| S234 | 0 | 0 | 1 | 1 | 1 | 0 | 0 | 0 | 0 | 1 | 0 | 1 | 0 | 0 | 1 | 0 | 7 | 0 |
| S235 | 0 | 4 | 0 | 0 | 0 | 1 | 1 | 2 | 0 | 9 | 1 | 1 | 5 | 0 | 1 | 0 | 0 | 10 |
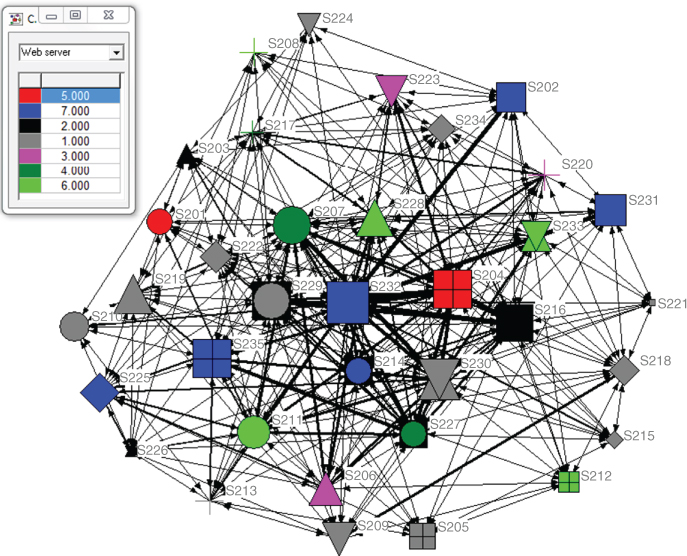
Figure 8.14 Interactive learning network: activities, background, and performance.
Table 8.9 Background and Team Information in the Studied Course During Semester II
| Level of Web Server Knowledge | Team 1 | Team 2 | Team 3 | Team 4 | Team 5 | Team 6 | Team 7 | Team 8 | Team 9 |
| 7 | S232, S202, S231 | S235 | S214 | ||||||
| 6 | S211 | S228 | S212 | S208 | S233 | ||||
| 5 | S201 | S204 |
In general, what could we do differently to make collaborative learning more effective? The above-discussed team formation issue can truly be one of the actionable items during the course offering process. Surely, we could ask ourselves a variety of similar or different questions under different circumstances. However, as each class is different, we must look into the specifics by focusing on actionable items to make effective and positive changes. Hence, it will be much more effective if we can take appropriate actions real time and from beginning to end than simply a few adjustments at the beginning of an offered course.
8.4.3 Guiding Individual's Participations in Real Time for Improved Learning Outcomes
From the discussions in Sections 8.4.1 and 8.4.2, we know that both data and networks analytics help us to understand the dynamics of learning networks. The formed learning networks vary with a variety of factors. More importantly, the networks evolve over time as these factors keep changing. Service Science should help service organizations design, execute, monitor, and improve their service systems. Scientific approaches thus are essential for providing guidance and control of their formed service networks and ensure that service networks evolve in such a way through the service lifecycle that optimal and sustainable service is always delivered to customers.
Let us revisit the exploratory example in Semester II. At the end of the previous section, we had one interesting observation. We articulate that we might have better ways to assign teams, which could lead to achieve better learning outcomes than what students actually accomplished in the course. As indicated in Table 8.9, we now know that both Teams 5 and 6 had no students who had good levels of understanding of web servers. We could change the way we assigned teams. For instance, we could make sure that each team would have at least one student who had at least level 5 of web server knowledge. By doing so, we know that the interactions within each team could be more dynamic and intensive as we know that one who has a better general understanding of web servers tends to be more active and interact with others. As a result, we might make collaborative learning in the course during Semester II more effective.
On the basis of the concept and principles of Service Science discussed in this book, we know that it will be much effective if we can take appropriate actions real time throughout the process of service transformation. For an online course like the one we just discussed, for example, we can divide the course—Web Security—into seven learning modules (Figure 8.15). To make sure that we will get sufficient information of students who are enrolled in the course, we let them individually fill in a preclass survey (which mainly collects individual education background and work experience related to the Web technologies), do online assignments and homework, and take part in online discussions within the class and teams. As indicated in Figure 8.15, based on data and network analytics, as shown in Sections 8.4.1 and 8.4.2, we will then assign teams by fully taking into consideration their backgrounds and behaviors in class before teams are officially assigned (Figures 8.16 and 8.17). Real-time guidance to individuals, teams, and the class will be provided as soon as a new module completes. The iteration of monitoring, analytical, and guiding process continues until the end of the course under exploration. Ultimately, the approach to promote and facilitate students' pedagogical engagement leads to improved collaborative learning in overall.
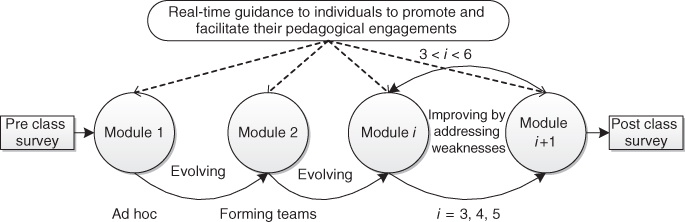
Figure 8.15 Interactive learning network: activities, background, and performance.
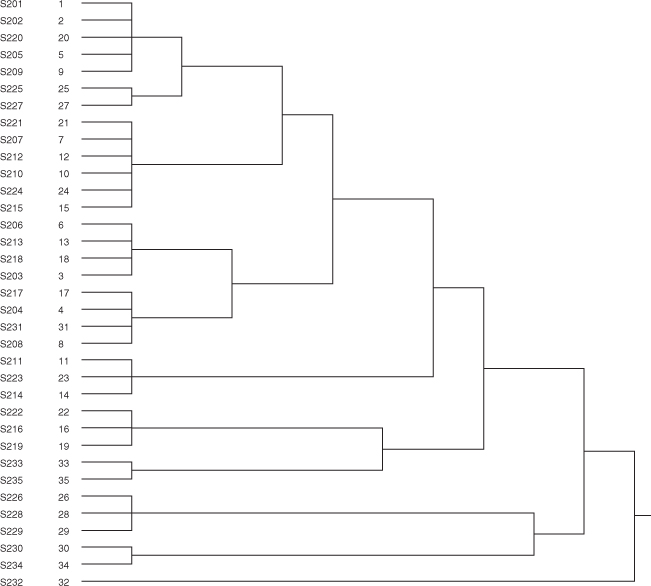
Figure 8.16 Class cluster diagram at the end of Module 2: activities and background.
8.4.4 Brief Remarks on Part II of Collaborative Learning Analytics
According to Hall (2013), one of the attractive assets of virtual courses is that they are quite more flexible in terms of working around learners' schedules. In a residential class on campus, students and instructors must meet at the same time in assigned classrooms or laboratories. While in an online class over the Internet, students are simply required to complete their assignments before they are due. Students can learn lectures and work on assignments at any time, avoiding conflicts with their work or home responsibilities. This is particularly true for adult learners. However, lacking physical interactions in a timely manner, students who are not self-disciplined might be left behind. Therefore, if collaborative learning is the focus in an offered virtual course, we must take account of numerous possible ways to change how the course is delivered, design what pedagogical engagements should be enabled, and adjust the learning materials and assignments if needed. Because of different mix of education backgrounds and work experience of a given class, instructors might also need different mechanisms to help and guide students throughout their learning processes, individually or collectively.
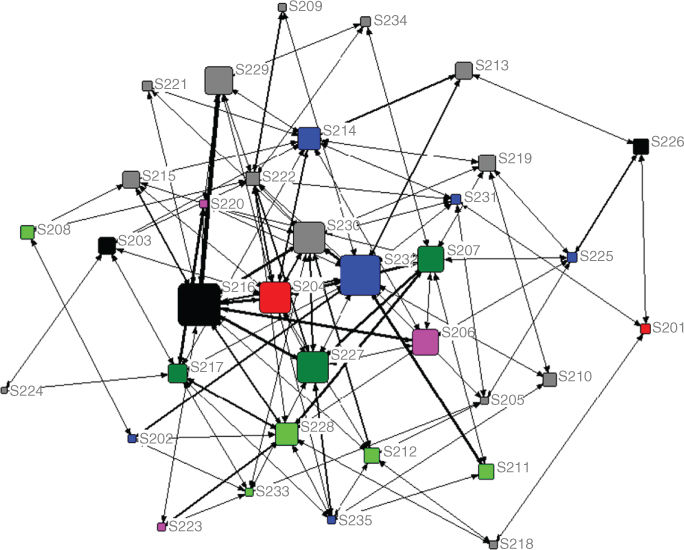
Figure 8.17 Interactive learning network at the end of Module 2: activities, background, and quality of work (the meanings of symbols and labels are similar to those used in Figure 8.14).
Surely, there are many more challenges in either an online or a brick-and-mortar school. In this section, we used an example to show how we can address certain issues in collaborative learning. Indeed, this section surely provides much more insights into the students' pedagogical engagements in an online Web Security class than those in Part I of collaborative learning analytics we conducted in Section 8.3. We could clearly see how individuals behave and how their behaviors in both the class and team settings evolve. In particular, we concluded that an instructor could provide real-time guidance to individuals, teams, and the class if the monitoring, analytical, and guiding process is equipped with transformative mechanisms for the class that is well constructed and deployed appropriately. As a result, schools can design, develop, and deliver competitive online education services as promised and desired.
8.5 The Significance of This Illustrated Case Study
Indeed, pedagogies of engagement in residential education have been studied for decades as discussed earlier. Many researchers have focused on three of the main principles, namely, that good practice encourages student–faculty interaction, cooperation among students, and active learning. The interaction among students and between faculty and students are the two learning practice factors best predictive of a positive change in students' academic development, personal development, and satisfaction (Astin, (1997); NSSE, (2003); Smith et al., (2005). However, online education misses typical while strict class/assignment schedules and in-person interactions that are taken for granted on campus, resulting in unprecedented challenges, such as how to cultivate and nourish students' self-motivation and which approach to be applied to encouraging social interaction and collaborative learning.
There has been little scientific research work to address the challenges in a scientific and comprehensive manner. Therefore, the significance of this case study will be the groundbreaking development of a framework to provide an integrative and quantitative process that helps professors and students adjust and enhance the teaching/learning practices and facilitate the students' development in an online educational environment (i.e., online degree programs, training modules, and MOOC courses) by generating pleasant and positive interactions.
Indeed, the adopted framework could provide a new, innovative, and scientific avenue for addressing a variety of other online education challenges (Burnsed, (2011). For example, by relying on the developed approaches, the quality of online education from any service provider can be fully studied. The computing and network technology has transformed the way we teach and learn. Blended learning—a combination of online and in-class instruction—has been found to be a more effective teaching method in many leading universities (Ripley, 2012). Thus, the framework and related models/tools that have being developed have the promise of helping to enrich residential education programs, to train instructors to develop and teach online courses, and introduce a new pedagogy for online or blended learning (Burnsed, (2011).
8.6 Conclusions
Like it or not, nearly all colleges and universities in the United States are now offering some online or distance learning courses. One benefit for residential students will be that students could leverage the best components of both brick-and-mortar and online curricula (Hall, (2013). Therefore, one potential and promising use of MOOC is to help brick-and-mortar schools improve their ongoing residential education by incorporating the useful insights from online courses. Moreover, with the help of big data technologies, schools can surely get a better understanding of the ever-changing education market (Ahlquist and Saagar, (2013) and how generation Y prefers to be pedagogically engaged in this new millennium.
Using a specific online course delivery example, this chapter showed how a service system can be analyzed beyond the SEM-based causality and performance model. A network perspective truly becomes critical for us to understand the dynamics of a people-centric service network that essentially consists of extremely dynamic, complex, and interwoven service encounters.
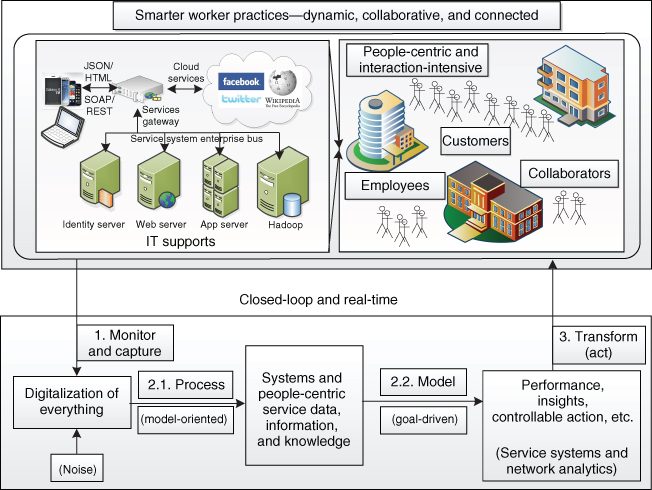
Figure 8.18 Engineering and managing a service system in real time for competitive advantage.
Broadly speaking, for a service system, small or large, simple or complex, it has different business goals and objectives. At a given time and location, the resources available to engineer and manage services that are offered and delivered by the service system can be limited, technologically, financially, socially, or even politically. A viable approach to address the challenges that are confronted by the service system as a whole could vary with circumstances. In other words, because the mix of 8 Ps varies, so does its corresponding solution to ensure the success of service provision.
Simply put, we could rely on the fast advances in technologies to collect the necessary measurements of a service system that could help describe the true dynamic behaviors of the service system (Figure 8.18). By capturing the insights of the service system in real time, the presented approach can surely provide effective data, network, and business analytics in support of ongoing service engineering and management throughout the service lifecycle across all internal business domains in the service system and external collaborators across the service delivery networks. Ultimately, all stakeholders (e.g., customers, employees, and collaborators) can make informed decisions and take prompt and optimal actions in cocreating and keeping the offered and delivered services attractive, competitive, and satisfactory.
References
- Ahlquist, J., & Saagar, K. (2013). Comprehending the complete customer. Analytics—INFORMS Analytics Magazine, May/June, 36–50.
- Andriessen, J., & Verburg, R. (2004). A Model for the Analysis of Virtual Teams. Chapter XV in Virtual and Collaborative Teams: Process, Technologies and Practice, ed. by S. Godar and S. Ferris. Hershey, PA: Idea Group Inc.
- Antonis, K., Daradoumis, T., Papadakis, S., & Simos, C. (2011). Evaluation of the effectiveness of a web-based learning design for adult computer science courses. IEEE Transaction on Education, 54(3), 374–380.
- Astin, A. (1997). What Matters in College? Four Critical Years Revisited. San Francisco, CA: Jossey-Bass.
- Baker, M. J., & Lund, K. (1997). Promoting reflective interactions in a computer-supported collaborative learning environment. Journal of Computer Assisted Learning, 13, 175–193.
- Beldarrain, Y. (2006). Distance education trends: integrating new technologies to foster student interaction and collaboration. Distance Education, 27(2), 139–153.
- Borgatti, S., Everett, M., & Freeman, L. (2002). UCINET for Windows: Software for Social Network Analysis. Harvard, MA: Analytic Technologies.
- Burnsed, B. (2011). Online education may transform higher ed. US News and Report. Retrieved on Oct. 10, 2012 from http://www.usnews.com.
- Carley, K., & Lin, Z. (1997). A theoretical study of organizational performance under information distortion. Management Science, 43(7), 976–997.
- Chea, T. (2012). Elite colleges transform online higher education. Associated Press. Retrieved on Oct. 10, 2012 from http://people.uis.edu/rschr1/et/?p=5070.
- Cheng, Y. (2005). New Paradigm for Re-engineering Education, Globalization, Localization and Individualization. The Netherlands: Springer.
- Chin, W., Marcolin, B., & Newsted, P. (2003). A partial least squares latent variable modeling approach for measuring interaction effects: result from a Monte Carlo simulation study and an electronic-mail emotion/adoption study. Information Systems Research, 14(2), 189–217.
- Coursera. (2013). Coursera. Retrieved on Mar. 5, 2013 from https://www.coursera.org.
- Department of Education. (2008). Evaluating Online Learning: Challenges and Strategies for Success. Retrieved on Mar. 5 2013 from http://www2.ed.gov/admins/lead/academic/evalonline/evalonline.pdf.
- Dillenbourg, P. (1999). Collaborative-Learning: Cognitive and Computational Approaches. Oxford: Elsevier.
- Djenic, S., Krneta, R., & J. Mitic, (2011). Blended learning of programming in the Internet age. IEEE Transaction on Education, 54(2), 247–254.
- Duerr, M., Zajonc, A., & Dana, D. (2003). Survey of transformative and spiritual dimensions of higher education. Journal of Transformative Education, 1(3), 177–211.
- Dymalski, S. (2011). How to overcome the top 5 online education challenges. Career Advice at ClassesandCareers.com. Retrieved on Mar. 5, 2013 from http://www.classesandcareers.com/.
- Ebrahim, N., Ahmed, S., & Taha, Z. (2009). Innovation and R&D activities in virtual team. European Journal of Scientific Research, 34(3), 297–307.
- edX. (2012). edX. Retrieved on May 2, 2012 from https://www.edx.org/.
- Fincher, M. (2010). Adult student retention: a practical approach to retention improvement through learning enhancement. The Journal of Continuing Higher Education, 58(1), 12–18.
- Garrison, R. (2000). Theoretical challenges for distance education in the 21st century: a shift from structural to transactional issues. International Review of Research in Open and Distance Learning, 1(1), 1–17.
- Garrison, D., & Kanuka, H. (2004). Blended learning: uncovering its transformative potential in her education. The Internet and Higher Education, 7, 95–105.
- GHFP. (2006). A vision for transformative education. The 3rd Vittachi Conference “Rethinking Educational Changes”, Retrieved on Oct. 10, 2009 from http://www.transformedu.org/Home/tabid/158/language/en-US/Default.aspx.
- Gokhale., A. (1995). Collaborative learning enhances critical thinking. Journal of Technology Education, 7(1), 22–30.
- Goodwin, G., Medioli, A., Sher, W., Vlacic, L., & Welsh, J. (2011). Emulation-based virtual laboratories: a low-cost alternative to physical experiments in control engineering education. IEEE Transaction on Education, 54(1), 48–55.
- Hall, P. (2013). Brick & mortar vs. virtual school. eHow. Retrieved on Mar. 5, 2013 from http://www.ehow.com/info_8690282_brick-mortar-vs-virtual-school.html.
- Hansen, R. (2006). Benefits and problems with student teams: suggestions for improving team projects. Journal of Education for Business, 82(1), 11–19.
- Illeris, K. (2004). Transformative learning in the perspective of a comprehensive learning theory. Journal of Transformative Education, 2(2), 79–89.
- Imel, S. (1991). Collaborative learning in adult education. ERIC Clearing on Adult Career and Vocation Education, Columbus, OH, ERIC Digest No. 113.
- Jin, Y., & Levitt, R. (1996). The virtual design team: a computational model of project organizations. Computational & Mathematical Organization Theory, 2(3), 171–196.
- Larson, R. C. (2009). Editorial Column-Education: Our Most Important Service Sector. Service Science, 1(4), i–iii.
- Levitt, R., Thomsen, J., Chritiansen, T., Junz, J., Jin, Y., & Nass, C. (1999). Simulating project work processes and organizations: towards a micro-contingency theory of organizational design. Management Science, 45(11), 1479–1495.
- Lurey, J., & Raisinghani, M. (2001). An empirical study of best practices in virtual teams. Information and Management, 38, 523–544.
- Marks, R., Sibley, S., & Arbaugh, J. (2005). A structural equation model of predictors for effective online learning. Journal of Management Education, 29(4), 531–563.
- Mayo, P. (2003). A rational for a transformative approach to education. Journal of Transformative Education, 1(1), 38–57.
- Moore, J. (2005). Is higher education ready for transformative learning? A question explored in the study of sustainability. Journal of Transformative Education, 3(1), 76–91.
- NAP. (2009). Developing Metrics for Assessing Engineering Instruction: What Gets Measured is What Gets Improved. Washington, DC: The National Academies Press.
- NSB. (2007). Moving Forward to Improve Engineering Education. National Science Board and Workshops at NSF. Retrieved from May 10, 2011 from http://ww.nsf.gov/pubs/2007/nsb07122/nsb07122.pdf.
- NSSE. (2003). National Survey of Student Engagement: The College Student Report—2003 Annual Report. Bloomington, IN: Center for Postsecondary Research, Indiana University.
- Orange, A., Heineche, W., Berger, E., Krousgrill, C., Mikic, B., & Quinn, D. (2012). An evaluation of HigherEd 2.0 technologies in undergraduate mechanical engineering courses. Advances in Engineering Education, 3(1), 1–29.
- O'Sullivan, E. (1999). Transformative Learning: Educational Vision for the 21st Century. Toronto, Canada: University of Toronto Press.
- Parry, M. (2012). 5 ways that edX could change education. The Chronicle of Higher Education. Retrieved on Mar. 5, 2013 from http://chronicle.com/article/5-Ways-That-edX-Could-Change/134672/.
- Pauleen, D. (2004). Virtual Teams: Projects, Protocols and Processes. Idea Group Publishing, Hershey, PA.
- Qiu, R. G. (2009). Computational thinking of service systems: dynamics and adaptiveness modeling. Service Science, 1(1), 42–55.
- Qiu, R. G. (2010). A collaborative model of engineering education for complex global environments. The 40th ASEE/IEEE Frontiers in Education Conference, Washington, DC, S3J1-S3J5.
- Qiu, R., Wu, Z., Wang, D., & Yu, Y. (2011). Tractable approximation approach to improving hotel service quality. Journal of Service Science Research, 3(1), 1–20.
- Ripley, A. (2012). College is dead. Long live college. Time Magazine, 180(18), 33–41.
- Selim, H. (2007). Critical success factors for e-learning acceptance: confirmatory factor models. Computers and Education, 49, 396–413.
- Shachaf, P., & Hara, N. (2005). Team effectiveness in virtual environments: an ecological approach. Teaching and Learning with Virtual Teams, 83–108 (Eds. P. Ferris and S. Godar). Idea Group Publishing, Hershey, PA.
- Smith, H., & Smarkusky, D. (2005). Competency matrices for peer assessment of individuals in team projects. Proceedings of the 6th Conference on Information Technology Education, 115–162.
- Smith, K., Sheppard, S., Johnson, D., & Johnson, R. (2005). Pedagogies of engagement: classroom-based practices. Journal of Engineering Education, 94(1), 87–102.
- SNA. (2011). Social Network Analysis. Retrieved on May 10, 2011 from http://en.wikipedia.org/wiki/Social_network#Social_network_analysis.
- Thompson, A., Perry, J., & Miller, T. (2009). Conceptualizing and measuring collaboration. Journal of Public Administration Research and Theory, 19(1), 23–56.
- Thoms, B. (2011). A dynamic social feedback system to support learning and social interaction in higher education. IEEE Transactions on Learning Technologies, 4(4), 340–352.
- Thomsen, J., Levitt, R. E., & Nass, C. I. (2005). The virtual team alliance (VTA): Extending Galbraith's information-processing model to account for goal incongruency. Computational & Mathematical Organization Theory, 10(4), 349–372.
- Tryggvason, G., & Apelian, D. (2006). Re-engineering engineering education for the challenges of the 21st century. JOM Journal of the Minerals, Metals and Materials Society, 37, 14–17.
- Vickery, C., Clark, T., & Carlson, J. (1999). Virtual positions: an examination of structure and performance in ad hoc workgroups. Information Systems Journal, 9, 291–312.
- Wong, S., & Burton, R. (2000). Virtual teams: what are the characteristics, and impact on team performance? Computational & Mathematical Organization Theory, 6, 339–360.
- Wyatt, L. (2011). Nontraditional student engagement: increasing adult student success and retention. The Journal of Continuing Higher Education, 59(1), 10–20.