Chapter 14
Copying Existing Drawings from Other Sources
This chapter discusses ways to import existing drawings into the AutoCAD® 2014 software through tracing, scaling, and scanning. At times, you’ll want to turn an existing drawing into an AutoCAD drawing file. The original drawing may be hand drawn, or it might be a PDF from another source. You may be modifying a design that someone else created or converting your library of older, hand-drafted drawings for AutoCAD use. Perhaps you want to convert a hand-drawn sketch into a formal drawing? In addition to importing drawings, you’ll learn how to incorporate drawings in Portable Document Format (PDF) into your AutoCAD work.
In this chapter, you will learn to:
- Convert paper drawings into AutoCAD files
- Import a raster image
- Work with a raster image
- Work with PDF files
- Use a geolocation map
Methods for Converting Paper Drawings to AutoCAD Files
Tracing with a special piece of hardware known as a digitizing tablet used to be the only way to enter a hand-drafted drawing into AutoCAD. However, a traced drawing usually requires some cleanup and reorganization.
Scaling a drawing is the most flexible method because you don’t need special peripherals to do it and, generally, you’re faced with fewer cleanups afterward. Scaling also facilitates the most accurate input of orthogonal lines because you can read dimensions directly from the drawing and enter them into AutoCAD. The main drawback with scaling is that if the hand-drafted drawing does not contain written dimensions, it would be difficult to produce an accurate copy. In addition, you must constantly look at the hand-drafted drawing and measure distances with a scale, and irregular curves are difficult to scale accurately.
Programs are available that automatically convert an image file into an AutoCAD drawing file consisting of lines and arcs. These programs may offer some help, but they require some editing and checking for errors.
Scanning, much like tracing, is best used for drawings that are difficult to scale, such as complex topographical maps containing a large number of contours or nontechnical line art, such as letterhead and logos.
The simplest method for converting paper drawings, and the method we show you in this chapter, is to scan your drawings as image files to be used as a background in AutoCAD. You can import your image files into AutoCAD and then trace directly over them. This technique allows you to see the original drawing in the AutoCAD window, removing the need to constantly refer to documents in other programs.
Importing a Raster Image
If you have a scanner and you’d like to use it to import drawings and other images into AutoCAD, you can take advantage of the program’s ability to import raster images. There are many reasons you may want to import a scanned image. In architectural plans, a vicinity map is frequently used to show the location of a project. With the permission of its creator, you can scan a map into AutoCAD and incorporate it into a cover sheet. That cover sheet can also contain other images, such as photographs of the site, computer renderings and elevations of the project, and company logos. In architectural projects, scans of older drawings can be used as backgrounds for renovation work. This can be especially useful for historical buildings where the building’s owner wishes to keep the original architectural detail.
Another reason for importing a scanned image is to use the image as a reference over which to trace. You can trace a drawing with a good deal of accuracy by using a scanned image. Now that the price of a scanner has fallen below $100, it has become a cost-effective tool for tracing a wide variety of graphic material. In this section, you’ll learn how you can import an image as a background for tracing.
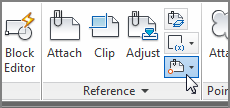
Click the External References tool on the Insert tab’s Reference panel (see Figure 14-1) to open the External References palette, which lets you import a full range of raster image files.
Figure 14-1 The External References palette allows you to import raster images.
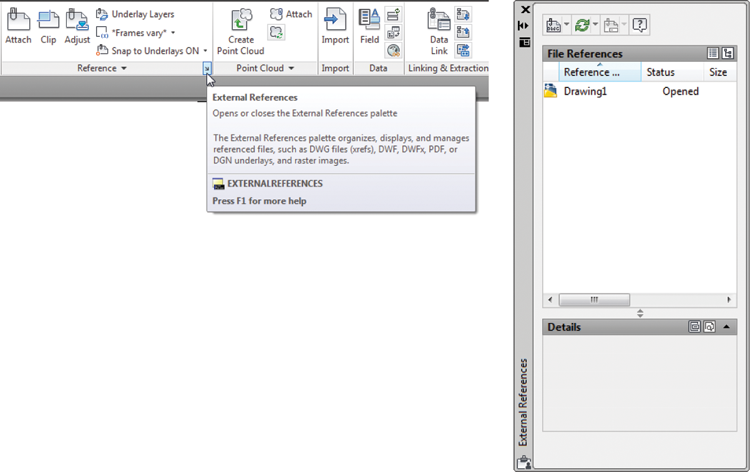
You can also type XR↵. This palette should look familiar from Chapter 7, “Mastering Viewing Tools, Hatches, and External References.” It’s the same palette you used to manage external references. Just like external references (Xrefs), raster images are loaded when the current file is open but they aren’t stored as part of the current file when it is saved. This helps keep file sizes down, but it also means that you need to keep track of inserted raster files. You must make sure they’re kept together with the AutoCAD files in which they’re inserted. For example, you might want to keep image files in the same folder as the drawing file to which they’re attached.
AutoCAD has a utility called eTransmit that collects AutoCAD files and their related support files, such as raster images, external references, and fonts, into any folder or drive you specify. See Chapter 27, “Managing and Sharing Your Drawings,” for details.
Another similarity between Xrefs and imported raster images is that you can clip a raster image so that only a portion of the image is displayed in your drawing. Portions of a raster file that are clipped aren’t stored in memory, so your system won’t get bogged down even if the raster file is huge.
The following exercise gives you step-by-step instructions for importing a raster file. It also lets you see how scanned resolution translates into an image in AutoCAD. This is important if you’re interested in scanning drawings for the purpose of tracing over them. Here are the steps:
Figure 14-2 The Attach Image dialog box
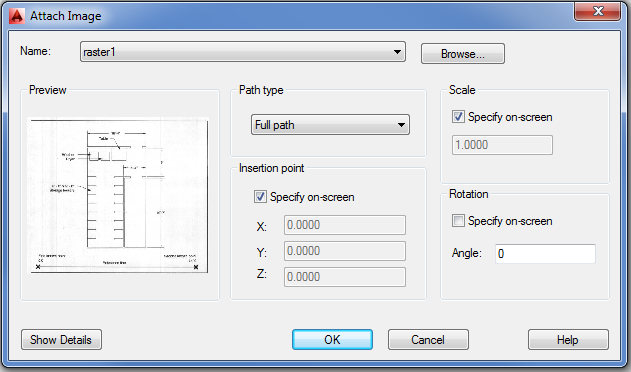
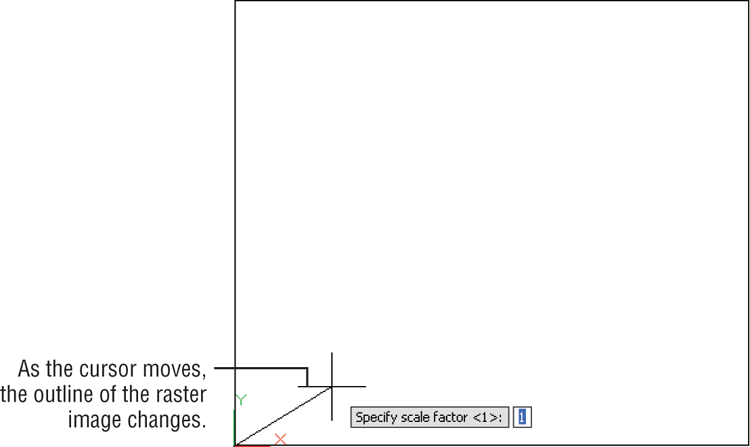
Figure 14-3 Manually scaling the raster image
Working with a Raster Image
Once you’ve imported a raster image, you can begin to work with it in a variety of ways. You can resize the image to suit your needs and even adjust its size to a particular scale. Raster images can be made to overlap AutoCAD objects, or you can have raster images appear in the background. There are also rudimentary controls for brightness, contrast, and transparency. In the following sections, you’ll continue to use the image you attached to your drawing to explore some of these options.
- Scan in your drawing using a grayscale or color scanner, or convert your black-and-white scanned image to grayscale using your image-editing software. This will give you more control over the appearance of the image once it’s in AutoCAD.
- Use an image-editing program, such as Adobe Photoshop or your scanner software, to clean up unwanted gray or spotted areas in the file before importing it into AutoCAD.
- If your scanner software or image-editing program has a “de-speckle” or “de-spot” feature, use it. It can help clean up your image and ultimately reduce the raster image’s file size.
- Scan at a reasonable resolution. Scanning at 150 dpi to 200 dpi may be more than adequate.
- If you plan to make heavy use of raster imports, upgrade your computer to the fastest processor and install as much memory as you can afford.
Scaling a Raster Image
The raster1.jpg file was scanned as a grayscale image at 100 dpi. This shows that you can get a reasonable amount of detail at a fairly low scan resolution.
Now suppose you want to trace over this image to start an AutoCAD drawing. The first thing you should do is scale the image to the appropriate size. You can scale an image file to full size. Try the following steps to see how you can begin the process:
The image is now scaled properly for the plan it portrays. You can proceed to trace over the image. You can also place the image on its own layer and turn it off from time to time to check your trace work. Even if you don’t trace the scanned floor plan line for line, you can read the dimensions of the plan from your computer monitor instead of having to go back and forth between measuring the paper image and drawing the plan on the computer.
Controlling Object Visibility and Overlap with Raster Images
With the introduction of raster image support, AutoCAD inherited a problem that’s fairly common to programs that use such images: Raster images obscure other objects that were placed previously. The image you imported in the previous exercise, for example, obscures the line you drew when you first opened the file. In most cases, this overlap isn’t a problem. However, in some situations, you’ll want AutoCAD vector objects to overlap an imported raster image. An example is a civil-engineering drawing showing an AutoCAD drawing of a new road superimposed over an aerial view of the location for the road.
Paint and page-layout programs usually offer a “to front/to back” tool to control the overlap of objects and images. AutoCAD offers the Draworder command. Here’s how it works:
The drawing regenerates, and the entire line appears, no longer obscured by the raster image.
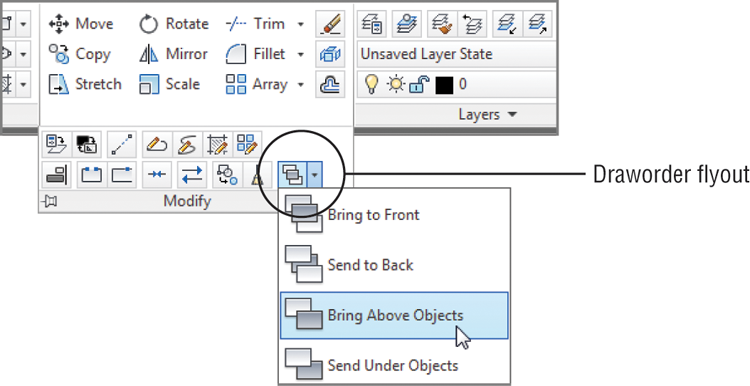
The Draworder tool you just used has seven options in the Draworder flyout on the Home tab’s Modify panel:
You can also use the DR keyboard shortcut to issue the Draworder command. If you do this, you see these prompts:
Select objects:
Enter object ordering option [Above objects/Under objects/Front/Back]<Back>:
You must then select the option by typing the capitalized letter of the option.
Although this section discussed the Draworder tools in relation to raster images, they can also be invaluable in controlling visibility of line work in conjunction with hatch patterns and solid fills. See Chapter 7 for a detailed discussion of the Draworder tools and hatch patterns.
Clipping a Raster Image
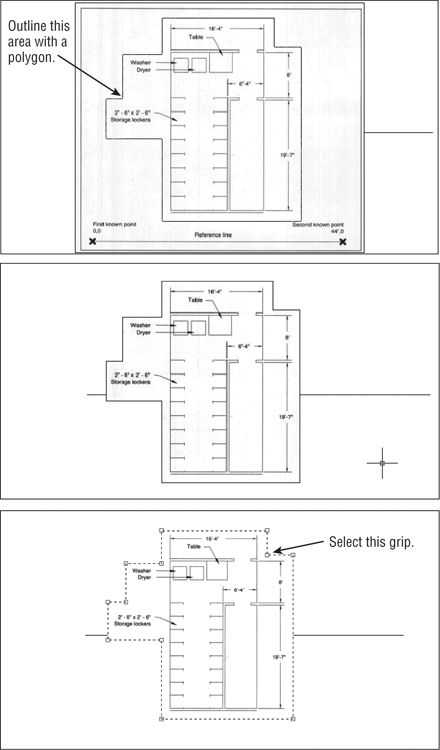
In Chapter 7, you saw how you could clip an external-reference object so that only a portion of it appears in the drawing. You can clip imported raster images in the same way. Just as with Xrefs, you can create a closed outline of the area you want to clip, or you can specify a simple rectangular area.
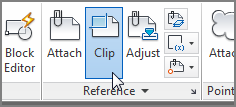
In the following exercise, you’ll try the Clip command to control the display of the raster image:
As the prompt in step 3 indicates, you can turn the clipping off or on, or you can delete an existing clipping boundary through the Clip Image option.
After you clip a raster image, you can adjust the clipping boundary by using its grips:
In addition to hiding portions of a raster image that are unimportant to you, clipping an image file reduces the amount of RAM the raster image uses during your editing session. AutoCAD loads only the visible portion of the image into RAM and ignores the rest.
Figure 14-4 Adjusting the boundary of a clipped image
Adjusting Brightness, Contrast, and Fade
AutoCAD offers a tool that enables you to adjust the brightness, contrast, and fade of a raster image. Try making some adjustments to the raster image of the utility room in the following exercise:
Figure 14-5 The Image tab appears when you select a raster image.
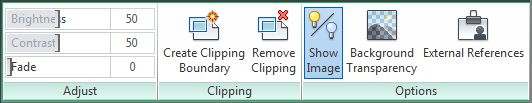
You can adjust the brightness and contrast by using the other two sliders in the Adjust panel of the Image tab.
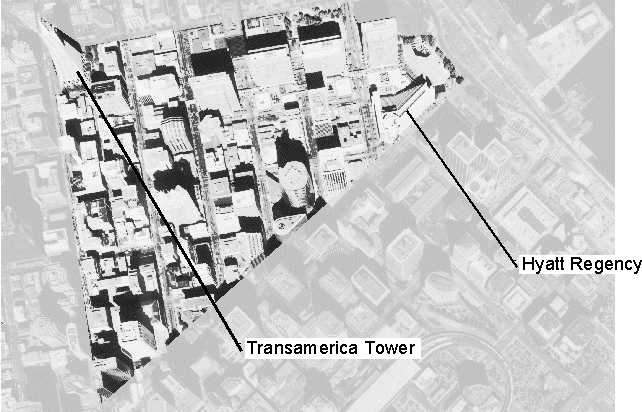
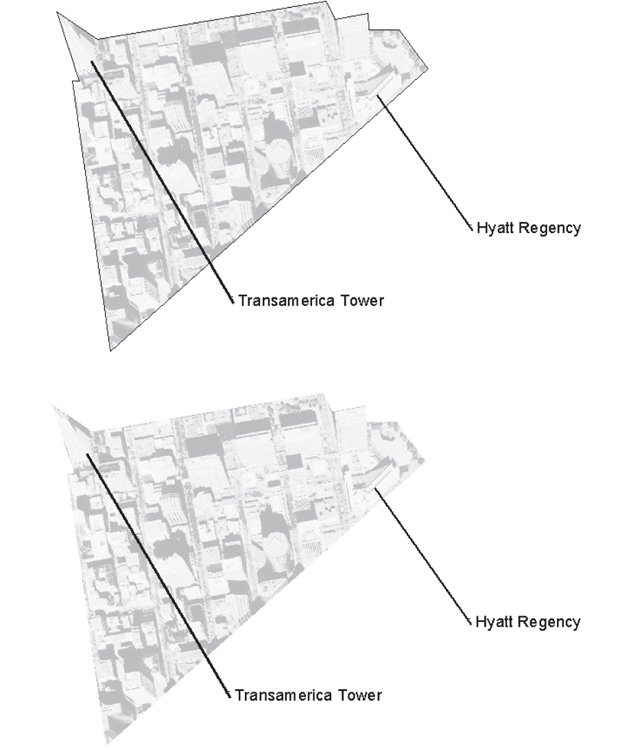
By using the Image tab in conjunction with image clipping, you can create special effects. Figure 14-6 shows an aerial view of downtown San Francisco with labels. This view consists of two copies of the same raster image. One copy serves as a background, which was lightened using the method demonstrated in the previous exercise. The second copy is the darker area of the image with a roughly triangular clip boundary applied. You might use this technique to bring focus to a particular area of a drawing you’re preparing for a presentation.
Figure 14-6 Two copies of the same image can be combined to emphasize a portion of the drawing.
If the draw order of objects is incorrect after you open a file or perform a Pan or Zoom, issue a Regen to recover the correct draw-order view.
In addition to the tools in the Adjust panel, there are several tools in the Image tab that can be used to modify raster images. Table 14-1 gives you a rundown of their function.
Table 14-1: The tools on the Image tab
| Tool | Function |
| Brightness | Adjusts the brightness of an image. |
| Contrast | Adjusts the contrast of an image. |
| Fade | Adjusts the fade value of an image. |
| Create Clipping Boundary | Allows you to create a clipping boundary. This tools works just like the Clip tool. |
| Remove Clipping | Removes a clipping boundary. |
| Show Image | Toggles an image on and off. |
| Background Transparency | Toggles the transparency of an image on and off. |
| External References | Opens the External References palette. |
Turning Off the Frame, Adjusting Overall Quality, and Controlling Transparency
You can make three other adjustments to your raster image: frame visibility, image quality, and image transparency.
By default, a raster image displays an outline, or a frame. In many instances, this frame can detract from your drawing. You can turn off image frames globally by typing Imageframe↵0↵. This sets the Imageframe setting to 0, which turns off the frame visibility. If it’s set to 1, the frame is made visible. You can also set it to 2, which leaves the frame visible but doesn’t plot it (see Figure 14-7).
Frames can also be controlled through the Frame flyout on the Insert tab’s Reference panel. If you turn off a raster image’s frame, you can’t click the image to select it for editing, though you can still select an image using the All, Previous, or Last selection option (see Chapter 2, “Creating Your First Drawing,” for more on selection options). To make a raster image selectable with your mouse, turn on the image frame using the Display And Plot Frames or the Display But Don’t Plot Frames option.
Figure 14-7 A raster image with the frame on (top) and off (bottom)
If your drawing doesn’t require the highest-quality image, you can set the image quality to Draft mode. You may use Draft mode when you’re tracing an image or when the image is already of a high quality. To set the image quality, enter Imagequality↵ and then enter H for High mode (high quality) or D for Draft mode. In Draft mode, your drawing will regenerate faster.
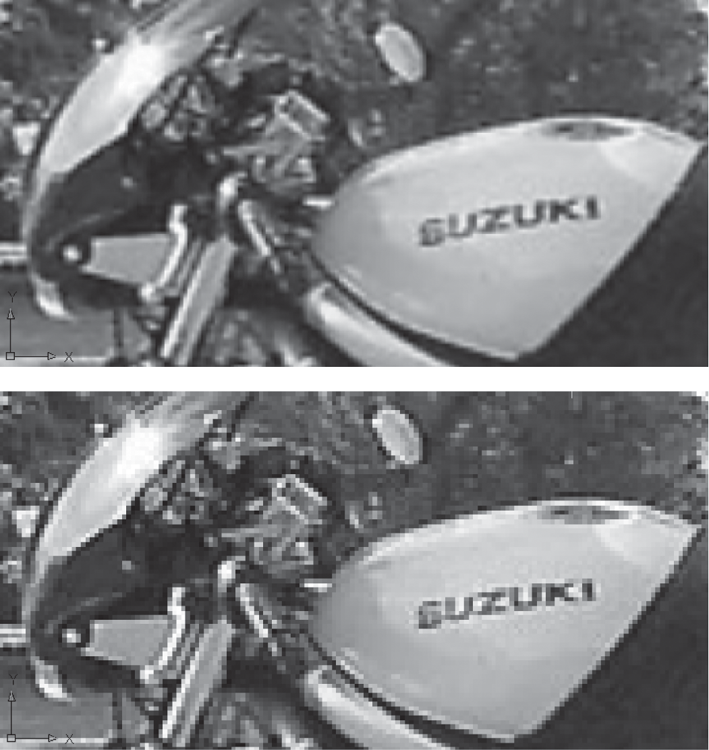
High mode softens the pixels of the raster image, giving the image a smoother appearance. Draft mode displays the image in a raw, pixilated state. If you look carefully at the regions between the motorcycle and the background in the second image in Figure 14-8, you’ll see that the edges of the motorcycle appear a bit jagged. The top image in Figure 14-8 uses the High setting to soften the edges of the motorcycle. You may need to look closely to see the difference.
Finally, you can control the transparency of raster image files that allow transparent pixels. Some file formats, such as GIF (Global Interchange Format), enable you to set a color in the image to be transparent (usually the background color). Most image-editing programs support this format because it’s a popular one used on web pages.
When you turn on the Transparency setting, objects normally obscured by the background of a raster image may show through. Select the raster image and then, in the Image tab’s Options panel, select Background Transparency. You can also right-click and select Image ⇒ Transparency, then select On or Off from the Dynamic Input menu. In addition, you can enter Transparency↵ and then select the raster image you want to make transparent. Press ↵, and then enter On or Off, depending on whether you want the image to be transparent. Unlike the Frame and Quality options, Transparency works on individual objects rather than operating globally.
Figure 14-8 A close-up of a raster image with quality set to High (top) and Draft (bottom)
The Properties palette offers many of the same adjustments described in this section. You can use it for quick access to the Transparency setting and other raster image settings.
Working with PDF Files
If you’re using a computer as part of your daily work activity, you will encounter a PDF document. PDFs have become a part of everyday life, so it’s no surprise that AutoCAD offers a fair amount of support for PDFs.
In the following sections, you’ll learn how to import a PDF document into AutoCAD and how you can control various properties of the document, such as fading and the ability to snap to objects in the PDF.
Importing a PDF
To import a PDF, you use a method similar to the one you used earlier to import an image file. In fact, you could perform all of the steps in the exercise in the section “Importing a Raster Image” earlier in this chapter using a PDF file instead of the raster1.jpg file. You just need to know how to set up the Select Reference File dialog box to allow you to locate PDFs.
Try the following to see how to import a PDF:
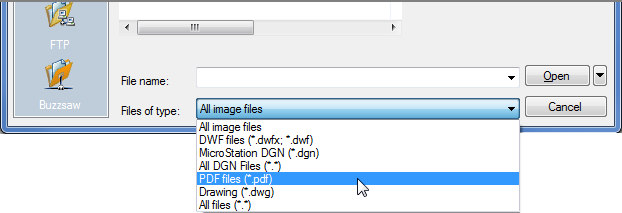
Figure 14-9 The Attach PDF Underlay dialog box
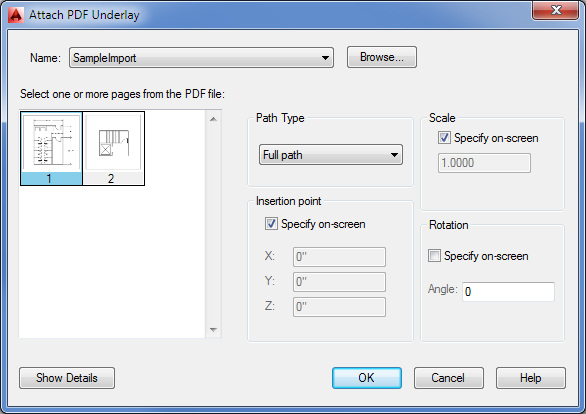
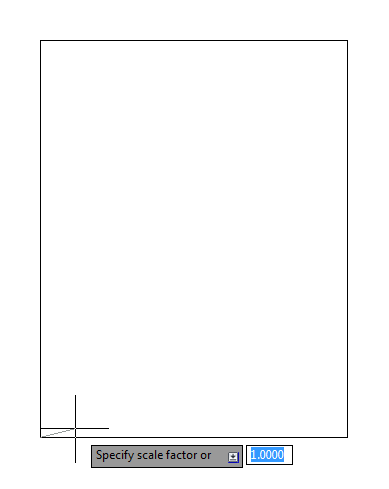
Figure 14-10 Manually scaling the raster image
Scaling and Osnaps with PDFs
In an earlier exercise, you were able to scale an image file, though you had to use a reference line that was already in the image file to scale the drawing roughly to its proper size in AutoCAD. If you have a PDF that was created from an AutoCAD file or from another vector-based program, you can use osnaps to select exact locations in the PDF.
Try the following exercise to see how you can use osnaps to select geometry in the PDF. You’ll scale the drawing so that the width of the stairs conforms to the known distance for that area.
First make sure the Snap To Underlays feature is turned on:
Now you are ready to scale the PDF drawing:
Figure 14-11 Selecting the first endpoint of the line for the Scale command
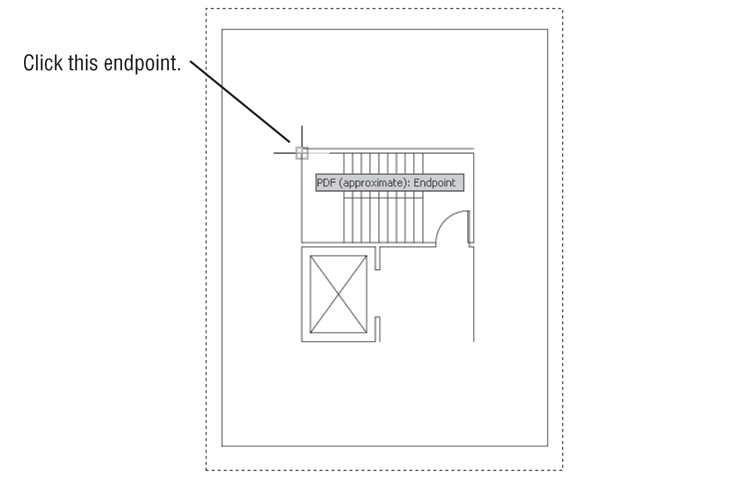
Figure 14-12 Selecting the second endpoint of the line for the Scale command
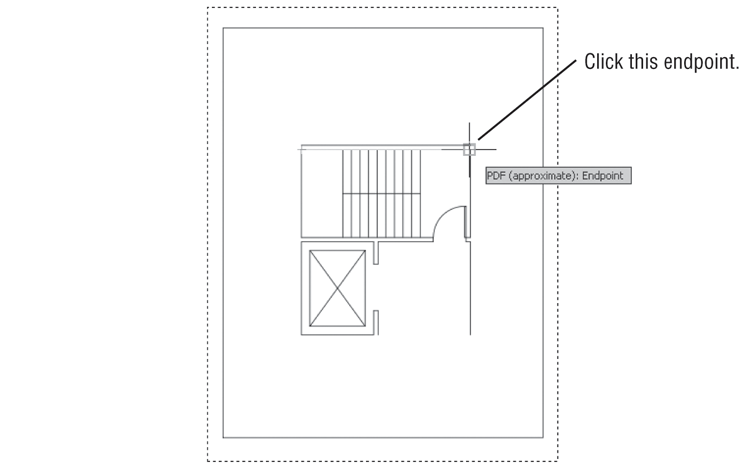
In this exercise, you were able to use object snaps directly on the imported PDF drawing. You may have noticed that a tool tip appeared with the message “PDF (approximate): Endpoint.” The PDF drawing is not an exact representation of the original drawing, so the tool tip reminds you that, even though you are using an osnap to select a location in the drawing, it is not an exact location as it would be in an AutoCAD file.
Controlling the PDF Display
You can take advantage of a number of other features of a PDF file. Just as with a typical Xref or image file, you can fade the PDF so it appears as a background image. You can also use the Clip feature you saw earlier in this chapter to clip the PDF to a specific area.
You can gain access to these and other PDF display features through the PDF Underlay Ribbon tab. This tab appears automatically whenever you select an attached PDF drawing. Click the PDF drawing of the lobby and you’ll see the PDF Underlay tab appear in the Ribbon (see Figure 14-13).
Figure 14-13 The panels on the PDF Underlay Ribbon tab
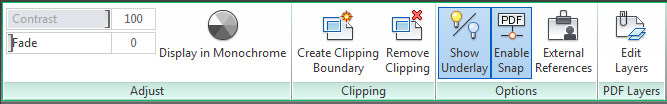
Table 14-2 describes the tools in the PDF Underlay Ribbon tab. The tools are fairly self-explanatory. For example, the tools in the Adjust panel let you control the fade and contrast of the PDF drawing. The Display In Monochrome option displays a color PDF in monochrome.
One option you’ll want to take a closer look at is the Edit Layers tool in the PDF Layers panel. If the source PDF is a drawing that contains layers, you can control the visibility of those layers using this tool. With an imported PDF selected, click the Edit Layers tool to open the Underlay Layers dialog box (see Figure 14-14).
Figure 14-14 The Underlay Layers dialog box
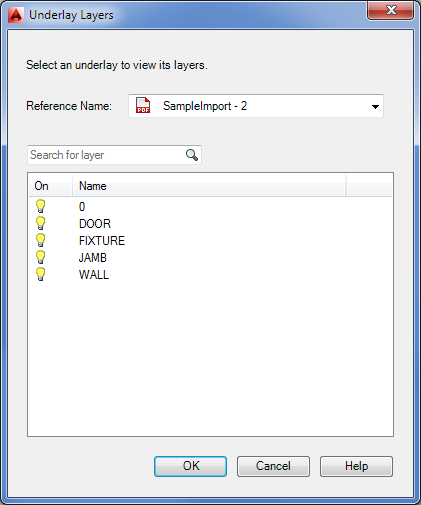
Table 14-2: The PDF Underlay tab tools
| Option | Use |
| Contrast | Adjusts the contrast setting for the PDF |
| Fade | Adjusts the amount of fade applied to the PDF |
| Display In Monochrome | Displays the PDF in monochrome |
| Create Clipping Boundary | Adds a clipping boundary to the PDF |
| Remove Clipping | Removes a clipping boundary |
| Show Underlay | Shows or hides the PDF |
| Enable Snap | Enables or disables the PDF snap feature |
| External References | Opens the External References palette |
| Edit Layers | Opens the Underlay Layers dialog box, allowing you to control layer visibility |
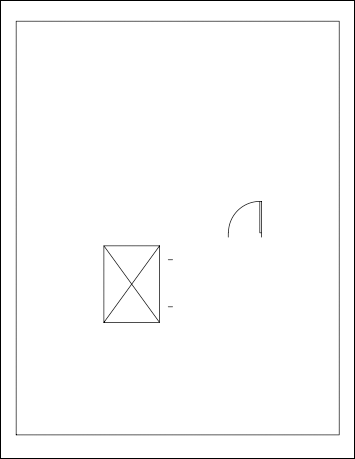
You can turn the visibility of a layer on or off by clicking the lightbulb icon to the left of it in the list. For example, if you turn off the WALL layer in the Underlay Layers dialog box for the SampleImport example, the PDF drawing will change so that the walls will not be shown (see Figure 14-15).
Figure 14-15 The imported PDF with the WALL layer turned off
Coordinating Geographic Locations
Architects and engineers use geolocation and mapping tools to help place their projects on their chosen sites. Usually a program like Google Earth or another mapping program is used to get an idea of the site conditions. Street views from Google Maps can help designers get a better idea of how their buildings will appear from a street level.
Geolocation tools can help the designer coordinate information between the different disciplines involved in a project. Designers can place their projects over an aerial view of a site and coordinate the orientation and location of key features of their design.
Up until now, the process of coordinating AutoCAD drawings with mapping data has been a patchwork process involving several steps. The scale and orientation of an imported map or aerial view often involve, at the very best, an educated guess based on the size of known features of a site. AutoCAD 2014 offers a tool that takes the guesswork out of the scale and orientation of background maps within an AutoCAD drawing.
The Geographic Location feature allows you place an accurately scaled map or aerial view in your drawing. You can then draw your designs directly on the map or import an existing AutoCAD design. Unlike an imported image, the Geographic Location map will always remain in the background so you don’t have to be concerned about an overlapping image. You can also easily switch between a map view and an aerial view as the need arises.
Let’s take a look at how the Geographic Location feature works:
Figure 14-16 The Geographic Location dialog box
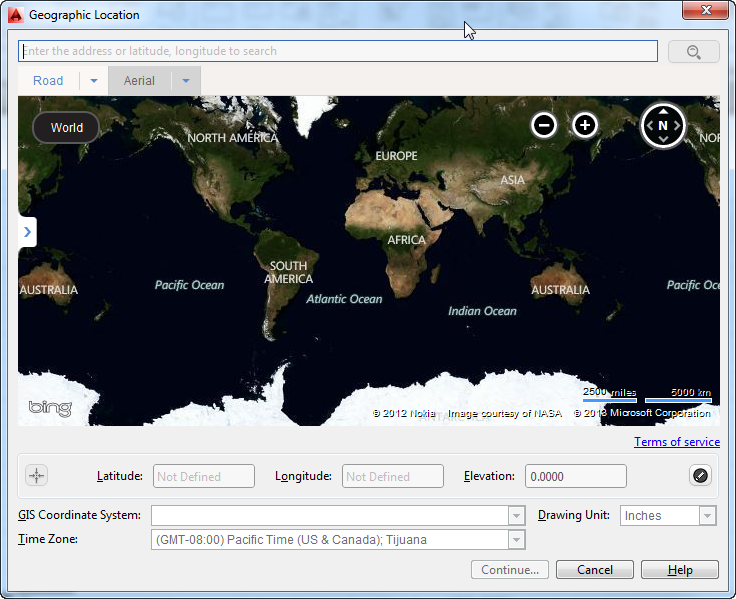
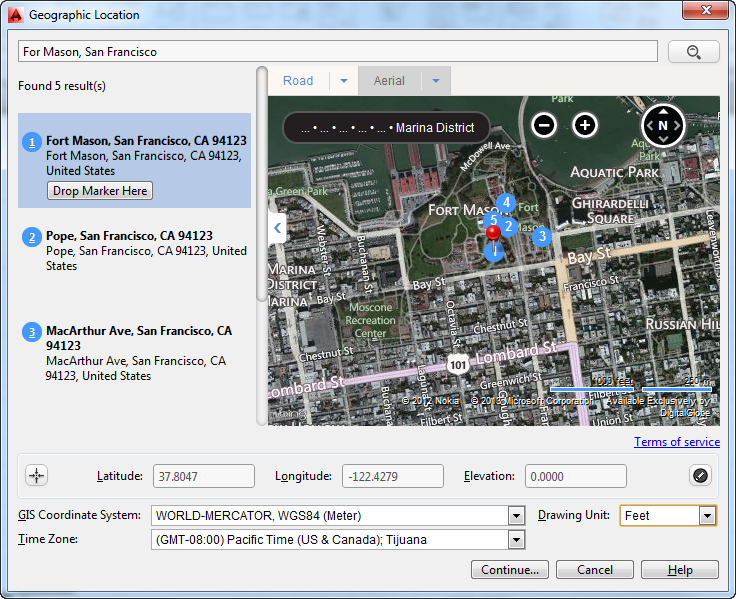
Figure 14-17 An aerial view of your selected location appears in the dialog box.
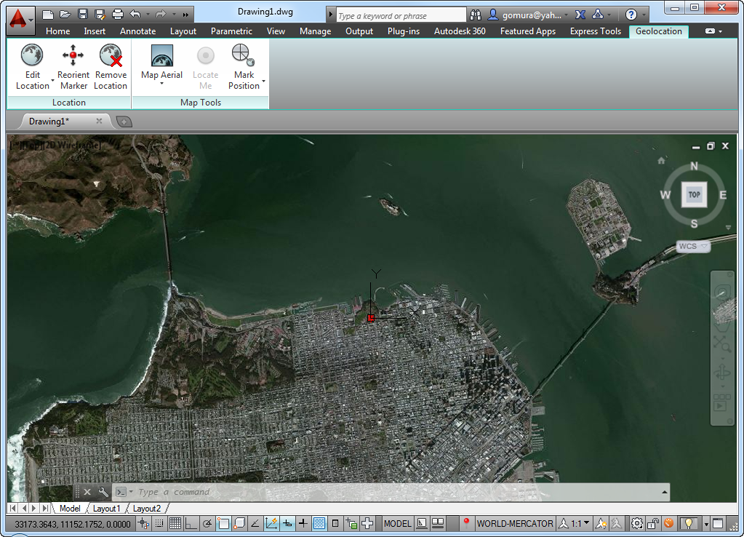
Select a point for the location <0.0000,0.0000.0.0000>:Specify the north direction or [Angle]<angle>:Figure 14-18 The drawing area with the Geographic Location aerial view
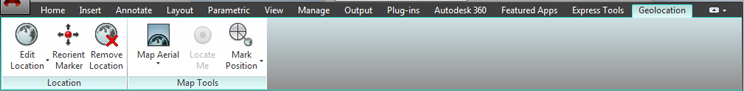
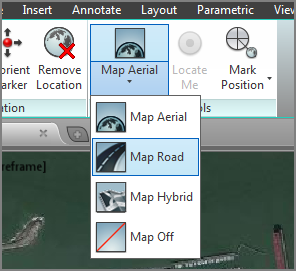
You may notice that the Geolocation Ribbon tab appears with a set of options (Figure 14-19). These options allow you to modify your geolocation view. For example, the Map Aerial flyout lets you switch to a map view and back again.
Figure 14-19 The Geolocation Ribbon tab panels
Try it in the following exercise:
Making Adjustments to the Map
As you can see from the previous steps, you can easily switch between an aerial view and a map view. You also have the option to show a combined aerial and map view using the Map Hybrid option, or turn the geolocation background off entirely using the Map Off option.
Options on the Location Panel
Besides controlling the geolocation background image, the Geolocation Ribbon tab enables you to make other adjustments to your background. Here is a rundown of the tools and features you’ll find in the Location panel:
Options on the Map Tools Panel
The Map Tools palette in the Geolocation Ribbon panel offers tools that let you mark locations in the geolocation background. You’ve already seen what the Map Aerial and Map Road options do. The following list describes the other tools in this panel:
Finding Measurements and Distances
In the first Geolocation exercise, you may have noticed the Drawing Unit option in the Geographic Location dialog box. By default, this option is set to inches, but you can set it to feet, meters, miles or some other unit of measure. By accepting the default inches for the Drawing Unit option, any measurements you take on the map will return distances using inches as the drawing unit. If the unit style of your drawing is set to Architectural, distances will be displayed in feet and inches—inches are the base drawing unit. Try the following exercise to see how distances are displayed:
Figure 14-20 The Map Road view
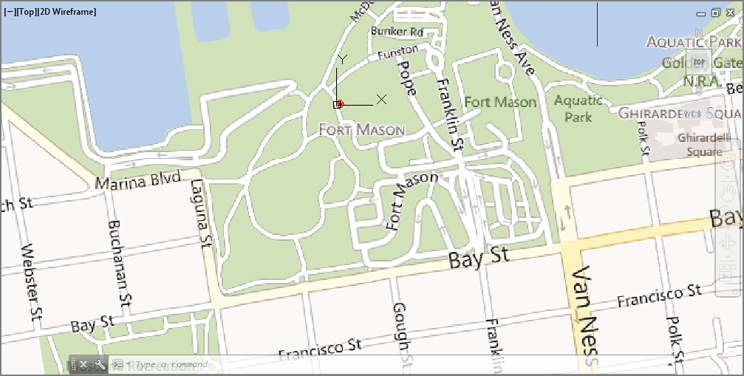
In this exercise, the distance reported by the Measure tool is in feet. Had you not changed drawing unit in steps 1 and 2, the distance reported by the Measure tool would have been 29,043 units, which is the distance in inches.
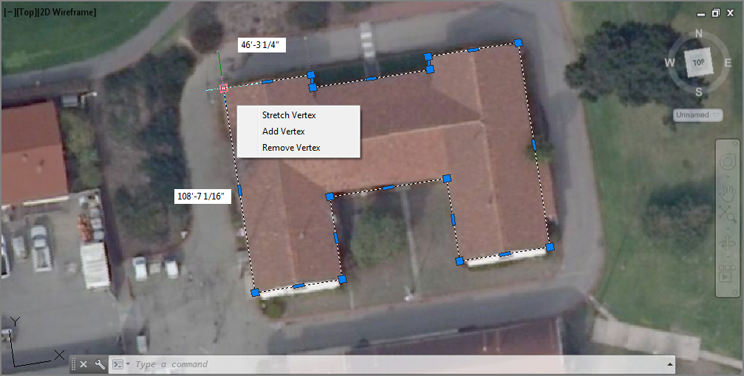
You can use other methods to find measurements in your map. For example, you could get a rough estimate of the size of an existing building by drawing a closed polyline around the building outline (see Figure 14-21). Select the polyline and hover over a grip to view the dimensions of the outline closest to the grip.
Figure 14-21 Dimensions from a building outline