Source: Reproduced with permission from Rolls-Royce plc
In this chapter, we study the aerothermodynamics of aircraft engine inlets and nozzles. These two components in an aircraft engine represent “duct” flows with internal losses and hence we propose to study them in a single chapter. Despite these similarities, the inlet flowfield bears no resemblance to the exhaust flowfield. The presence of adverse pressure gradient in an inlet diffuser leads to a stalling boundary layer behavior, whereas the favorable pressure gradient in a nozzle promotes attached boundary layer flows. Another dissimilarity between these two components is in the cooling requirements of an advanced exhaust system as compared with the inlets, which remain uncooled until well into the hypersonic flight Mach numbers.
The system requirements of an aircraft intake primarily depend on the aircraft mission specification. In general, an aircraft intake system has to be designed to many of the following qualities, namely
light weight and low cost to manufacture
provide the engine with adequate mass flow rate at a proper Mach number at the engine face throughout the flight envelope
provide spatially smooth flow into the engine compressor, that is, low steady-state distortion throughout the flight envelope
provide temporally smooth flow into the engine compressor, that is, low dynamic distortion throughout the flight envelope
integrate well with the engine nacelle and/or fuselage, that is, low installation drag
provide acoustic absorption of fan/engine noise, that is, quiet engine
provide a particle separator for an engine in a vertical lift aircraft, that is, foreign object damage (FOD) control
provide low radar signature, that is, low observables for stealth requirement
provide favorable “ilities, ” for example, accessibility, inspectability, reliability, maintainability, repairability
allow for engine thrust growth.
By a close inspection of the above “wish” list, we note several conflicting drivers that appear in the air inlet system design. Therefore, a team of engineers is tasked with seeking an “optimum compromise” for the design. The presence of conflicting requirements and seeking an optimal solution are invariably present in any commercial product development.
Our one-dimensional cycle analysis treated an aircraft engine component as a “black box, ” that is, the block approach. The “block” approach linked the exit condition of a component to its inlet condition via an efficiency parameter. For example, an exit total pressure of an inlet was linked to the inlet total pressure via the inlet adiabatic efficiency parameter ηd or the total pressure recovery parameter πd. In turn, we treated the component efficiencies as an input to our cycle analysis. Now, we propose to look inside the black box and identify design features that affect the component efficiencies. Inevitably, we will need to examine the true multidimensional aspect of the flowfield in aircraft engine components.
6.2 The Flight Mach Number and Its Impact on Inlet Duct Geometry
It is customary to divide the inlet flowfield into subsonic and supersonic flow regimes. The flow in the subsonic portion of an inlet is dominated by its boundary layer behavior, whereas the supersonic portion of an inlet is dominated by the appearance of shocks and their interaction with the boundary layer on the compression ramps and the nacelle or fuselage. Hence, the emphasis is different in the two flows. In this section, we will examine the geometrical requirements for subsonic and supersonic diffusers.
From one-dimensional compressible flow studies in aerodynamics (Anderson, 2005) we learned that
(6.1)
Hence for a subsonic duct flow, where M∞ < 1, the flow deceleration, that is, dV < 0, requires an area increase, that is, dA > 0, in the duct. Therefore, a cross-sectional area increase in a duct causes a subsonic flow to decelerate. On the contrary, a supersonic deceleration requires a flow area shrinkage with a turning point occurring at M = 1, that is, the sonic point. This suggests a converging flow in the supersonic regime to achieve a sonic condition followed by a diverging duct to decelerate the flow to the desired subsonic speeds for a supersonic diffuser. An opposite behavior is observed in accelerating flows, such as those in nozzles. A subsonic flow is accelerated through a converging duct, that is, dA < 0, and a supersonic acceleration is achieved in a diverging duct, that is, dA > 0. Again, a supersonic nozzle needs to have a sonic “throat” before the diverging area begins for a supersonic acceleration. A schematic drawing of various duct geometries and flow regimes is shown in Figure 6.1.
FIGURE 6.1Geometric requirements for inlets and nozzles (* represents the sonic throat)
6.3 Diffusers
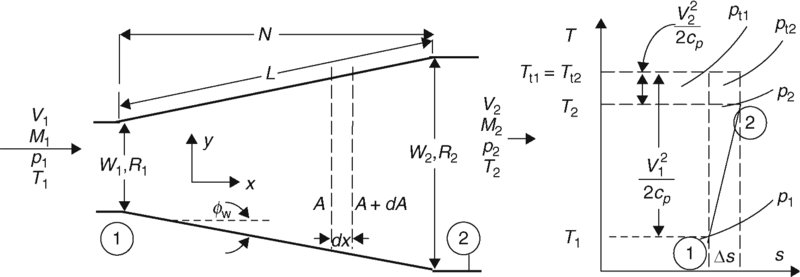
Now, let us introduce some preliminary nomenclature in a subsonic diffuser. A more detailed geometry of a subsonic diffusing flow is shown in Figure 6.2, where x is the primary flow direction and y is the lateral or transverse flow direction. The symbols W and R stand for the width (in the diverging direction) of a rectangular and the radius of a conical diffuser, respectively. The axial diffuser length is called N and the diffuser wall length is depicted as L, in Figure 6.2. We also note that the diffuser wall inclination or divergence angle is shown as w.
FIGURE 6.2Definition sketch for a subsonic diffuser and a T − s diagram depicting the static and stagnation states in a diffuser
The thermodynamic states of a diffuser flow are shown in Figure 6.2 as well. Note the static pressure rise (p2 > p1), which is accompanied by a static temperature rise in the diffuser (T2 > T1). Also, we note a large inlet kinetic energy is shown in Figure 6.2, (/2cp), which diminishes to a small kinetic energy at the exit . The flow stagnation enthalpy remains constant in an adiabatic diffuser, which is shown in Figure 6.2 as a constant total temperature process. Finally, we note that the total pressure at the exit of diffuser is lower than the inlet, which is the basis of an entropy rise Δs.
Now, we are ready to introduce a new performance parameter in a diffuser. This new parameter accounts for the static pressure rise in a diffuser, which essentially characterizes the conversion of fluid kinetic energy into the fluid static pressure. Note that in a compressible flow, the kinetic energy converts into static pressure rise as well as the internal energy of the fluid, unlike an incompressible fluid where kinetic energy is converted to static pressure only. The nondimensional pressure rise parameter in a diffuser is called the static pressure recovery coefficient CPR and is defined as
(6.2)
The “bar” over q1 in the denominator represents the mass-averaged velocity to be used in the dynamic pressure calculation. This reminds us that all internal flows contain boundary layers, which make the flow nonuniform (at least within the boundary layer). We will study this new parameter and other figures-of-merit in various diffuser environments. First, let us look at an ideal diffuser, where the fluid is both incompressible and inviscid.
6.4 An Ideal Diffuser
Applying the Bernoulli equation between stations 1 and 2 of a diffuser for an inviscid fluid, and using the continuity equation for a one-dimensional flow, we can relate the (ideal) diffuser performance CPR, ideal to the diffuser area ratio as follows:
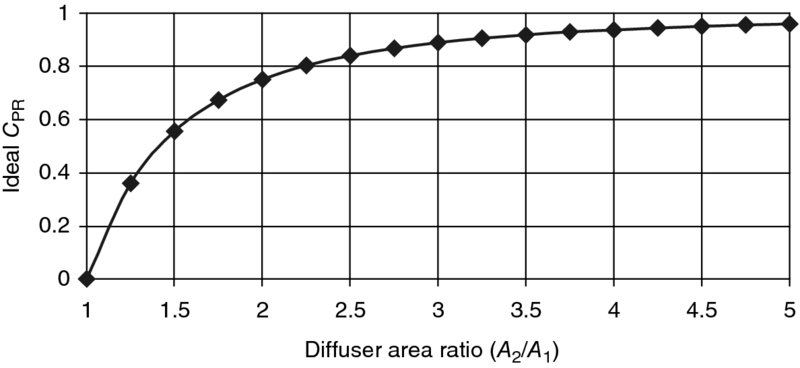
where the AR depicts the diffuser exit-to-inlet area ratio. This statement shows that for a very large area ratio diffuser, the ideal static pressure recovery will approach 1. We expected this result, which states that the inlet dynamic pressure is entirely converted into static pressure rise in a duct if the exit area is infinitely large. Let us plot the ideal static pressure recovery coefficient CPR versus the diffuser area ratio (Figure 6.3).
FIGURE 6.3 An ideal diffuser pressure recovery as a function of diffuser area ratio
We note from the ideal diffuser pressure recovery Equation 6.3 that the shape of the cross section of the diffuser does not enter the problem, that is,
(6.4)
This is a consequence of our oversimplified picture of a diffusing flow in a single direction, which ignores viscosity of the fluid and thus boundary layer formation. Consequently, a major driver in diffuser performance, namely the cross-sectional shape and the shape of the diffuser centerline influencing the wall boundary layer flow, is ignored in the ideal flow analysis. We also note that a high static pressure recovery requires a large diffuser area ratio. We will return to this parameter, that is, the area ratio, later in this chapter.
6.5 Real Diffusers and Their Stall Characteristics
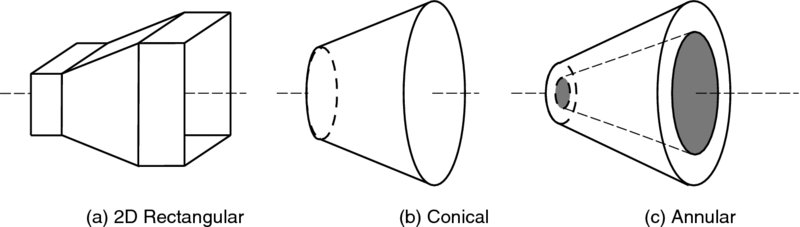
We recognize that in a real flow environment, boundary layers are formed, and have a tendency to separate when exposed to a rising static pressure, known as an adverse (streamwise) pressure gradient. Therefore, we expect the behavior of a diffuser to be driven by the viscous region near its walls, that is, the state of the boundary layer as in attached, separated, or transitory (unsteady). Consequently, the performance of a real diffuser should strongly depend on its inlet boundary layer condition. In addition, the geometry of the cross-section as well as the centerline curvature of a diffuser both influence the cross-flow tendency in the boundary layer and hence affect the three-dimensional separation characteristics of the diffuser. The formation of a skewed boundary layer is in direct response to a transverse (or lateral) pressure gradient in a diffuser duct. Therefore, we expect the geometry of the diffuser in both the streamwise area variation and the cross-sectional shape (and its streamwise variation), to be of great importance in the performance of a diffuser. The three basic geometries of interest are (Figure 6.4)
two-dimensional rectangular
axisymmetric, that is, conical
annular.
FIGURE 6.4Schematic drawing of (subsonic) diffuser geometries with straight centerline
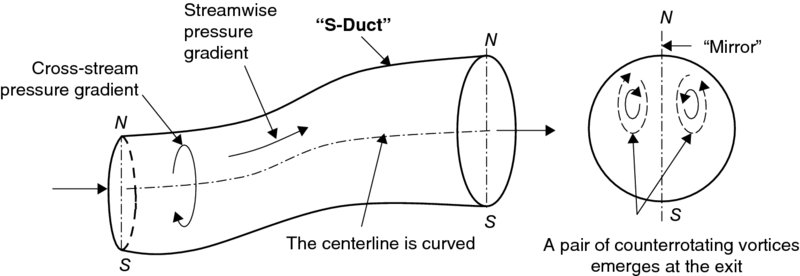
Another feature of a real diffuser is the geometrical shape of its centerline. Often the engine face is hidden from an observer looking through the inlet. The feature of a hidden engine face offers the potential of masking the radar reflections off the engine face, which is advantageous in a stealth aircraft. In addition, fighter aircraft are often designed with their engine(s) inside the fuselage to leave the wings free to carry external weapons. The so-called “buried” engine design of such aircraft requires an S-shaped subsonic diffuser duct to channel air to the engine face. From the fluid dynamics point of view, a curved duct induces a secondary flow pattern, which essentially sets up “pockets” of swirling flow at the duct exit. Often these pockets of swirling flow occur in pairs and are counterrotating. Also, since our diffuser exit is directly tied into the fan entrance duct, the pockets of swirling flow tend to locally increase or decrease (depending on their direction of rotation) the relative flow angle into the fan, which in turn can lead to cyclic loading of the fan and cause a high-cycle fatigue (HCF) problem. In severe situations, the pockets of swirling flow can produce rotating stall instability of the fan rotor. We will discuss in more detail the compressor/fan inlet flow conditions, that is, the various types of inlet distortion that affect the stability of a compressor flow in the turbomachinery chapter. In Figure 6.5, we show a schematic of a diffuser duct with an S-shaped (curved) centerline.
FIGURE 6.5Schematic drawing of an S-duct with two pockets of swirling flows (known as the secondary flow pattern) generated by the bends
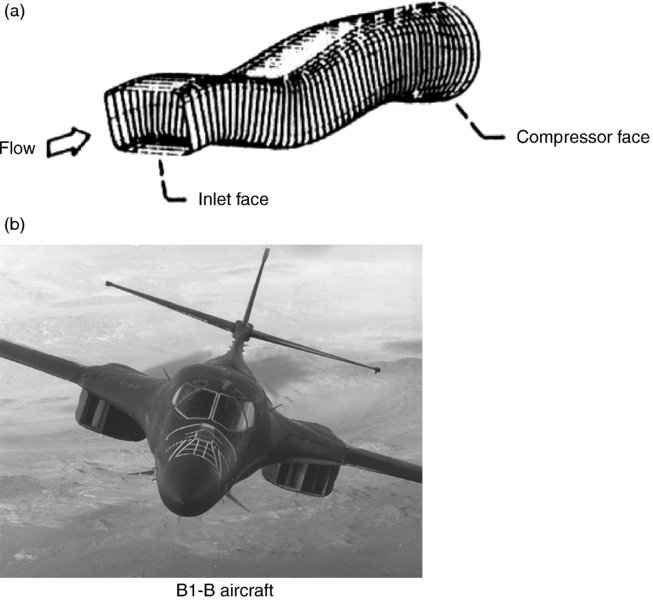
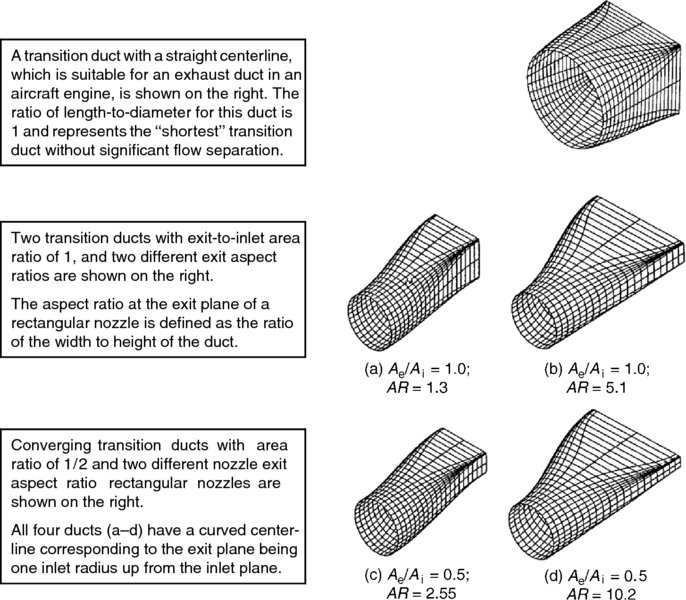
An aircraft inlet shape may be rectangular for integration and control purposes but it still has to tie in with an engine face, which is circular. Hence, the connecting diffuser duct should continually change its shape from, say, a rectangular to a circular geometry. Such ducts that change their cross-sectional shape are called “transition” ducts and pose interesting fluid mechanic problems due to their highly three-dimensional pressure pattern, that is, the flowfield. It is interesting to note that the corners in the rectangular portion of a transition duct create, trap, and transport vortices in a complex streamwise and transverse trajectory pattern along the duct’s length. Due to their prominence in modern engines, we will examine the viscous flow characteristics in transition ducts more closely in this chapter. The use of transition ducts in an aircraft engine is not limited, however, to the air inlet system. Rather, it includes circular-to-rectangular exhaust systems as well. Rectangular nozzles are useful for stealth, vector thrust, and integration purposes and will be discussed more at the end of this chapter. Figure 6.6 shows the B1-B aircraft inlet transition duct. An isometric view of rectangular nozzle transition ducts with and without curved centerline is also shown in Figure 6.7.
FIGURE 6.6Curved-centerline (double-S) transition duct in a B1-B aircraft.
Source: (a) Anderson, B.H. 1986. Reproduced with permission from AIAA. (b) Courtesy of USAF
FIGURE 6.7Isometric views of various transition ducts with and without centerline curvature. Note: that the duct area ratio is shown as Ae/Ai and the duct aspect ratio at the exit is shown as AR. Source: Farokhi, Sheu, and Wu 1989. Reproduced with permission from Springer
6.6 Subsonic Diffuser Performance
Subsonic diffusers exhibit four different flow regimes, or stall characteristics, as presented by Kline (1959) and Kline, Abbot, and Fox (1959). The flow regimes are tied to the quality of exit flow, that is, the state of the boundary layer at the diffuser exit. Although not all different flow regimes are of interest to an aircraft inlet designer, to present the chart and examine various features of the flowfields proves beneficial to all engineers interested in internal fluid mechanics.
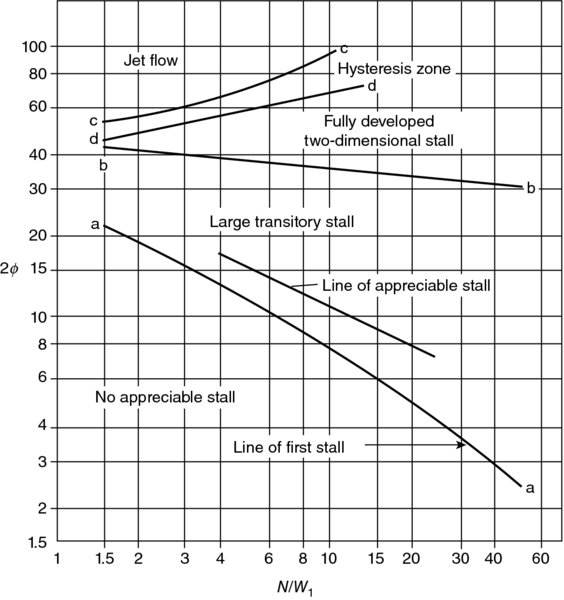
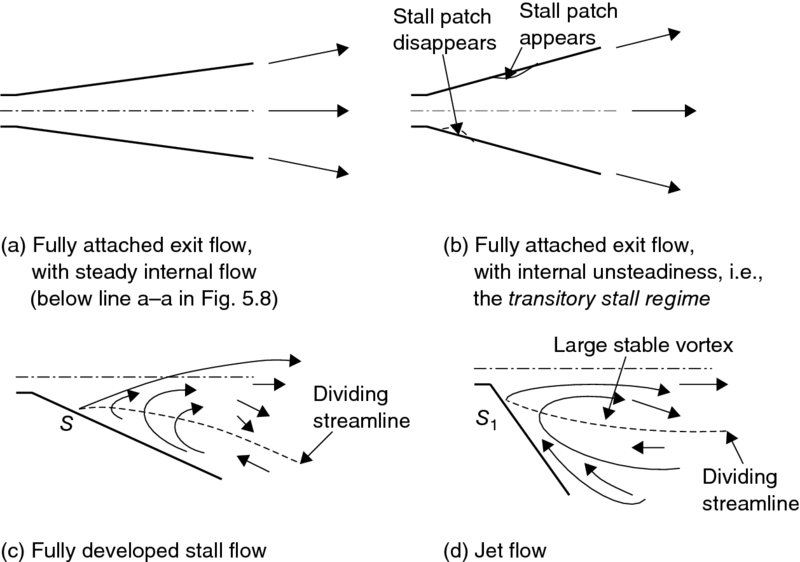
Nondimensional axial length of the diffuser and the total divergence angle of the diffuser are chosen as the axes of the chart in Figure 6.8. Let us examine this chart more closely. On the lower half of the chart where the line a–a is drawn, we note a stable flow regime, which is identified by the “line of first stall.” Above line a–a, but below line b–b, we note that the stall phenomenon is recognized and characterized as “transitory.” This behavior embodies the unsteadiness associated with the first appearance of stall, that is, the transitory stall characteristics of diffuser flows. This means that a stall patch may appear and then disappear at various positions along the diffuser wall. Beyond the transitory behavior lies the fully developed stall, which is shown above line b–b and below line c–c. In this regime, a stable but separated flow is established in a diffuser. Typically, the stable separation first appears on one wall. Upon increasing the divergence angle of the diffuser, we arrive at what is known as the jet flow. In this regime, the flow emerges like a jet, with little regard for the walls of the diffuser. Two stable and large eddies appear on the walls with a central jet flow emerging in the center. Now, upon reducing the wall divergence angle, the flow exhibits a hysteresis behavior in that the stable separated flow from one wall may now appear on the other wall. This behavior is marked as hysteresis on the chart in Figure 6.8. We can try to depict these flow regimes in Figure 6.9.
FIGURE 6.8Flow regimes in a two-dimensional rectangular diffuser. Source: Kline, Abbot and Fox 1959. Fig. 4. p. 326. Reproduced with permission from ASME
FIGURE 6.9Flow pattern in four diffusers with an increasing wall divergence angle
Now, let us look at the hysteresis behavior in a diffuser with a fully developed stall again. In Figure 6.9(c), the lower wall is shown to support the stalled boundary layer flow. So the question is why the lower wall? Now, going back from (d) toward (c) in a reverse experiment that reduces the overall divergence angle of the diffuser, the upper wall may now separate and the flow on the lower wall remain attached. Why is it that we cannot àpriori predict the wall that stalls? What else is at play that we are overlooking in our reverse experiment? The answer lies in the fine details of the flow (remember the saying “the devil is in the detail”?), namely the instability waves, that is, the disturbances that existed in both flows and those disturbances that are generated by the diffuser wall actuation mechanism in closing/opening of the walls in our reverse experiment. Hence, our actions or external influences disturbed/created the waves that changed the overall behavior. This leads us to a new level of understanding of the fluid behavior, namely, that a global large-scale behavior in a fluid flow must have its roots in the behavior of tiny waves, which may have found the environment in the flow ripe for interactions and growth, analogous to the environment of a mass-spring driven at its resonant frequency.
The highest static pressure recovery is achieved in a diffuser that is on the verge of separation, that is, when it operates in a transitory stall mode. Although maximum static pressure recovery CPR is desirable, the challenge for an aircraft inlet designer lies in the off-design behavior of such a diffuser, namely the possibility of a massive engine face distortion that could be created due to a large-scale flow separation in the diffuser. This reminds us of an analogous situation with a pendulum. As we remember, the highest potential energy of a pendulum occurs when it is inverted, that is, top heavy. But at that point, the slightest disturbance will create a large-scale response, that is, toppling of the pendulum, and thus the situation with an inverted pendulum is called metastable. In a similar vein, the highest-pressure recovery diffuser is very sensitive to the inlet disturbances and thus acts in a metastable manner. However, we can invest in a flow control strategy in the air intake system in order to enhance the stability of fluid flow in diffusers. We have a variety of flow control devices/strategies at our disposal, which include boundary layer suction, blowing, vortex generator placement, and dynamic (excitation) devices such as a vibrating foil/tab, that we can use in a modern diffuser.
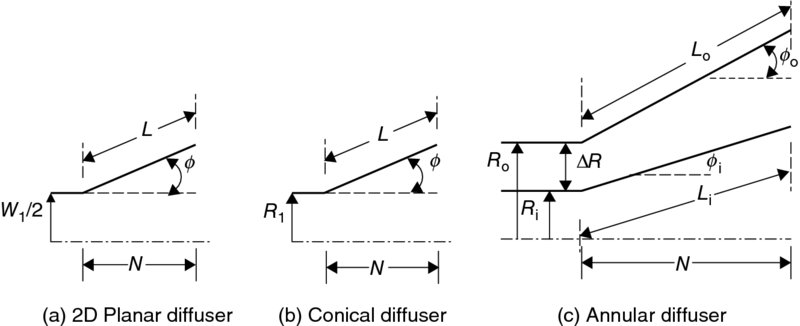
Sovran and Klomp (1963) have developed a unified way of correlating the performance of different diffuser geometries with a straight centerline. The nondimensional parameters that describe the geometry of a diffuser are chosen to be the area ratio AR for all diffusers, and the axial length ratio N/W1 for the rectangular diffuser, for the conical diffuser, and for the annular diffuser (Figure 6.10 shows a definition sketch). These geometrical parameters, from a fluid mechanics point of view, establish the (adverse) pressure gradient in a diffuser. The relative thickness of the diffuser inlet boundary layer is also recognized as an important parameter. Although similar attempts could be made with different boundary layer length scales, Sovran and Klomp chose the displacement thickness in defining an area blockage parameter B to represent the quality of the inlet flow. Blockage is defined as the ratio of blocked-to-geometric area, as
(6.5)
where AB is the blocked area, with the definition
(6.6)
FIGURE 6.10Definition sketch for three types of diffusers, the subscripts i and o in the annular diffuser (c) represent inner and outer walls, respectively
The parameter AE is an effective area accounting for the inlet flow nonuniformity. In terms of displacement thickness, the blockage is expressed as
Here, we have defined the inlet displacement thickness δ*1 in Equations 6.7 and 6.8 and an average displacement thickness over the annulus height ΔR in the annular diffuser geometry. An approximation is made in the above definitions of the inlet blockage parameter, namely, δ*2 terms are neglected by virtue of assuming the inlet boundary layer displacement thickness is reasonably thin, as compared with the channel width/radius.
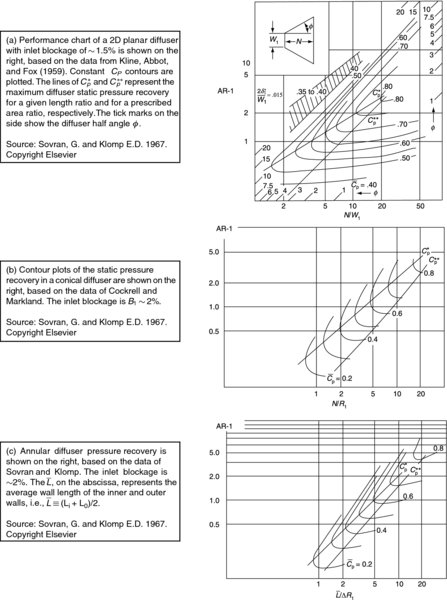
The optimum performance of these rectilinear (i.e., straight centerline) diffusers, at high Reynolds numbers assuring an inlet turbulent boundary layer, and with small inlet blockage, B < 5%, are correlated by Sovran and Klomp (1963), which are shown in Figure 6.11. These charts serve a useful first step in a subsonic diffuser design. More advanced steps require the computational fluid dynamics (CFD) analysis involving Navier–Stokes equations. Also, at transonic Mach numbers, shock waves appear, and since their interaction with the boundary layer plays a dominant role in the diffuser performance, we cannot use these charts in the high subsonic Mach range with high degree of accuracy.
The hatched region on the top performance chart in Figure 6.11 shows a low-pressure recovery zone associated with a fully developed stall behavior in 2D planar diffusers, as also shown in Figure 6.8. Note that the hatched zone lies above the 15° half angle or above the 2 of 30° in Figure 6.8. We can use these charts in several ways, namely, for a fixed area ratio diffuser, we can seek the length ratio that optimizes the static pressure recovery of that diffuser. Conversely, the area ratio of an optimum performance diffuser can be established through these charts for a prescribed diffuser length ratio. The combination of diffuser area ratio and the axial length ratio also identifies the diffuser angle and its performance. Also note that the triangular wedge, created between the C*p and C**p lines on the 2D rectilinear diffuser performance chart of the Figure 6.11, corresponds to a total diffuser divergence angle of ∼8°−10°. This leads us to the conclusion, that is, a rule of thumb, that an optimum wall inclination angle in a planar diffuser should lie in the neighborhood of w ∼ 4°. This rather shallow wall inclination angle reminds us that the (natural) diffusion is a rather slow process. Consequently, rapid diffusion requires a forcing mechanism that enhances mixing of the high- and low-energy fluid in a duct. This again suggests using either vortex generators (i.e., passive control) or devise active flow control strategies to achieve enhanced mixing in a diffuser duct.
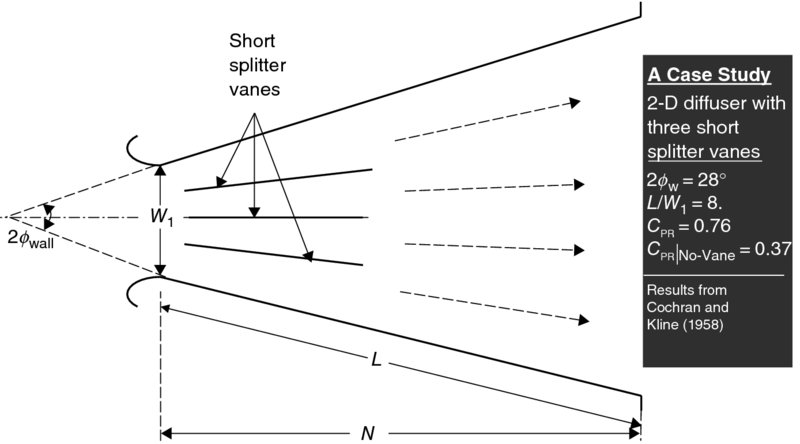
A passive method in achieving a short diffuser of a large area ratio is to install splitter plates/cones in a 2D/conical diffuser, which in essence creates a series of parallel diffusers within the overall diffuser (Cochran and Kline, 1958). This is shown in Figure 6.12.
FIGURE 6.12Wide-angle diffuser is fitted with three internal splitter vanes to prevent flow separation and promote mixing
6.7 Subsonic Cruise Inlet
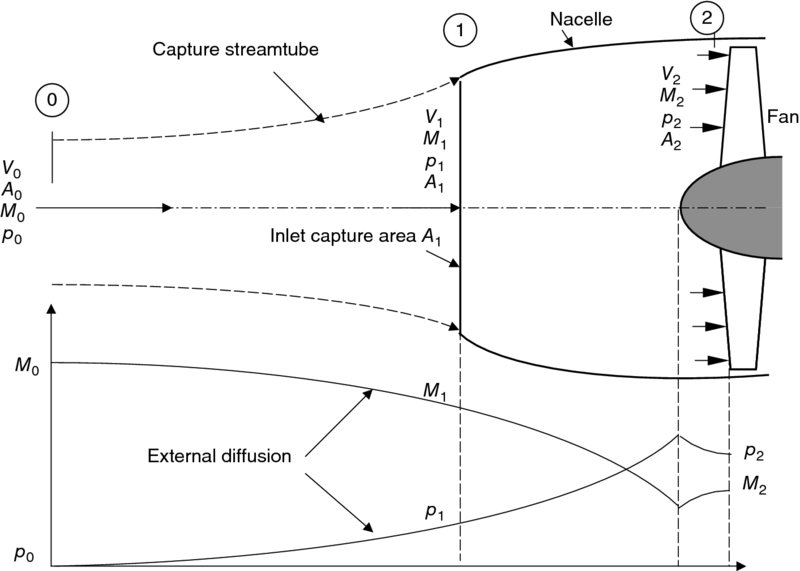
For a subsonic cruise application, the total flow deceleration is divided into external and internal segments. The external diffusion takes place outside the inlet where the design capture streamtube itself acts like a subsonic diffuser. We depict this behavior graphically in Figure 6.13. We have discussed this as a pre-entry drag earlier.
FIGURE 6.13Typical subsonic inlet at cruise condition showing external as well as internal diffusion (note that flow accelerates over the fan centerbody)
The inlet area at the lip, which is also known as the highlight, is called the inlet capture area and is sometimes given the symbol Ac. Since the external flow, in the absence of shocks and/or a centerbody that protrudes outside the inlet, is reversible and adiabatic, the ratio of parameters between the flight condition and the inlet face follow the isentropic rule. Namely,
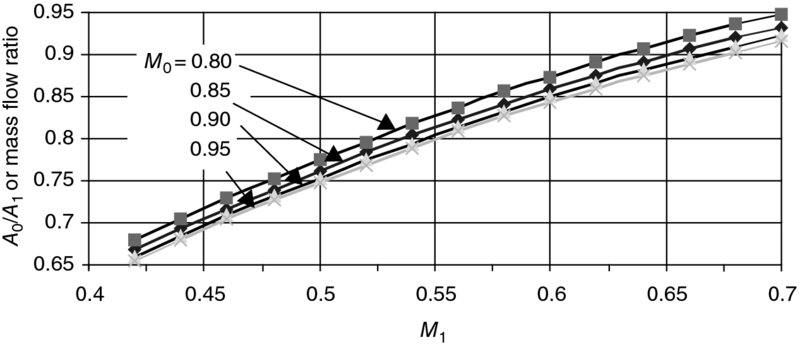
Therefore, the capture (area) ratio A0/A1 is a function of the desired external deceleration from the cruise Mach number M0 to the inlet lip Mach number M1 and is called the mass flow ratio parameter or simply MFR in abbreviation. We have graphed Equation 6.10 for various cruise flight Mach numbers in the transonic regime in Figure 6.14.
FIGURE 6.14Capture (area) ratio and inlet face Mach number
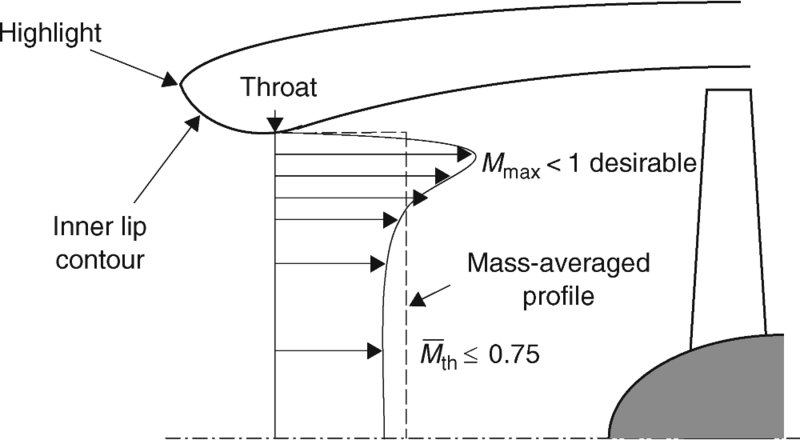
Now, let us address the limitations on M1. The internal contour of a subsonic inlet lip, that is, near the highlight, is shown in Figure 6.15. Due to the convex shape of the inner lip contour of a subsonic inlet, as shown, the flow accelerates near the throat and thus creates a nonuniform velocity profile, somewhat similar to the profile shown in Figure 6.15. In order to control the “overshoot” in local speed at the throat to a value below the sonic speed, we should limit the one-dimensional throat Mach number, that is, the mass-averaged throat Mach number, to . Therefore, it is desirable to prevent a sonic bubble formation at the throat, which may terminate in a shock and possibly cause a boundary layer separation.
FIGURE 6.15Flow curvature at the throat causes a nonuniform velocity profile
The one-dimensional throat Mach number of 0.75 represents an upper bound used for the throat sizing of a subsonic inlet. A lower value, say 0.6, is perhaps more desirable as it allows for the thrust growth potential of the engine, which invariably occurs. The average Mach number at the throat of 0.75 as compared with 0.6 represents a ∼12% increase in mass flow rate and nearly the same increase in thrust. The same inlet can thus accommodate a 12% increase in thrust without a need for resizing the inlet.
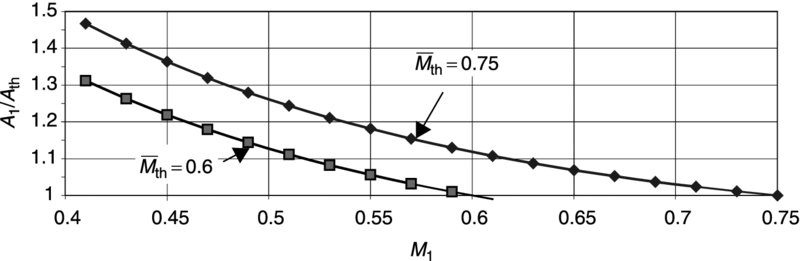
Now that we have fixed the (mass) average throat Mach number to, say, ∼0.75, applying continuity equation to the region between the highlight and the throat, and neglecting small total pressure loss due to friction on the wall, we can relate the average Mach number at highlight, M1, to the area ratio between the highlight and the inlet throat. Continuity equation applied to an isentropic flow demands
(6.11)
In Figure 6.16, we plotted the inlet lip contraction ratio AHL/Ath as a function of the inlet lip Mach number for an average throat Mach number of 0.75. There are at least two competing effects at play near the inlet lip, namely, the conflict between the internal and the external contours of the inlet. This is to be expected, since the flow splits into an inner and an outer flow around the inlet lip that influences the diffuser performance and the external nacelle drag characteristics, respectively. For example, a large inlet lip contraction ratio contributes to a parameter known as the lip “bluntness, ” which is good for low-speed, high-angle-of-attack, and side flow environments and is bad for the drag divergence characteristics of the nacelle at high speed. A low contraction ratio inlet lip offers a good high-speed characteristic for the nacelle external drag and a poor low-speed characteristic toward the engine face and flow distortion.
FIGURE 6.16Inlet lip Mach number variation with the lip contraction ratio and
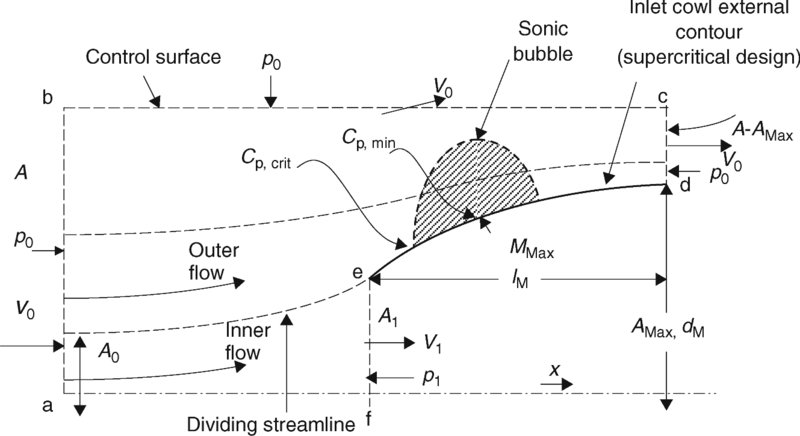
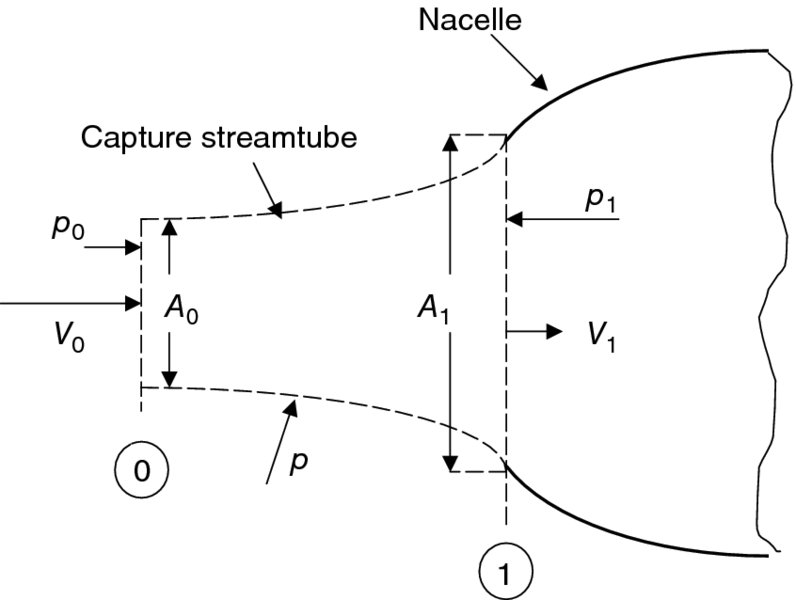
The high-speed performance of an air intake system is dominated by its external cowl drag behavior. The flow acceleration around the cowl external surface may exceed the local sonic speed with a potential for drag rise with shock formation and boundary layer separation. The maximum diameter of the nacelle and its axial disposition from the inlet lip (highlight) control the flow overspeed over the cowl outer surface. These parameters are denoted as AM and lM, respectively, for the maximum area and the length measured from the highlight to the maximum diameter. The nondimensional external cowl parameters are AHL/AM analogous to the inlet lip contraction ratio AHL/Ath, which governed the internal performance of the inlet and lM/dM. Let us examine a control volume with an inlet area larger than AM and two outlet areas, one at the capture area of the inlet and the other over the cowl maximum area, as shown in Figure 6.17. Note that at the first appearance of sonic speed on the cowl, we reach the critical Cp (as labeled). Also note that the sonic bubble is not terminated in a shock, thus we call the inlet nacelle outer contour a “supercritical” nacelle, similar to the supercritical airfoil. Somewhere inside the bubble, the velocity peaks to Vmax and at that location we noted the lowest Cp (as labeled). With the side of the control volume not coinciding with a stream surface, we allowed a flow spillage through the side at a speed of V0, which clearly is an assumption and an acceptable one.
FIGURE 6.17Control volume (a-b-c-d-e-f-a) used for the external flow analysis of subsonic inlets
Let us apply the continuity equation to the control surface shown in Figure 6.17, in order to quantify the (spillage) mass flow rate through the side in terms of the inlet mass flow rate and the geometrical parameters of the inlet.
(6.12)
Upon simplification, expression 6.12 yields
(6.13)
Applying the (inviscid) momentum equation to the control volume in the x-direction gives
(6.14)
(6.15)
We shall nondimensionalize the above equation by dividing through by the free-stream dynamic pressure, multiplied by the inlet lip area A1 to get
where the integrand in Equation 6.16 is cast in terms of surface pressure coefficient Cp in the integral and the variable of integration is now changed to A′, which is the nondimensional area A/A1. The inlet lip pressure ratio in Equation 6.16 may be written in terms of M1 and M0, as
To perform the integral on the right-hand side (RHS) of Equation 6.16, we either input a “desired” Cp distribution, which may be a constant Cp design, on the inlet external cowl or we may express the integral in terms of a surface-mean Cp, as an area-averaged quantity, defined as
We may substitute Equations 6.17 and 6.18 into Equation 6.16 and express AM/A1 in terms of the mean-surface Cp on the external cowl, the flight Mach number M0, and the capture ratio A0/A1 to get
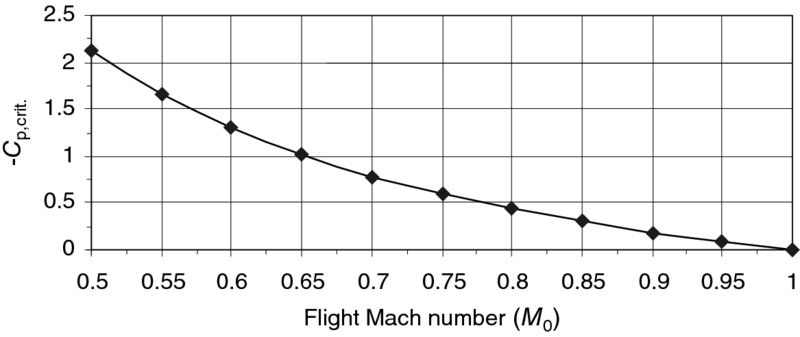
Note that the inlet Mach number M1 in Equation 6.19 is a function of the inlet capture ratio, as shown in Figure 6.14. We may substitute Cp, crit (i.e., the pressure coefficient at the sonic point) for the surface-averaged pressure coefficient, in order to plot the nacelle area ratio AM/A1. The critical pressure coefficient is a function of flight Mach number according to isentropic flow:
FIGURE 6.18The pressure coefficient at the sonic point on the nacelle forebody
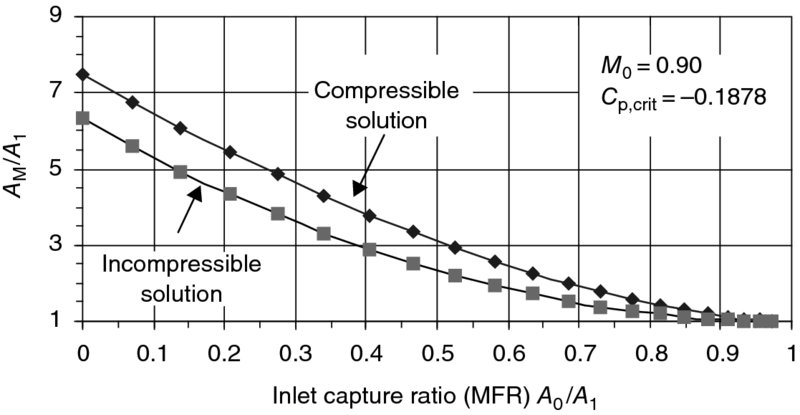
Now, let us incorporate the critical pressure coefficient in Equation 6.19 and plot the external nacelle area ratio AM/A1 in terms of flight Mach number and the inlet capture ratio, or MFR. The result is presented in Figure 6.19.
FIGURE 6.19The minimum inlet cowl frontal area (Am/A1) corresponding to the sonic flow on the cowl at the cruise Mach number of 0.90
We incorporated the incompressible solution in Figure 6.19 as well to demonstrate the effect of compressibility on the cowl frontal area requirement. Once we account for the effect of density variations in the flow, the inlet cowl area ratio requirements show a higher AM/A1 needed than the incompressible solution, as shown in Figure 6.19. A typical capture ratio at cruise is ∼0.70, which then using Figure 6.19 suggests a minimum cowl frontal area ratio of ∼1.88 for a cruise Mach number of 0.90. This area ratio corresponds to an inlet (highlight)-to-maximum diameter ratio of ∼0.73. This is somewhat lower than in the large bypass ratio turbofan engine nacelles, which have their highlight-to-maximum diameter ratio at ∼0.80–0.90, primarily due to ground clearance reasons, according to Seddon and Goldsmith (1985). The higher R1/RM in the large bypass engines leads to a slimline design of the fan cowls with an attendant relief on supersonic flow and the sonic bubble formation on the cowl.
Now, let us quantify the additive drag associated with the capture streamtube that we first introduced in the engine thrust and performance parameters Chapter 3. A control volume is shown in Figure 6.20, which is composed of the capture streamtube, free stream entrance, and the inlet lip, that is, highlight exit surfaces. The conservation of mass relates the area ratios to Mach numbers in an isentropic flow via
(6.21)
FIGURE 6.20A control volume for additive drag derivation
The conservation of momentum in the streamwise direction applied to the control volume outside the inlet may be written as
(6.22)
This expression balances the momentum change in the streamwise direction by the forces that cause the change of momentum, that is, the pressure–area terms on the RHS. By subtracting a constant pressure p0 from all the surfaces of the control volume, we can rewrite the momentum equation as
(6.23)
As we recall from the chapter on engine thrust (Chapter 3), the pressure integral on the capture streamtube is called the pre-entry or additive drag, therefore, we may write it as
(6.24)
Now, let us cast this expression in terms of a nondimensional parameter, such as
Note the logical choice of the ambient pressure p0 and the inlet capture area A1 as the nondimensionalizing parameters in Equation 6.25. These parameters do not change with the engine throttle setting, as say A0 and p1 would. We may introduce the flight Mach number on the RHS of Equation 6.25, as well as the static pressure ratio in terms of flight and the inlet Mach number M0 and M1, respectively, using isentropic relations and the capture ratio via the continuity equation, to get
(6.26)
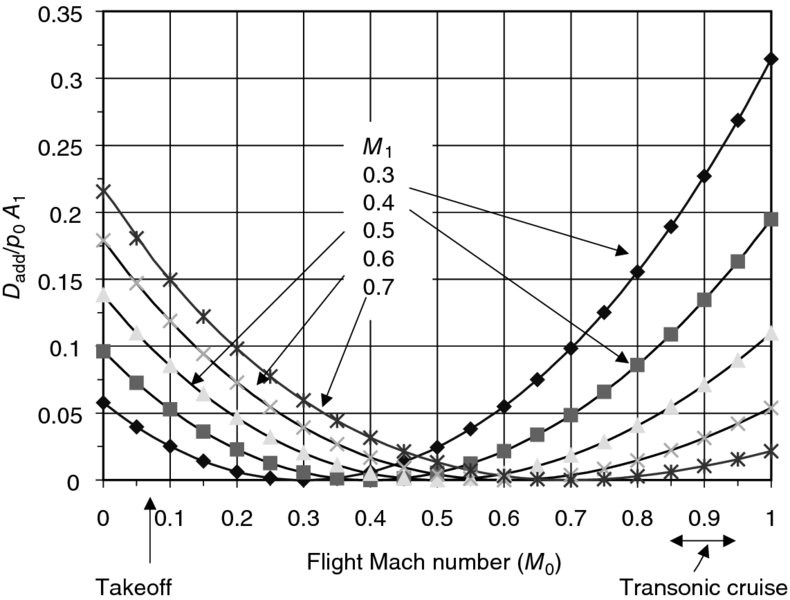
Note that the nondimensional additive drag is a function of the flight Mach number and the inlet lip Mach number, that is, a function of the capture streamtube shape. A cylindrical capture streamtube with A0 = A1 would experience a vanishing pre-entry drag. Let us graph this equation for a family of inlets characterized by different inlet lip Mach number designs and flight conditions (Figure 6.21).
FIGURE 6.21Inlet additive drag profiles from takeoff to transonic cruise at different inlet lip Mach numbers M1, γ = 1.4
Let us examine the family of additive drag curves in Figure 6.21 more closely. Two distinct trends become apparent. First, at takeoff or low-speed flight, since the inlet capture ratio is very large for this flight condition, it corresponds to a high-inlet lip Mach number, say 0.7 or higher, where
(6.27)
The second trend that we may observe from the family of nondimensional additive drag profiles, shown in Figure 6.21, is their behavior at transonic flight condition when an engine becomes inoperative. This situation is represented by a low-inlet lip Mach number corresponding to the engine “windmilling” condition, say M1 ∼ 0.3 (or less), hence
(6.28)
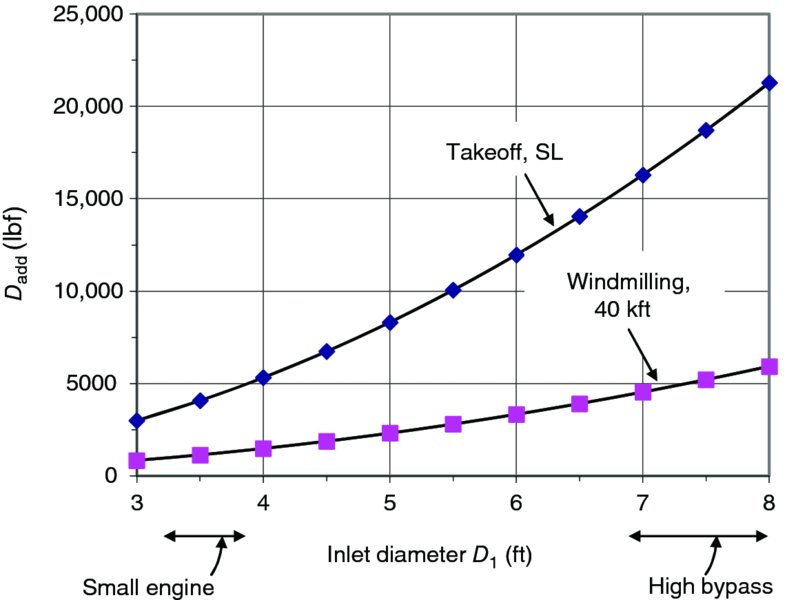
To develop an appreciation for the magnitude of the inlet additive drag at takeoff and the engine windmilling condition at altitude, we may graph these conditions for engines of different inlet diameters. The ambient pressure at takeoff was chosen to be the standard sea level pressure of 14.7 psia (or 100 kPa) and the altitude curve was chosen at 40, 000 ft with an ambient pressure of 393 lb/ft2. The result is shown in Figure 6.22.
FIGURE 6.22Inlet additive drag at takeoff and at transonic cruise with a windmilling engine (High bypass turbofan engines in range 7–8)
Although the magnitude of additive drag is very large, both at takeoff and altitude, the cowl lip suction force, on a blunt cowl, almost balances out the additive drag. In an engine out situation, however, there is a drag, a penalty due to a flow separation from the outer cowl, that is external nacelle drag increases due to the flow spillage from the inlet over the cowl lip. The imbalance between the additive drag and the lip suction force is called the spillage drag, as we introduced it earlier in the engine force and performance parameters Chapter 3.
(6.29)
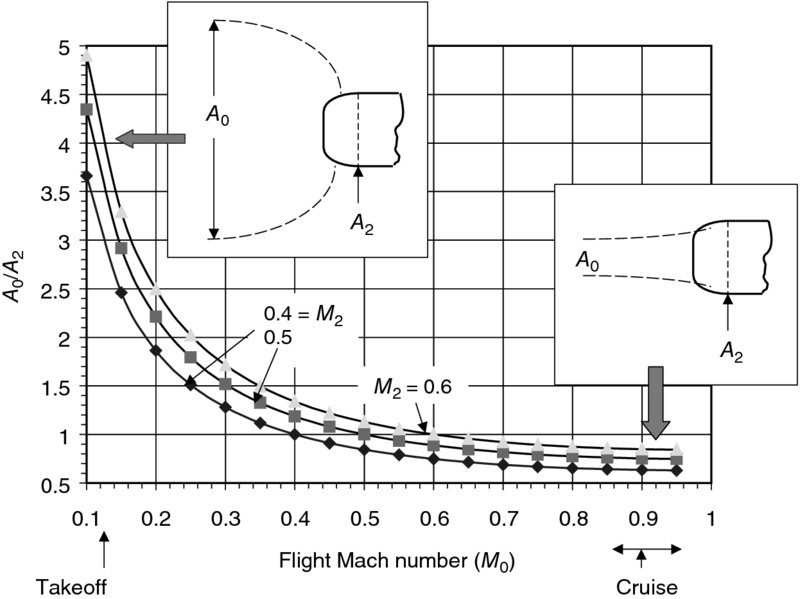
A well-designed subsonic cruise inlet attains a total pressure recovery between the flight and the engine face, that is, ∼0.995–0.997. This is a remarkable feat achieved by the aircraft industry today. Although the total pressure recovery is reduced at takeoff and climb, as the throat Mach number is increased, we may still neglect the total pressure drop when we compare the captured stream area to the engine face area. Hence, we may link the engine face Mach number and area to the flight Mach number and the free stream area using the isentropic flow relation, namely,
(6.30)
Let us graph this equation for a typical engine face Mach number range of 0.4–0.6 and the flight Mach numbers ranging from 0.1 at takeoff to 0.95 at cruise (Figure 6.23). The upper value corresponds to the proposed Sonic Cruiser commercial transport of Boeing.
FIGURE 6.23Captured stream-to-engine face area ratio from takeoff to cruise (isentropic)
6.8 Transition Ducts
A duct that changes its cross-sectional shape is called a transition duct. These ducts are prevalent in advanced propulsion systems, typically the transition from rectangular to round in the inlet and the round-to-rectangular cross-section in the exhaust systems. The fluid mechanics of transition ducts is rich with merging boundary layers at the corners of the duct, corner vortex formation, and three-dimensional pressure field setting up fascinating swirling patterns in the cross-flow, known as the secondary flows. Our interest in these ducts as a part of an inlet system is to be able to quantify and minimize the engine face distortion levels caused by these ducts over the entire flight envelope of the aircraft. In a rectangular exhaust system, however, the interest is in eliminating separation bubbles and minimizing corner vortices, which can trap the unburned fuel in the afterburner and potentially cause a burn through in the nozzle wall if combustion takes place over the wall-bounded recirculating flows. These practical concerns for the inlets and nozzles are coupled with a design-to-weight mentality, which has been the cornerstone of aircraft system development. To minimize the length of these ducts while maintaining a healthy state of boundary layer, a designer may use a computational fluid dynamics tool, which is capable of three-dimensional viscous flow solutions. Bernhard Anderson of NASA has performed numerous computational studies of transition ducts including an extensive comparison with benchmark experimental data for validation purposes. Figure 6.24 is a composite diagram of Anderson’s work (Abbott, Anderson, and Rice, 1987) with transition ducts suitable for exhaust systems (round-to-rectangular).
FIGURE 6.24Transition duct flowfield visualized by near-wall velocity vectors and a cross-stream plane and on the upper right, a flow regime map of transition ducts with area ratio equal to one. Source: Abbott, Anderson, and Rice 1987. Courtesy of NASA
6.9 An Interim Summary for Subsonic Inlets
We learned that
An inlet aerodynamic performance has an internal as well as an external component, an internal figure of merit, and an external figure of merit
An inlet internal performance is dominated by its throat Mach number
The one-dimensional (or average) throat Mach number should be less than 0.75
The internal performance is governed by the laws of diffusers, e.g., CPR (AR, N/R1, B), that is, area ratio, length ratio, inlet blockage, and centerline shape for offset exits
A cubic is proposed for the internal diffuser contour with a maximum angle of 8.7°
The internal performance at low speed is helped by the lip contraction ratio
The captured streamtube introduces an additive drag with a capture ratio other than 1, which can be very large at takeoff or with a windmilling engine situation
The capture ratio (or inlet mass flow ratio) for a subsonic cruise inlet is ∼0.70
The additive drag is nearly balanced out by the cowl lip suction force, that is, lip thrust
The uncancelled part of the additive drag by the lip suction force is called spillage drag, which is a strong function of lip bluntness
Cowl lip bluntness has an internal and an external component to it
The internal lip contour is near elliptic (i.e., a superelliptic profile)
“Bluntness” is quantifiable
Large capture ratios at takeoff and climb pose a potential problem for engine face distortion
Wing and aft fuselage-mounted inlets are exposed to flow angularity, that is, droop or toe up angles depending on their placement, that is, the wing upwash or downwash
Nacelle external contour sets the limitation on high-speed performance of the inlet
Drag divergence Mach number can be raised by a supercritical nacelle design
Drag reduction may be achieved through a hybrid laminar flow control on the nacelle
Transition ducts may be needed for integration purposes, sometimes with an offset
Secondary flow patterns are introduced in ducts with a bend or transition ducts in general, a cause of distortion
There are additional discussions that are relevant to inlets and inlet-aircraft integration:
Inlet acoustic treatment
Inlet (cowl) lip icing detection and anti-icing strategies
Inlet-engine matching, steady-state, and dynamic distortion
Further readings on subsonic inlets and engine installations (references 3, 16, 18, 22, 23, 27, 29, 31, 33, 34, 45and 47) are recommended.
6.10 Supersonic Inlets
The function of a supersonic inlet is the same as the function of a subsonic inlet, namely, to decelerate the flow to the engine face Mach number requirements (set by the throttle), typically in the range of M2 ∼ 0.4–0.6, efficiently, within the entire flight envelope. In practice, flow diffusion from supersonic to subsonic flow involves shocks. Therefore, the study of supersonic inlets is very much dominated by the study of shocks intersecting, interacting, reflecting, and the shock boundary layer interaction. We will also learn that shocks pose instability problems for an inlet and learn possible approaches to stabilizing them. As in subsonic inlets, we are still concerned about the external drag characteristics of the supersonic inlets. Although, there are no supersonic inlet flows that are reversible, we still propose to study them in the limit of reversible, adiabatic flow. By studying isentropic inlets, we learn about throat sizing issues, some off-design Mach numbers, and their impact on the inlet flow behavior.
6.10.1 Isentropic Convergent–Divergent Inlets
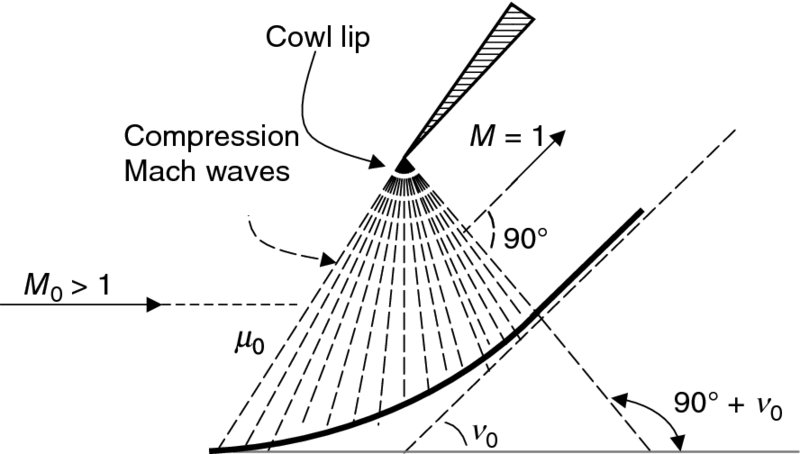
By insisting on an isentropic compression, we propose to create an isentropic compression Mach wave system that all converge to a single point, like a fan. It is theoretically possible to machine a concave surface that can decelerate a supersonic flow to a sonic flow. The concave surface is known as an isentropic compression ramp. The picture of the waves set up on an isentropic compression ramp looks like Figure 6.25.
FIGURE 6.25An isentropic compression ramp decelerating a supersonic flow to M = 1
Now let us remember the wave and ramp angles from aerodynamics. We remember that all Mach waves make an angle, called Mach angle, with respect to the local flow. Therefore, the lead Mach wave makes an angle
(6.31)
The last Mach wave, that is, the tail wave, is normal to the sonic exit flow, that is, sin−1 (1) = 90°.We also remember from Prandtl–Meyer flow that the ramp angle of v0, which is called Prandtl–Meyer angle, corresponds to turning a sonic flow to achieve a supersonic Mach number M0. Since the process of isentropic compression is reversible, it means that a flow approaching the ramp from the top of Figure 6.25 at sonic speed (i.e., reverse flow) will accelerate to achieve M0 at the bottom of the ramp, the flow turning angle is thus the Prandtl-Meyer angle v0 corresponding to M0. An expression for this angle as a function of Mach number and the ratio of specific heats γ is written as Equation 6.32, which we derived in Chapter 2.
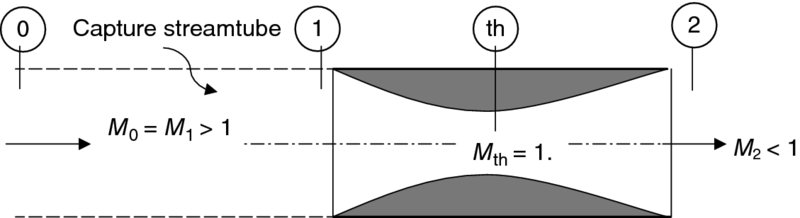
We may decelerate the sonic exit flow from the compression ramp in a subsonic diffuser, which requires a flow area expansion, that is, a diverging duct. Now let us incorporate such isentropic compression ramps in a duct and subsonic diffusers to create a convergent–divergent (C–D) duct capable of decelerating a supersonic flow to a subsonic flow reversibly and adiabatically. This duct is then called an isentropic C–D inlet. The simple geometry of it is presented in Figure 6.26.
FIGURE 6.26Schematic drawing of an isentropic C–D inlet
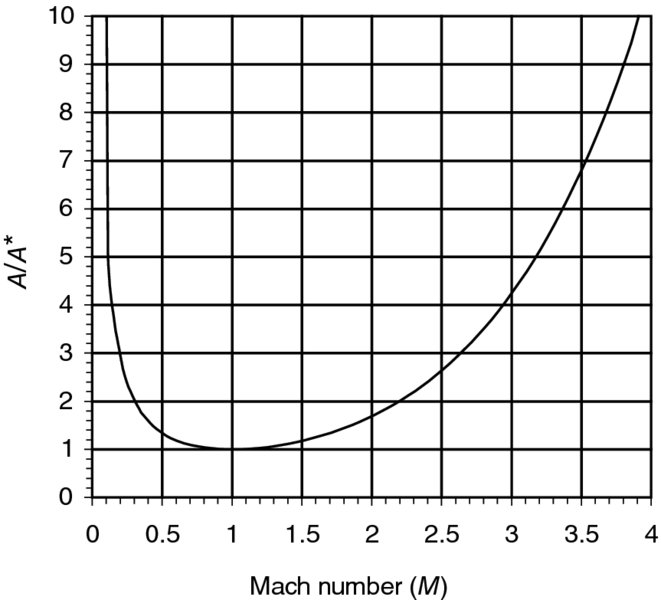
Let us note that the capture streamtube in Figure 6.26 shows a capture ratio A0/A1 of 1, and furthermore its area ratio A1/Ath is uniquely established via an isentropic A/A* relation corresponding to M1. For example, the inlet-to-throat area ratio is equal to 2 for an inlet Mach number of 2.2. We can read these numbers from an isentropic table for γ = 1.4. Also, we note that since the flow deceleration in this inlet takes place entirely within the duct, we may call it an internal-compression inlet. The unique isentropic area ratio at a supersonic speed creates problems at subsonic speeds. Namely, the same area ratio duct chokes at a subsonic Mach number too! This means that prior to reaching our target supersonic design Mach number of MD, we have already choked the throat at a subsonic Mach number. Let us return to the example we used in this paragraph. For a supersonic design Mach number of 2.2, the C–D inlet should have its area ratio set at 2.0. By looking up the isentropic tables, in the subsonic portion of it, we note that area ratio 2.0 first chokes at Mach number ∼0.3! In other words, each value of A/A* is repeated twice in the isentropic table, once in the subsonic flow part and then the second time in the supersonic flow portion of the table. Now let us graphically represent the dual nature of choking in a compressible flow, that is, is a double-valued function of Mach number. The continuity equation for an isentropic flow established A/A* according to
(6.33)
We may graph this equation for a range of Mach numbers (Figure 6.27) to demonstrate that there are two Mach numbers, one subsonic and the other supersonic, for each A/A*.
FIGURE 6.27Isentropic area ratio as a function of Mach number (γ =1.4) shows that a C–D duct exhibits choking behavior at a supersonic as well as a subsonic Mach number
Now, let us examine the sequence of events that takes place outside and within the inlet from start to the design Mach number. The capture ratio for the inlet starts larger than 1, as in the subsonic inlet at takeoff. The capture ratio remains greater than 1 until the throat chokes at the corresponding subsonic . At this moment, the capture area ratio is 1, and the throat is choked.
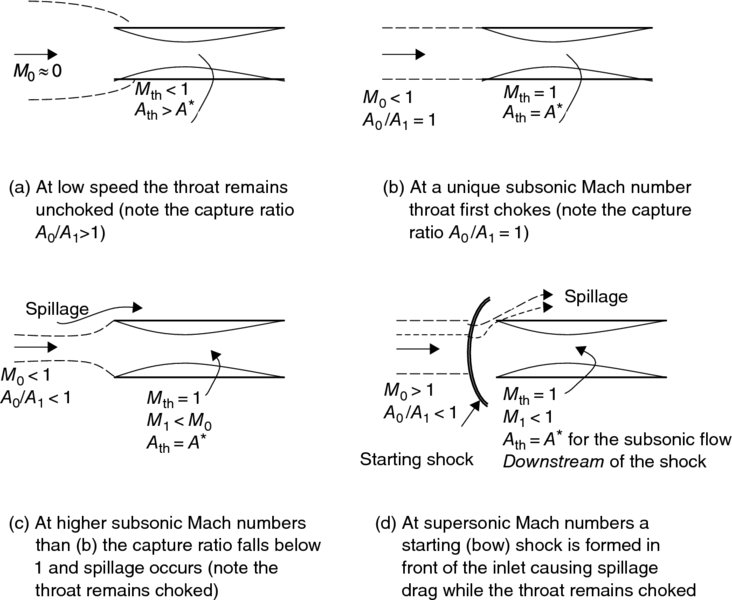
Various flow characteristics of an isentropic C–D inlet are shown in Figure 6.28 as a function of flight Mach number. The first choking occurs at a unique subsonic Mach number corresponding to the “bucket” graph of shown in Figure 6.27, where the capture ratio is exactly 1 and no spillage drag occurs. At all Mach numbers above this unique subsonic Mach number, the throat continues to remain choked and the consequence of higher flow manifests itself in a spillage over the inlet lip, as shown in parts (c) and (d) of Figure 6.28. For supersonic flow, a bow shock is formed ahead of the inlet to allow for spillage to occur. The spillage accounts for a choked throat, which is smaller than the corresponding A/A* at M0. As long as the starting shock remains in front of the supersonic inlet, the spillage drag and low total pressure recovery are the consequences of this flow. This undesirable condition is called an “unstarted” inlet. We shall now examine a few methods that enable starting a C–D inlet.
FIGURE 6.28Flow characteristics of an isentropic C–D inlet from low speed to supersonic conditions
6.10.2 Methods to Start a Supersonic Convergent–Divergent Inlet
The starting process of a supersonic C–D inlet involves swallowing the starting shock. A normal shock that is brought to the inlet lip is said to be in an incipient starting position. Any disturbance that causes the starting shock to enter the inlet will then result in the shock to move through the convergent portion of the duct and be stabilized at a location in the divergent section downstream of the throat. Normal shocks are therefore said to be unstable in a converging duct. The position of a shock in a duct is dictated by the backpressure, which establishes the downstream condition, or outflow condition of the shock. When the backpressure increases, a shock is pushed upstream and when the backpressure decreases, the shock moves downstream. We may use the backpressure principle to explore shock stability in converging as well as diverging ducts. First let us look at a converging duct that leads to a sonic throat. The starting shock that moves in a converging duct, by virtue of flow area contraction, will experience a decrease in its upstream Mach number Mx. Therefore, the shock weakens as it enters a contracting duct. Consequently, the total pressure downstream of the shock in its new position is increased, as the shock is now weaker. The sonic throat, which acts as the first engine throttle, experiences an increased mass flow rate. We remember that the mass flow rate is linearly proportional to the total pressure, that is, ∝ pt. The increase in mass flow rate downstream of the shock will reduce the shock backpressure (i.e., it creates a suction), which in turn draws the shock further in the duct and toward the throat. The shock continues moving until it has passed through the throat and is stabilized in the diverging section of the duct. The process of swallowing the starting shock, from the inlet lip to beyond the throat, occurs on the order of convective time scale, namely, t ∼ l/V, where l is the characteristic diffuser length and V is an average flow speed in the inlet. For a diffuser of ∼10 ft or ∼3 m length and an average flow speed of ∼ 2000 ft/s or ∼ 600 m/s, the starting shock should be swallowed on the order of ∼ 10/2000 s or ∼5 ms. This example shows the abruptness of starting and perhaps most importantly the unstart process of a supersonic inlet with an internal throat.
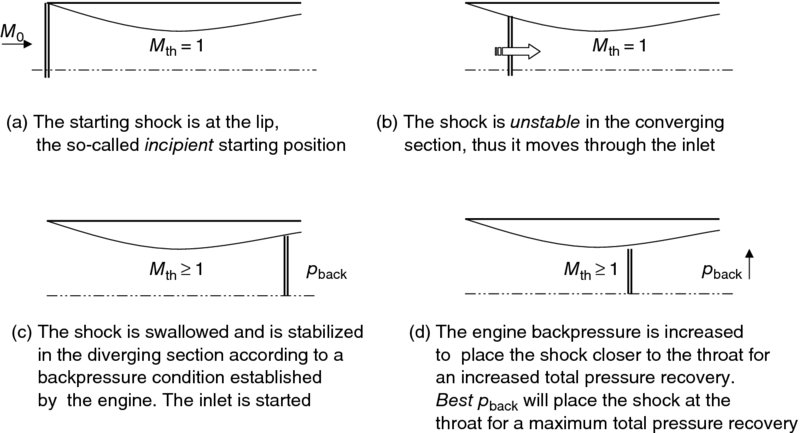
We will address the unstart phenomenon later in this chapter. Now, let us examine the movement of a normal shock downstream of the throat, that is, in the diverging section of a C–D inlet. Assuming the shock is in a position that matches the engine-imposed backpressure condition, any shock motion into the duct will cause Mx to increase, therefore pt after the shock will drop and the mass flow rate is proportionately reduced. A reduced mass flow rate has the effect of an increased backpressure, which in turn pushes the shock back upstream. So, a displaced shock in the diverging section of a duct returns to its original position, which is the essence of a stable system. A similar argument can be applied to a shock displaced in the opposite direction, that is, closer to the throat. In this case, the upstream Mach number of the shock is reduced, therefore the total pressure downstream of the shock is increased, which causes an increase in the mass flow rate and hence a reduced backpressure, which draws the shock to its original position. Again, we demonstrate shock stability in a diverging duct. We may use Figure 6.29 to graphically depict the starting process.
FIGURE 6.29Starting sequence of a C–D inlet and the role of backpressure in positioning the shock
We are now ready to examine different starting methods that will place the starting shock in an incipient position, namely, at the inlet lip. These include overspeeding, an enlarged throat, and a variable throat geometry C–D inlet.
6.10.2.1 Overspeeding
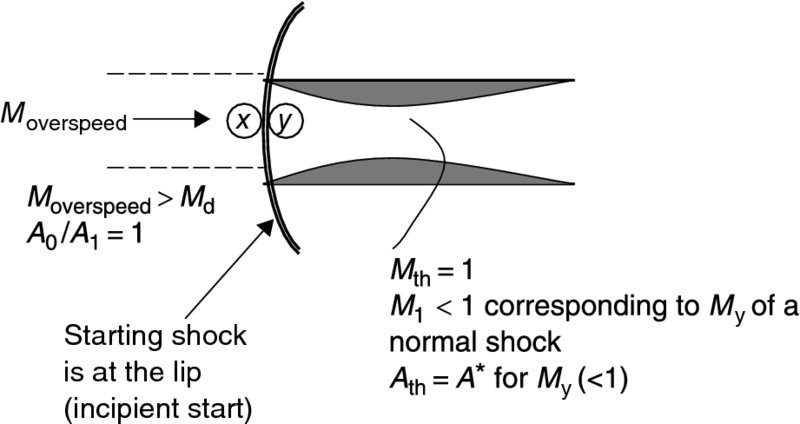
For a fixed-geometry C–D inlet, a process of overspeeding may start the inlet. This method is feasible for low supersonic design Mach number C–D inlets only. The proposition is to offer a reduced spillage condition on the inlet so as to attract the starting shock toward the inlet lip. Eventually, for an overspeed Mach number Moverspeed, the starting shock is at the inlet lip. This condition is shown in Figure 6.30 and is known as the incipient inlet start.
FIGURE 6.30The starting shock is pushed toward the inlet lip through overspeeding
6.10.2.2 Kantrowitz–Donaldson Inlet
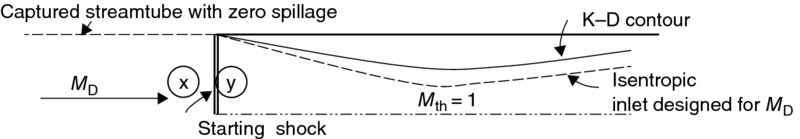
Consider a C–D inlet with an enlarged throat area that eliminates spillage of an isentropic C–D inlet at design Mach number. Therefore, we are interested in a C–D duct with a unique contraction ratio that places the starting shock at the inlet lip at the design Mach number. This is called a Kantrowitz–Donaldson (K–D) inlet, which has a self-starting capability (Kantrowitz and Donaldson, 1945). By virtue of having absorbed the spillage mass flow rate at the design Mach number, the throat area of a K–D inlet has to be larger than that of the corresponding isentropic inlet. Let us graph this proposition (Figure 6.31).
FIGURE 6.31A K–D inlet at design Mach number (at the moment of incipient start); also note the larger throat area of a K–D inlet as compared with an isentropic inlet designed for MD
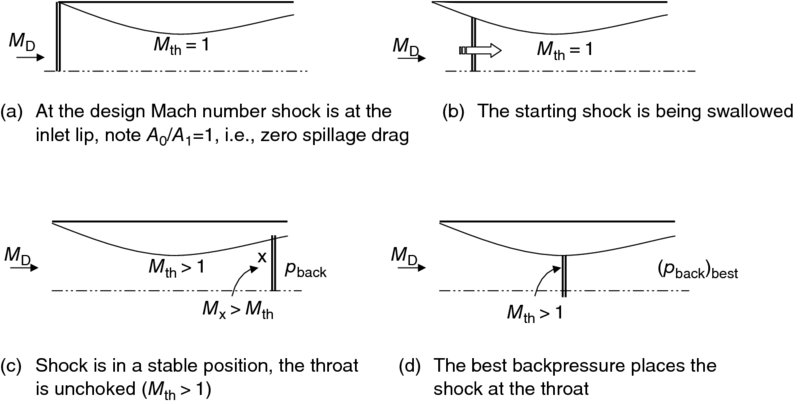
We may quantify the K–D inlet contraction ratio since from the design Mach number, we can establish My, which is the M1 just downstream of the shock. Also assuming an isentropic flow downstream of the shock, we may establish the required area ratio A1 /Ath. Once the shock is swallowed and stabilized downstream of the throat, the throat Mach number will be greater than 1. The best backpressure will place the shock at the throat. Note that a normal shock at the throat is unstable and could lead to the phenomenon of unstart, or the shock sweeping backwards through the inlet and causing tremendous spillage drag as well as a loss of engine thrust. For this reason, all supersonic inlets with an internal throat need to actively control the position of the terminal shock in the diverging section of the duct. We will address this issue later in this chapter. Let us graphically depict the various phases of a K–D inlet flow environment from design Mach number MD to the best backpressure (Figure 6.32a).
FIGURE 6.32The sequence of events in a Kantrowitz–Donaldson inlet
We now solve a problem that demonstrates the geometry and capabilities of a K–D inlet.
6.10.2.3 Variable-Throat Isentropic C–D Inlet
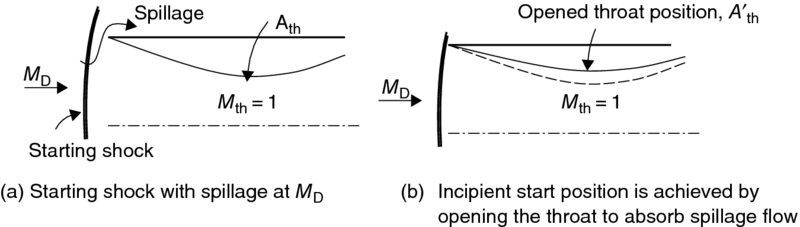
To eliminate spillage flow and attract the starting shock to the inlet lip, a variable geometry inlet opens up its throat to accommodate a higher flow rate and thus begin the starting process. The two shock positions prior to the starting and at the incipient start condition are shown in Figure 6.33.
FIGURE 6.33Variable-geometry C–D inlet starts by enlarging its throat area (from Ath to A′th)
After the starting shock has swept through the opened throat in the starting process, the throat Mach number becomes supersonic. The opening size of the throat and the throat Mach number are identical to those of the Kantrowitz–Donaldson inlet. However, in this case of variable geometry, we can proceed to close the inlet throat back to its original sonic condition/dimension. The attractiveness of this method of starting a supersonic inlet with an internal throat is the potential for high total pressure recovery, that is, high performance. The price for this performance is paid through the added system weight and complexity associated with multisegmented inlet with actuators, sensors, and a controller needed to operate the inlet.
Now, let us learn, through a sample problem, the important parameters associated with a variable-geometry inlet, namely, the percantage opening of the throat needed to start the inlet, the throat Mach number after the inlet has started.
6.11 Normal Shock Inlets
A sharp-lipped subsonic diffuser may be used in a supersonic stream without a significant aerodynamic penalty if the free stream Mach number is below ∼ 1.6. As for all supersonic inlets, a shock is formed at or near the inlet, which decelerates the supersonic flow to subsonic. The sharp lip geometry allows for an attached shock, whereas a blunt cowl leading edge creates a bow shock with the attendant external drag penalty. This type of supersonic inlet is short, light weight, and with no movable surfaces, which is suitable for low supersonic Mach applications or low-cost weapon systems development. Let us define the geometry and salient features of a normal shock inlet in Figure 6.34.
FIGURE 6.34Normal shock inlet is shown with the shock at the lip
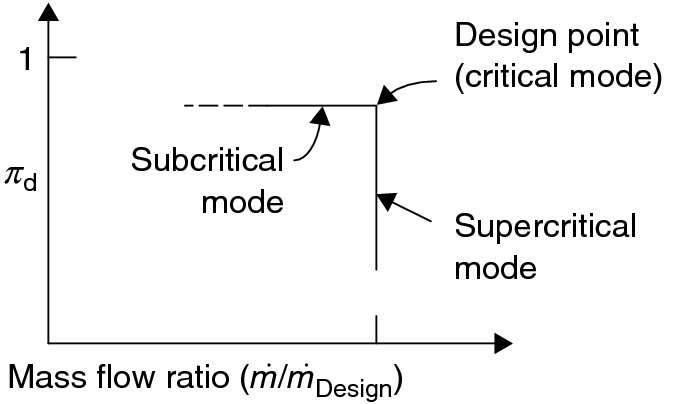
The position of the normal shock depends on the inlet backpressure, which is established by the engine. The best backpressure, corresponding to design Mach number, places the normal shock at the lip where the best total pressure recovery coincides with zero spillage drag. This mode of operation is called the critical mode. In the event of higher backpressure, that is, when the engine mass flow rate drops, the shock stands outside the inlet and a spillage flow takes place. This is the so-called subcritical mode of operation. The shock is drawn into the inlet, beyond the lip, when the engine backpressure is lowered. This is the so-called supercritical mode of operation. In the supercritical mode, the shock Mach number is higher than M0, hence a larger total pressure drop in the inlet results. Consequently, the corrected mass flow rate at the engine face increases, which results in an increase in axial Mach number, thereby, reducing the engine face static pressure, that is, the inlet backpressure. Furthermore, the shock inside the duct may interact adversely with the wall boundary layer and cause separation and increase engine face distortion.
Note that a normal shock inlet has its throat at the lip and hence experiences no starting problem. Even in the sub or supercritical modes the shock is stable. The three modes of operation of a normal shock inlet are shown in Figure 6.35. It is also customary to present the off-design performance of supersonic inlets as a plot of their total pressure recovery versus the inlet mass flow ratio. The design mass flow rate is used as the reference value to create a dimensionless mass flow ratio. A typical graph of shock total pressure recovery versus the mass flow ratio for a NS-inlet is shown in Figure 6.36.
FIGURE 6.35Three modes of operation of a normal shock inlet show the subcritical mode as an external-performance limiting and the supercritical mode as the internal performance limiting flow conditions with the best mode identified as the critical mode
FIGURE 6.36Typical performance plot of a normal shock inlet
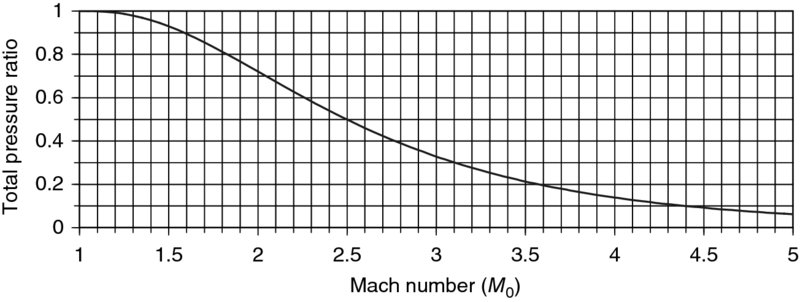
The total pressure recovery of a normal shock rapidly deteriorates beyond Mach ∼ 1.6, where a ∼90% total pressure recovery is achieved. The normal shock recovery as a function of Mach number is graphed in Figure 6.37.
FIGURE 6.37Normal shock recovery as a function of Mach number (γ = 1.4)
6.12 External Compression Inlets
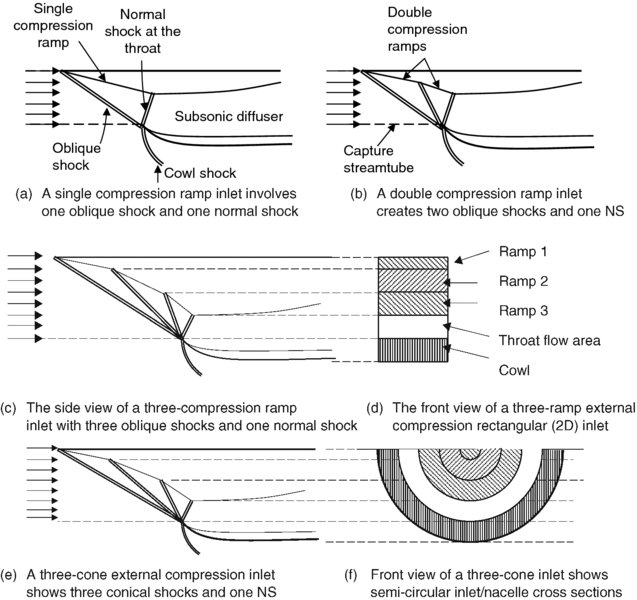
To achieve a higher total pressure recovery than a normal shock inlet, we need to design an inlet configuration that incorporates multiple shocks. Supersonic flow deceleration over multiple shocks is more efficient than the deceleration through a normal shock. Here, the efficiency of the supersonic diffusion process is defined by the total pressure recovery of the shock system. An external compression inlet is designed to maintain the shock system external to the inlet and, hence, has its throat at the cowl lip. The internal duct is hence a subsonic diffuser, which is often a transition duct with offset. Two-dimensional external compression inlets employ external compression ramps to create plane oblique shocks, whereas axisym-metric inlets employ multiple cones to create conical shocks. Single and multiple ramp external compression inlets as well as axisymmetric inlets are shown in Figure 6.38. The position of the normal shock, which is also called a terminal shock, is dictated by the inlet backpressure. The optimal location for the normal shock is at the throat where the flow Mach number is the least. With the normal shock at the cowl lip, the inlet is said to operate at its critical mode, which represents the design point. Figure 6.38 shows several external compression inlets at their design point operation.
FIGURE 6.38Shock systems of two-dimensional and axisymmetric external compression inlets with the best backpressure placing the terminal (normal) shock at the lip (throat)
The total pressure recovery of the inlet shock system may be calculated via a straightforward marching technique that we learned in supersonic aerodynamics. Assuming the geometry of the external compression ramp is known (the so-called design problem), each ramp angle represents the flow turning θ, which combined with the information on the local Mach number M, leads to a determination of the wave angle β, by using a θ-β-M oblique shock chart (or conical shock charts). The wave angle helps establish the strength of the oblique shock, which depends on the normal component of the flow to the shock, namely, Mn = M sinß. Since the local Mach number is only a priori known in station 0, that is, the free stream condition, we need to start with the first oblique shock and continue marching downstream through multiple ramps and shocks. This method is best illustrated through an example.
6.12.1 Optimum Ramp Angles
In the previous problem, we arbitrarily chose two ramp angles of 8° and 12° net turning, respectively, for our Mach 2.0 inlet. This design recovered nearly 95% of total pressure through the shock system. A question of optimization arises as to the optimum ramp angles, which lead to a maximum pressure recovery at a given Mach number. So, let us restate the problem in general terms as follows:
Find optimum ramp angles for a multiramp external compression inlet designed for M0 > 0.
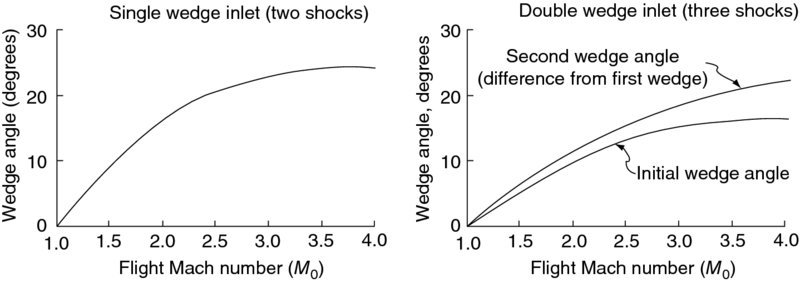
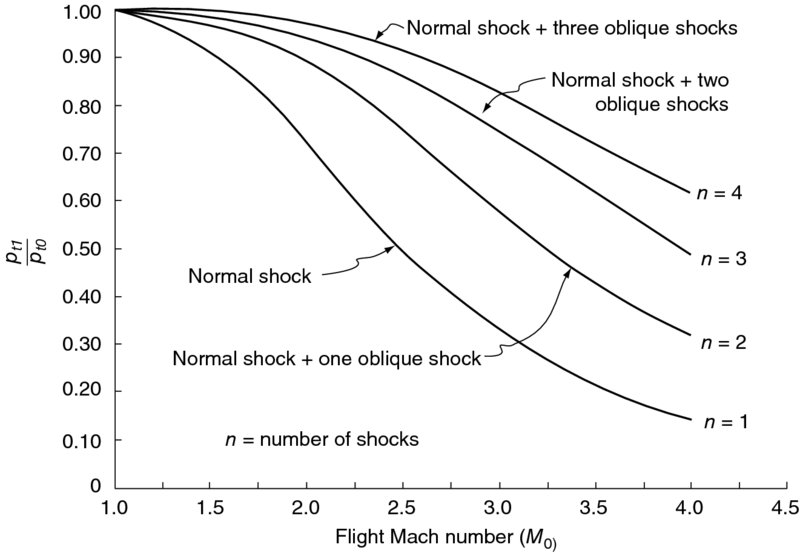
This fundamental aerodynamic question was raised and answered by Oswatitsch in a 1944 German report (translated into English in 1947 as a NACA report). The result is astonishingly simple. It states that in an optimum multishock inlet, all shocks need to be of equal strength. This speaks to the principle of equal burden. Hesse and Mumford (1964) in their classical propulsion textbook produced the optimum geometries for a single and double ramp external compression inlet. These are shown in Figures 6.39 and 6.40.
FIGURE 6.39Optimum ramp angles for a single and double-ramp external compression inlet. Source: Rodean 1958
FIGURE 6.40Optimum total pressure recovery of external compression inlets. Source: Rodean 1958
6.12.2 Design and Off-Design Operation
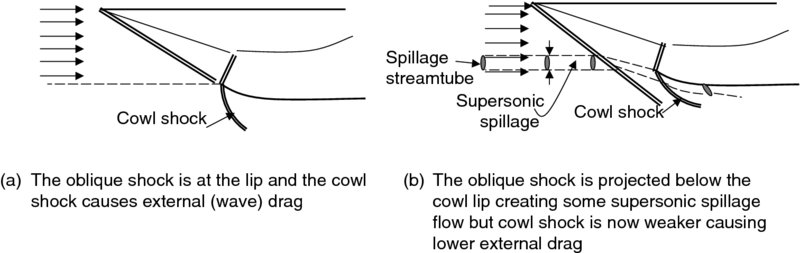
The shock system associated with an external compression inlet determines both the internal performance of the inlet through total pressure recovery as well as the external performance through inlet external drag. The design point operation focuses the oblique shocks onto or slightly below the cowl lip and places the terminal shock exactly at the throat. These two configurations of shocks are graphed (Figure 6.41) for discussion purposes.
FIGURE 6.41Shock location and nacelle wave drag issues
Figure 6.41 raises an interesting issue about the spillage and the inlet wave drag. In Figure 6.41a the capture ratio A0/A1 is exactly 1, which eliminates any spillage drag. On the contrary, the static pressure rise on the cowl lip due to a strong cowl shock integrates into a wave drag. In Figure 6.41b the configuration of the shock system intentionally misses the cowl lip and hence incurs some spillage drag. Note that the capture ratio A0/A1 is less than 1. But, since the flow downstream of the oblique shock has already turned by the ramp inclination angle, any additional turning due to cowl (thickness) creates a weaker cowl shock. Hence, a weaker static pressure rise on the cowl leads to a lower wave drag penalty of the inlet. Here, we learned an important lesson about system optimization. Simply stated, a system is more than the sum of its isolated parts! There are interaction laws between the elements of the system that inherently affect system behavior and hence optimization.
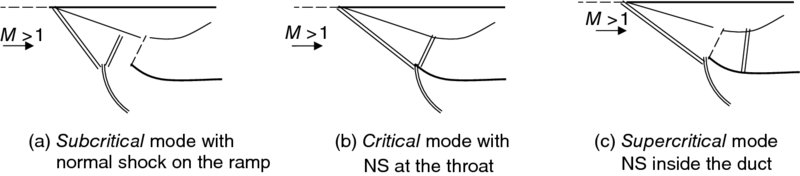
The location of the normal shock is dictated by the inlet backpressure. The cowl lip represents the throat and hence the minimum Mach number. The normal shock placement at the throat is hence considered to represent the design point operation, the so-called critical mode. With an increase in the backpressure, the normal shock is pushed onto the compression ramp(s) and hence it represents a subcritical mode of operation. With a lowered backpressure, the shock is sucked into the inlet, that is, the subsonic diffuser, and it represents a supercritical mode. These are shown in Figure 6.42.
FIGURE 6.42Definition sketch for external compression inlet modes of operation
The off-design operations involve subcritical and supercritical modes. The normal shock inside the subsonic diffuser, as shown in Figure 6.42c, results in a lower total pressure recovery, as well as a potential boundary layer separation, engine face distortion. The lower total pressure recovery of this mode of operation is due to a stronger normal shock inside the duct than the shock at the throat. The method of calculation of the shock strength is identical to the supercritical mode of a normal shock inlet (see example problem solved). On the shock boundary layer interaction inside the duct, we may have to employ active or passive viscous flow control techniques, for example, boundary layer suction, vortex generators, and so on. We will address the flow control schemes that may be utilized to stabilize a boundary layer later in this chapter.
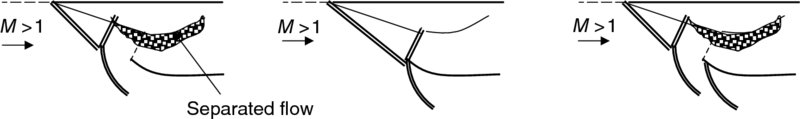
With an increasing backpressure in the inlet, the normal shock is pushed out of the inlet lip and onto the external compression ramps. There are three major penalties associated with this mode of operation. One, the spillage drag increases significantly. Two, the intersecting shocks outside the inlet create a vortex sheet (shear layer), which creates a distortion at the engine face. Three, the normal shock on the ramp could separate the boundary layer and cause a large amplitude oscillatory flow pulsation, with high levels of distortion at the engine. This oscillatory flow is called Buzz instability and is worth a closer examination. The separated boundary layer of the ramps partially blocks the throat. To supply the engine with its desired flow rate, the blocked throat experiences fluid acceleration and hence the shock backpressure drops. This will cause the shock to be attracted to the inlet lip. However, at the inlet lip position, the engine is supplied with more flow than it needs; therefore, the shock is pushed back out onto the ramps. An oscillatory back and forth flow is now ensued. A complete Buzz instability cycle is shown in Figure 6.43.
FIGURE 6.43A Buzz instability cycle showing (from left) a blocked throat, reduced backpressure, shock movement toward the lip, pressure buildup, pushing the shock back out sequence
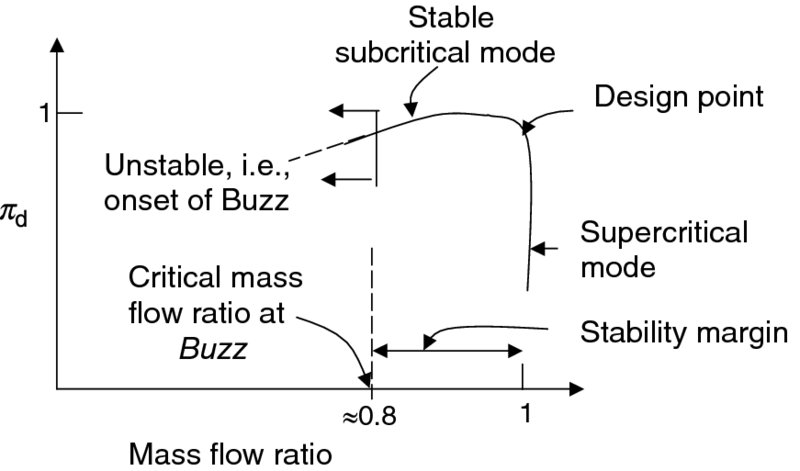
It is customary to capture the overall performance of external compression inlets in a total pressure recovery graph versus mass flow ratio. A typical example is shown in Figure 6.44.
As noted earlier, the ramp angles for optimum total pressure recovery are a strong function of flight Mach number (Figures 6.39 and 6.40). In addition, the engine mass flow rate demands are different at different Mach numbers, altitudes within the flight envelope. For these reasons, the external compression ramps (or cones) need to be equipped with actuators (presently hydraulic) that control their position in various flight phases. Also, the buzz instability improvement/elimination as well as engine face distortion level control demand boundary layer management techniques that require variable geometry. Let us address these and other performance optimizing techniques used in this class of supersonic inlets. Although in our discussions, we refer to ramps, as in 2D inlets, similar statements can be made for cones and axisymmetric inlets.
6.13.1 Variable Ramps
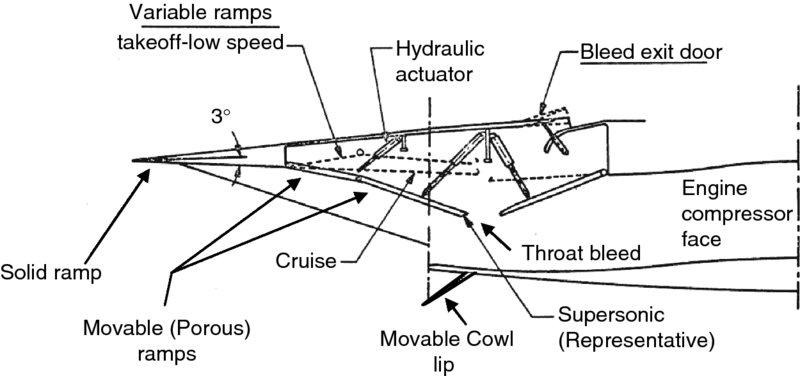
The leading ramp, for structural reasons, is a fixed-geometry solid wedge, typically 3–5°. The following ramps may be extended into the flow or withdrawn from the flow using hydraulic actuators. The withdrawn position, which is also referred to as collapsed ramp position, allows for a larger inlet area needed for the takeoff, climb, subsonic cruise, and transonic acceleration. Figure 6.45 shows a typical 2D variable geometry external compression inlet (Abernethy and Roberts 1986).
FIGURE 6.45Variable geometry inlet shows a movable cowl lip, ramp actuation at different flight phases and a bleed exit door. Source: Adapted from Abernethy and Roberts 1986
6.14 Mixed-Compression Inlets
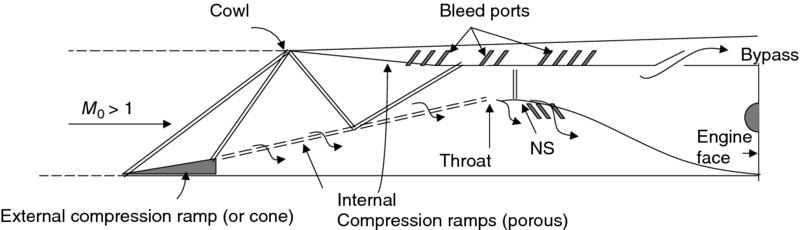
To achieve the entire supersonic deceleration outside an inlet, as in the external compression inlet, is only economical at flight Mach numbers below ∼2.5. The penalty comes from excessive cowl wave drag, as the cowl lip has almost the same inclination, with respect to the flow, as that of the last compression ramp of the inlet. A large flow deceleration needs a large supersonic flow turning and hence the cowl lip angle may exceed the θmax of the oblique shock, resulting in a bow shock formation. To alleviate this performance limitation of external compression inlets, that is, to reduce the curvature of the cowl lip, we need to allow for internal shock reflections and obviously an internal throat. An inlet with these characteristics exhibits a mixed compression behavior and hence earns the name. A schematic drawing of a mixed compression inlet is shown in Figure 6.46.
FIGURE 6.46A mixed compression inlet with external and internal shocks, an internal throat
The operational Mach number of a mixed compression inlet extends to ∼ Mach 4.0–5.0. Since we can allow multiple ramps both outside and inside of the inlet without a concern on a cowl wave drag penalty, we may achieve a rather high total pressure recovery characteristic with this inlet. However, the presence of an internal throat indicates an inherent starting problem. The presence of external compression surfaces indicates a Buzz instability in the unstart mode. The shocks that are created and reflected from solid surfaces inside the duct alert us to the shock boundary layer interaction problems with flow separation and engine face distortion as serious byproducts. The sharp cowl lips or the centerbody indicate sensitivity to misaligned flow, which is expected with takeoff, climb, landing, maneuver, and side wind. Now, let us summarize the challenge areas for mixed compression inlet design/operation:
Starting problem
Buzz in unstart mode (subcritical instability)
Shock-induced separated boundary layers and distortion
The starting problem demands a variable throat inlet for practical purposes, as discussed earlier in the internal compression inlet section. In case of axisymmetric inlets, the centerbody assumes a translational displacement to open and close the throat area. Two-dimensional compression ramps, however, may be collapsed or deployed using a hinged flap design with hydraulic actuators. The origin of Buzz in unstart mode is the boundary layer separation off of compression ramps. Consequently, boundary layer suction and throat bleed need to be employed to overcome this instability. The separated boundary layers inside the duct, as a result of shock boundary layer interaction, also dictate a boundary layer bleed strategy through porous surfaces or slots to be incorporated in critical duct areas. The unstart problem, or providing an adequate stability margin for the normal shock in the divergent portion of the inlet, demands a shock position sensor as well as fast acting valves to alleviate the backpressure problem. A shock position sensor may be a pair of pitot tubes mounted in the desired location on the wall of the diffuser downstream of the throat. The terminal shock is to remain between these two pitot tubes. In the event of increasing backpressure, where the shock is pushed toward the throat (and potentially beyond it to the unstart position), the pitot tube reading suddenly drops and indicates the shock crossing. Fast acting valves are to be opened to dump the excessive flow from the downstream position so as to relieve the backpressure and stabilize the shock. Since the two pitot tubes confine the position of the shock, they are also called a shock trap.
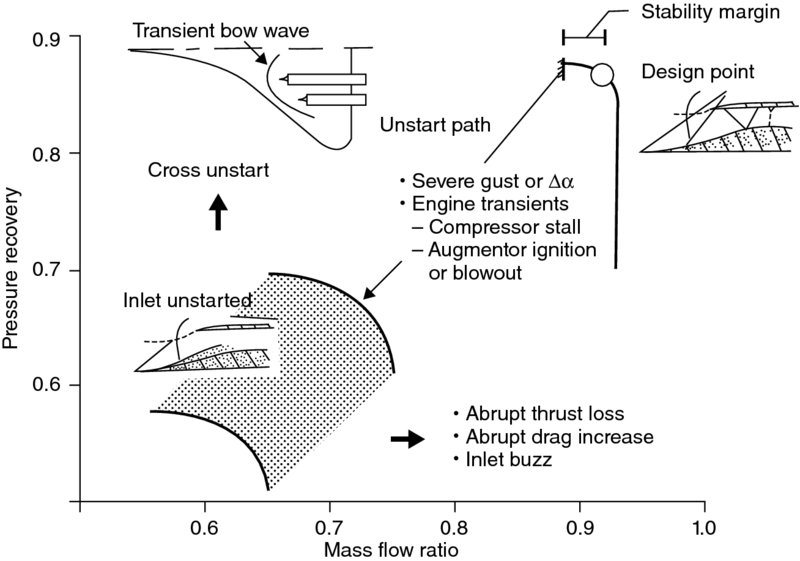
The sensitivity to flow angularity is caused by the sharp cowl and centerbody configuration of these inlets. Although supersonic design demands a sharp leading edge of the cowl, wing, and so on, the low-speed operation is hampered by flow separation off of sharp corners/edges. Hence, articulating cowl, movable lip, cowl slot, spike bleed, and other boundary layer control techniques must be used to overcome the inherently poor low-speed characteristics of these inlets. Figure 6.47 shows the performance plot of a mixed-compression inlet (from Strack, 1987).
FIGURE 6.47Performance plot of a mixed-compression inlet. Source: Strack 1987. Courtesy of NASA
Schweikhard and Montoya (1974) also present valuable operational information on mixed compression inlets that is recommended for further reading.
6.15 Supersonic Inlet Types and Their Performance—A Review
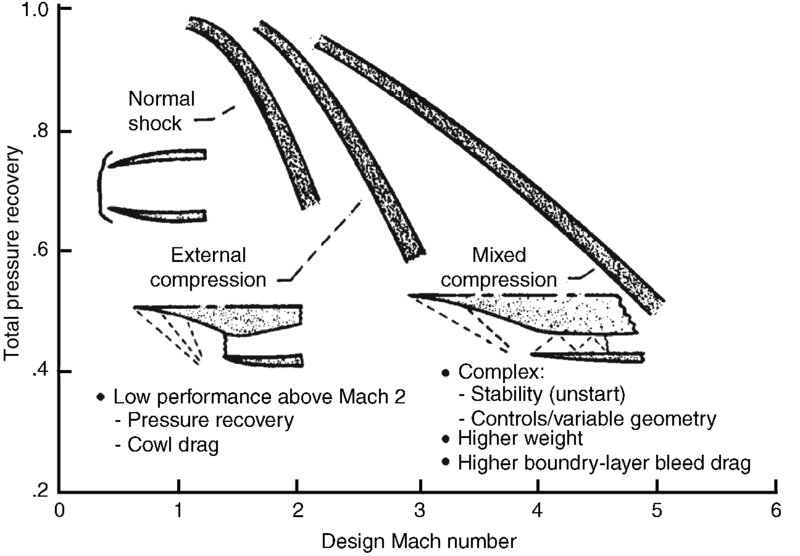
Supersonic inlets invariably involve shocks to decelerate the flow to subsonic engine face Mach numbers. For subsonic throughflow engines, as in all the existing conventional engines, the deceleration to subsonic Mach number implies the placement of a normal shock somewhere in the inlet stream. The simplest supersonic diffuser, therefore, utilizes a single normal shock to achieve the desired flow deceleration. This is a good and simple solution for low supersonic Mach numbers such as M0 ≥ 1.6. Beyond this Mach number, the normal shock deceleration becomes inefficient, as it creates excessive total pressure loss. To extend the operational Mach numbers to ∼2.5, a series of oblique shocks decelerate the flow through external compression ramps or cones prior to the normal shock appearance near the cowl lip. This type of inlet was called an external compression inlet and exhibited good internal and external flow qualities for up to M0 ∼ 2.5. The cowl wave drag was the limiting performance parameter for the external compression inlet. We also discovered that when the normal shock is pushed out onto the ramp (i.e., the subcritical mode), the potential flow separation could cause a shock/flow oscillation that was called Buzz instability. To operate without buzz or simply to widen the stability margin of external compression inlets required the boundary layer removal from the compression ramps and incorporating a throat slot for bleed purposes. To reduce the cowl wave drag at higher supersonic Mach numbers, that is, M0 > 2.5, was to invite internal shock reflections and an internal throat into our design approach. Such inlets were called mixed-compression inlets, which produced the highest overall (internal and external) performance for 2.5 < M0 < 5.0. The internal throat created another form of instability, namely, the starting and unstarting instability of the inlet. Variable geometry throat offered a practical starting approach to mixed-compression inlets. To avoid unstart meant controlling the inlet backpressure through a shock trap with a fast acting bleed valve and a bypass secondary flow control valve integrated in the subsonic diffuser. To manage the engine face distortion levels, in the face of multiple shocks inside the duct, required excessive bleeding of the boundary layer. The thrust penalty for the boundary layer bleed was the price to pay for the mixed-compression inlet. For hypersonic Mach numbers, internal compression inlets offer the lowest engine installation wave drag. In addition, flow deceleration through multiple shocks and their reflections inside a duct is preferred over fewer shock decelerations. However, the normal shock could be eliminated altogether if the engine design allowed for supersonic throughflow. A supersonic throughflow fan and a supersonic combustion ramjet (scramjet) are examples of this kind of modern thinking in hypersonic propulsion. The performance plot of the first three supersonic inlets, as a function of flight Mach number, is shown in Figure 6.48 (from Strack, 1987).
FIGURE 6.48Performance of supersonic inlets with flight Mach number.
Source: Strack 1987. Courtesy of NASA
6.16 Standards for Supersonic Inlet Recovery
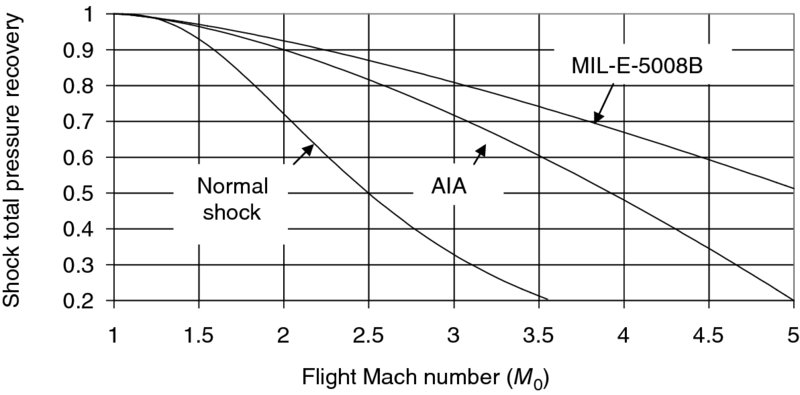
Here, we introduce two standard recoveries in existence today, one according to Aircraft Industries Association (AIA) and the second one due to the Department of Defense, known as the MIL-E-5008B standard. These standards that address the shock recovery of supersonic inlets are
(6.34)
(6.35)
(6.36)
Now, let us graph the standard recoveries and compare them to a normal shock inlet (Figure 6.49).
FIGURE 6.49Standards of inlet recovery compared to a normal shock inlet
In Figure 6.49, we intentionally stop at Mach 5, as we approach the hypersonic regime. The AIA standard is seen to be rather conservative, as compared with the MIL-E-5008B standard. The normal shock recovery, as noted earlier, loses its attractiveness around Mach 1.6. It is interesting to note that these standards date back to 1950s! With the development of smart structures and advanced flow control techniques of today, the MIL-E-5008B is deemed to be a conservative standard as well. These inlet recovery standards are reproduced here for reference and historical perspective.
Further readings on supersonic inlets and aircraft integration (references 19, 32 and 35) are recommended.
6.17 Exhaust Nozzle
A modern aircraft exhaust system is tasked with the following design objectives:
Efficient expansion of the engine gases to ambient pressure
Low installation drag
Low noise
Low cooling requirements
Efficient thrust reversing capability
Efficient thrust vectoring capability
Low observables (radar, thermal, IR signature)
Light weight system
Low-cost manufacturing
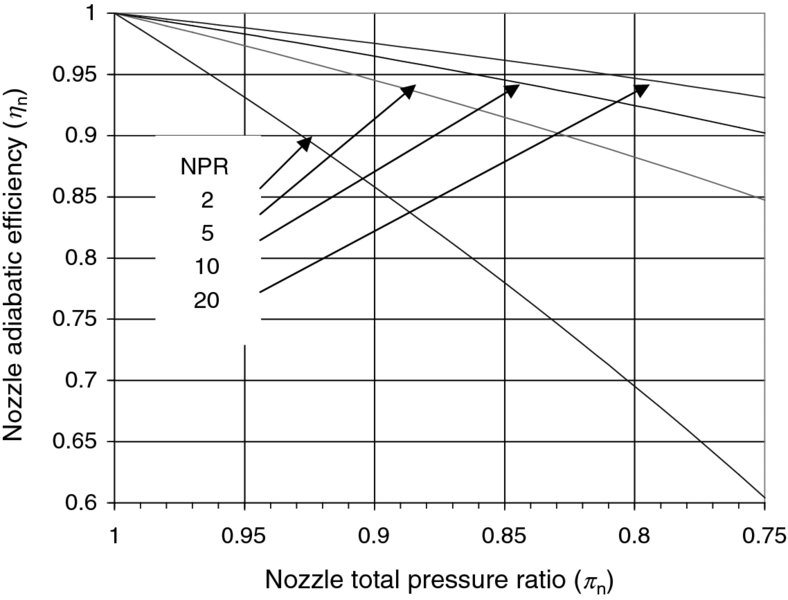
In this section, we address the parameters that influence the above design goals in a realistic nozzle. First, we review nozzle performance parameters/figures of merit that we learned in our one-dimensional cycle analysis, such as gross thrust, nozzle adiabatic efficiency, and nozzle total pressure ratio. Specialized topics in nozzle cooling, thrust reversing and thrust vectoring, hypersonic nozzles, and exhaust mixers are also presented.
6.18 Gross Thrust
The nozzle contribution to engine thrust is called gross thrust. It comprises two terms, namely, the momentum thrust and the pressure thrust, as we discussed in Chapters 3and 4.
(6.37)
The first term on the RHS represents the momentum thrust and the second term is the pressure thrust. The gross thrust of a nozzle is maximized when it is operated as fully expanded. A nozzle is fully expanded when the static pressure in the exhaust plane and the ambient static pressure are the same, that is, p9 = p0. As we learned earlier, all subsonic jets are perfectly expanded. In choked convergent nozzles as well as supersonic and hypersonic nozzles, the exit static pressure may be different than the ambient pressure. These are referred to as the under- or overexpanded nozzles.
6.19 Nozzle Adiabatic Efficiency
The ratio of actual kinetic energy at the nozzle exit to the ideal kinetic energy that emerges from an isentropic expansion in the nozzle is defined as the nozzle adiabatic (or isentropic) efficiency, that is
(6.38)
The fraction of the gas thermal energy that is not converted into directed kinetic energy at the exit plane of the nozzle is dissipated into heat in the boundary layers and across shocks. Thus, actual exhaust gas has a higher exit static temperature than the exhaust gas emerging from an isentropic nozzle, that is, T9 > T9s. These behaviors are best described using a T–s diagram (Figure 6.50).
FIGURE 6.50Adiabatic expansion process in a nozzle with loss
6.20 Nozzle Total Pressure Ratio
We have identified nozzle total pressure ratio πn as a figure of merit. Its definition is
(6.39)
This parameter is a direct measure of flow irreversibility, that is, due to friction and shock, in the nozzle. Recall that the nondimensional entropy rise in an adiabatic process is negative natural logarithm of total pressure ratio, namely,
(6.40)
6.21 Nozzle Pressure Ratio (NPR) and Critical Nozzle Pressure Ratio (NPRcrit.)
An important operational parameter of a nozzle is the NPR. It is defined as
(6.41)
This parameter signifies the nozzle flow expansion potential (i.e., from the stagnation or total state at 7 to the ambient static state at 0). Since p0 is the ambient pressure, nozzle pressure ratio is a strong function of altitude, demanding higher area expansion ratios of the nozzle with altitude (hence, a variable geometry). The choice of a convergent or a convergent–divergent nozzle can also be guided based on the magnitude of this parameter, that is, the nozzle pressure ratio.
A critical nozzle pressure ratio leads to a sonic throat with p9 = p8 = p0 for a convergent nozzle. It may be thought of as the minimum nozzle pressure ratio that chokes an expanding nozzle. We may write
By introducing a total pressure loss from nozzle inlet to the throat, we may recast Equation 6.42 as
(6.43)
where πcn is the convergent nozzle total pressure ratio. Now, let us graph this equation for different gas temperature/composition and loss parameter in Figure 6.51a (shown for a convergent nozzle).
FIGURE 6.51Critical nozzle pressure ratio for different gas temperature/composition and internal total pressure loss parameter (a Rule of Thumb is that the critical nozzle pressure ratio is ∼2)
A convergent nozzle that operates with a higher pressure ratio than the critical will still have an exit Mach number of 1, except the static pressure in the exit plane, p9, will be higher than the ambient static pressure p0. To relieve the high pressure in the jet at the exit plane, centered expansion waves at the nozzle exit cause a flow deflection with subsequent shock wave formations. The exhaust flowfield of a convergent nozzle that operates with NPR > NPRcrit is schematically shown in Figure 6.52.
FIGURE 6.52An underexpanded convergent nozzle with a periodic shock cell in its exhaust plume
6.22 Relation Between Nozzle Figures of Merit, ηn and πn
The two figures of merit for an adiabatic nozzle flow, hn and pn, are related to each other, via
FIGURE 6.53Exhaust nozzle figures of merit for a perfectly-expanded nozzle with γ = 1.30
We note that the nozzle adiabatic efficiency improves with the nozzle pressure ratio, as expected. Furthermore, the nozzle adiabatic efficiency is diminished with a decreasing nozzle total pressure ratio, as shown in Figure 6.53. With no loss of total pressure in the nozzle (i.e., πn = 1), the adiabatic efficiency is 100%.
6.23 A Convergent Nozzle or a De Laval?
When do we choose a convergent–divergent nozzle with its added weight and complexity over a simple, lightweight convergent nozzle? To answer this question, we need to assess the gross thrust performance gain of a De Laval nozzle over a convergent nozzle at a given nozzle pressure ratio. Alternatively, we need to assess the gross thrust penalty of a convergent nozzle operating in an underexpanded mode. Assuming an adiabatic and reversible, that is, isentropic, expansion process in the convergent–divergent nozzle, we can write
The gross thrust of a perfectly expanded convergent–divergent nozzle is
(6.46)
A convergent nozzle will produce a choked exit flow with M9 = 1 for all nozzle pressure ratios beyond the critical (i.e., NPR of roughly ∼2). Therefore,
We may express the static pressure ratio in terms of the nozzle pressure ratio and exit Mach number, that is 1 (note that for a convergent nozzle stations 8 and 9 coincide, i.e., throat is at the exit).
The exit velocity V9 may be written in terms of total and static enthalpy according to
(6.49)
Now, taking the ratio of the gross thrust developed by a perfectly expanded De Laval nozzle and the gross thrust produced by a convergent nozzle that is under-expanded, we have
The two parameters that affect the ratio of gross thrusts in Equation 6.50 are the nozzle pressure ratio and the gas ratio of specific heats γ. We have plotted this equation in Figure 6.54 where we note that a ∼5% gross thrust gain is achieved by a De Laval nozzle over a simple convergent nozzle at nozzle pressure ratios of ∼6. In the case of a hot exhaust gas, that is γ ∼ 1.30, we observe that the 5% gain in nozzle thrust is achieved at a lower NPR, namely, 5.5. Hence, we may conclude that for a nozzle pressure ratio >5.5, it pays (through a gross thrust enhancement of at least 5%) to choose a convergent–divergent nozzle over a convergent nozzle.
FIGURE 6.54Thrust producing capability of an ideal convergent–divergent nozzle in comparison to a convergent nozzle
Our discussion of exhaust nozzle performance to this point was based on one-dimensional flow analysis. Now, we are ready to address the influence of multidimension-ality of real fluid environments, such as the influence of fluid viscosity through boundary layer formation and the influence of nonaxial exit flow on nozzle gross thrust.
6.24 The Effect of Boundary Layer Formation on Nozzle Internal Performance
The presence of a boundary layer on a surface represents a displacement thickness δ*, which act sasa blockage of the geometric flow area. There is also a total pressure loss associated with the boundary layer formation on the wall, namely, pt8/pt7 < 1. The combined effect of these parameters on the mass flow rate is represented through a discharge coefficient CD8 as
(6.51)
where the numerator is the actual mass flow rate through the nozzle throat and the denominator is the ideal mass flow rate based on geometrical throat area.
6.25 Nozzle Exit Flow Velocity Coefficient
We may define a velocity coefficient that measures the extent of viscous flow losses in the exhaust plane, that is, let us define CV as
(6.52)
where the numerator is the actual exhaust velocity and the denominator is the ideal exhaust velocity with no loss of total pressure pt9 = pt8. Therefore, V9i is the ideal exit velocity only if the divergent section of the nozzle were isentropic. Earlier in the definition of the nozzle adiabatic efficiency, we defined a V9i that was achieved if the entire nozzle were isentropic.
A definition sketch of the three different exhaust velocities, V9, V9s, and V9i, is very helpful at this point and is shown in Figure 6.55.
FIGURE 6.55Definition sketch of the states of gas defined in an exhaust nozzle
After some manipulation, we may show the following expression for the velocity coefficient:
(6.53)
6.26 Effect of Flow Angularity on Gross Thrust
For all nozzle geometries other than a bell-shaped nozzle, the exhaust velocity field, that is, exit momentum, is nonaxial and hence it does not entirely contribute to an axial thrust. Let us examine a conical nozzle first for simplicity. The flow that emerges from a conical nozzle is a divergent jet flow, as shown in Figure 6.56. Due to its radial velocity pattern, the jet flow may be seen as that of emerging from a virtual origin, somewhat like a source flow where the velocity is constant at r = constant. In this case at r = R, V = V9, therefore V = V9 over a spherical dome or cap.
FIGURE 6.56Working sketch used to derive flow angularity loss (or divergence correction factor) for a conical nozzle of half angle α in attached exit flow
We define an angularity loss coefficient as the ratio of axial (momentum) thrust to the momentum thrust of an equivalent bell-shaped nozzle:
(6.54)
where CA is
(6.55)
For the element of mass flow rate , we take the exit surface to be spherical in shape, such that the velocity vector V9 is normal to it. The element of area on the dome is
(6.56)
Hence, the element of mass flow rate at the nozzle exit is
(6.57)
We integrate this equation to get the entire mass flow rate from the nozzle, namely,
(6.58)
Now, let us evaluate the axial momentum thrust, as
(6.59)
Substitute the axial momentum expression in the definition of the flow angularity or the divergence correction factor, to get
For a two-dimensional convergent–divergent nozzle, we can derive the angularity loss factor, in a straight forward manner, using the definition sketch, Figure 6.58, as a tool.
FIGURE 6.57Flow angularity loss coefficient for a conical nozzle
FIGURE 6.58Definition sketch for divergence loss factor in a 2D-CD nozzle
We take the element of area at the exit to be a cylindrical surface normal to exit flow, that is
(6.61)
Therefore, the element of mass flow rate at the nozzle exit is
(6.62)
The total mass flow rate is the integral of elemental mass flow rate, that is
Now, let us put this complex looking equation into perspective. An imperfect expansion in the nozzle where p9 ≠ p0 leads to a pressure thrust term, which is essentially the last term in the bracket. The momentum thrust is affected by total pressure losses and flow angularity at the exit, which is the first term of the bracket. These losses are seen as CD8, CV, and CA distributed throughout the nozzle, as shown in Figure 6.61.
FIGURE 6.61Convergent–divergent nozzle with the primary, secondary, and exit flow, each identified with a loss parameter, CD8, CV, and CA, respectively

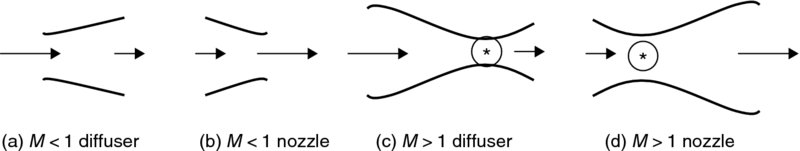
 FIGURE 6.1 Geometric requirements for inlets and nozzles (* represents the sonic throat)