
Chapter 3
Points
In the previous chapter, “Survey,” you looked at a specific method for bringing in points and figures by the means of survey databases. In this chapter, you will take a closer look at the multiple ways of creating, modifying, and managing Autodesk® AutoCAD® Civil 3D® points.
Most commonly, Civil 3D points are used to identify the location of existing features, such as trees and property corners; topography, such as ground shots; or stakeout information, such as road geometry points. However, their use is not limited to the data specified here. This chapter will both focus on traditional point uses and introduce ideas to apply the dynamic power of point editing, labeling, and grouping to other applications.
In this chapter, you will learn to
- Import points from a text file using description key matching
- Create a point group
- Export points to LandXML and ASCII format
- Create a point table
Anatomy of a Point
Civil 3D points (see Figure 3.1) are intelligent objects that represent x, y, and z locations in space. Each point has a unique number and, optionally, a unique name that can be used for additional identification and labeling.
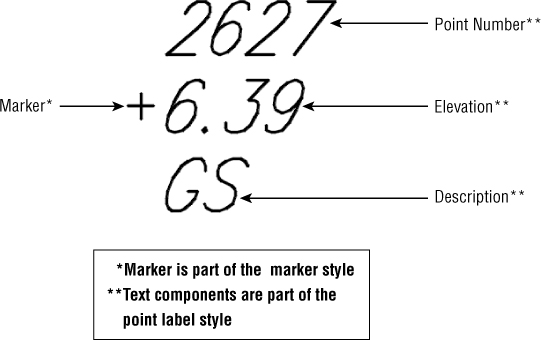
Figure 3.1 A typical point object showing a marker, a point number, an elevation, and a description
Each Civil 3D point is represented graphically using two components: a marker and a label. Even though we will focus on the styles to display these components in Chapter 18, “Label Styles,” and Chapter 19, “Object Styles,” we will discuss the basics of these items here. Most of the users are familiar with the representation of the marker as an + and the label in the form of number, elevation, and description, as shown in Figure 3.1. The marker's representation is defined by an object marker style, while the label is defined by a label style. Note that even if the Civil 3D point object resides on a specified layer, its marker and label can reside on different layers based on the settings defined for those styles. Because of this, a well-defined set of styles in the definition of your template is vital to a functional and productive environment.
COGO Points vs. Survey Points
In Chapter 2, “Survey,” you imported survey data that contained points. Points brought in through the methods described in Chapter 2 are referred to as survey points. In this chapter, you will import points from a delimited text file and place them in the drawing using the point-creation tools. Points created in this manner are referred to as COGO points. Figure 3.2 shows the contextual tab differences between points brought in as COGO points (top) and points brought in through a survey database (bottom).
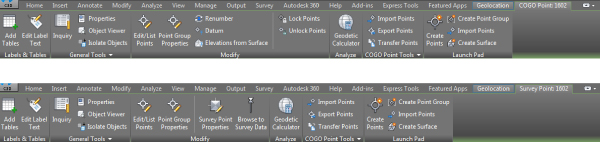
Figure 3.2 The context-sensitive ribbon reflects similarities and differences between COGO points (top) and survey points (bottom).
The differences between COGO points and survey points are subtle but important to note. The definition and graphical representation of a COGO point are stored in the drawing. For this reason its definition can be easily altered at any time, either through its Properties Toolspace or through the tabular view used in Panorama. On the other hand, a survey point has its definition stored within a survey database and its graphical representation stored in the drawing. In order to change its definition, you need to be able to access its survey database and have the rights to write changes to it. Because of these controls and the legal implications that arise from unwanted changes to the topographic data, the use of survey points and databases is becoming more prevalent in today's market. Since these points are managed by the survey database, the place to manage any changes to their definition is within the Survey tab of Toolspace. Regardless of their origin, both COGO points and survey points obey the principles outlined in this chapter.
Creating Basic Points
![]() You can create points in many ways using the Points menu in the Create Ground Data panel on the Home tab of the ribbon. Points can also be imported from text files or external databases or converted from AutoCAD points or other legacy point types.
You can create points in many ways using the Points menu in the Create Ground Data panel on the Home tab of the ribbon. Points can also be imported from text files or external databases or converted from AutoCAD points or other legacy point types.
Point Settings
When we talk about point settings we're actually referring to what is known as command settings for points. We provided a quick introduction to command settings in the first chapter, so you know that all the settings that define the creation of Civil 3D objects are available as command settings in the Settings tab of Toolspace. As we discuss the creation and management of Civil 3D points, it is recommended to have the previously mentioned settings readily available for on-the-fly modifications. Whether or not the changes you make on the fly are remembered the next time you create points depends on your template settings.
To make sure that the settings you change hold every time you create points, follow these steps:
- On the Settings tab of Toolspace, locate the Point collection and click the plus sign to expand the branch.
- Click the plus sign to expand Commands.
- As shown in the first screen in Figure 3.3, right-click the command CreatePoints and select Edit Command Settings.
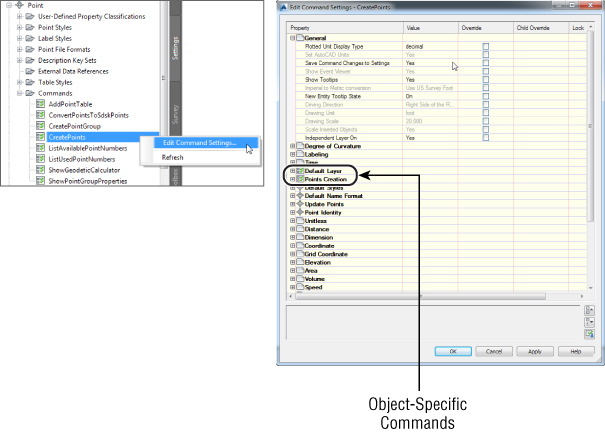
Figure 3.3 In your Civil 3D template, make sure Save Command Changes To Settings is set to Yes for Points.
- Expand the General section and verify that Save Command Changes To Settings is set to Yes. You will notice that this change affects only the CreatePoints command. If you want to save the settings at the Point collection level for all the commands related to point creation, you will do that from the Edit Feature Settings option that can be selected when you right-click the Point collection.
By setting the Save Command Changes To Settings option to Yes, you are ensuring that changes you make on the CreatePoints toolbar will be saved for the next time you use the command. If you explore the command settings further, you will see the options Default Layer and Points Creation. You will notice that these commands are represented with a different icon from the other settings. This is because these are object-specific command settings defined at the object level, while the others are defined as part of the overall drawing level within the Ambient Settings tab of the Drawing Settings. You will find a defined subset of the options available within the command settings in the Create Points toolbar.
To access the Create Points toolbar, follow these steps:
- Go to the Home tab of the ribbon.
- In the Create Ground Data panel, select Points
 Point Creation Tools.
 - Expand the toolbar by clicking the chevron button on the far-right side (Figure 3.4).
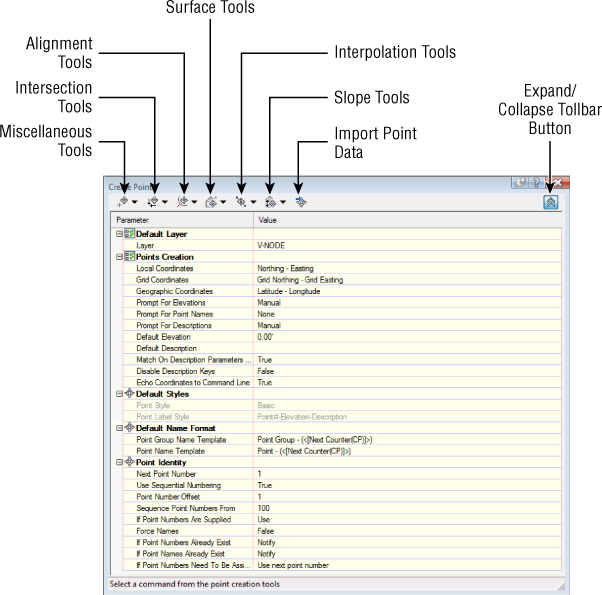
Figure 3.4 Overview of the Create Points toolbar
Default Layer
For most Civil 3D objects, the object layer is established in the drawing settings. In the case of points, the layer depends on whether or not it matches a description key when a description key set is present in the drawing or the point's creation command settings when a default layer is defined. When a description key set is present and active in the drawing, the layer assignment set by the description key set takes precedence over the one defined as the default layer. In other words, when there is no description key set in the drawing or when the point's raw description does not match any of the keys, then the layer for the specific point will be the one set as default in the Default Layer section of the Create Points dialog (see Figure 3.5). Review Chapter 2 for more information about description key sets.
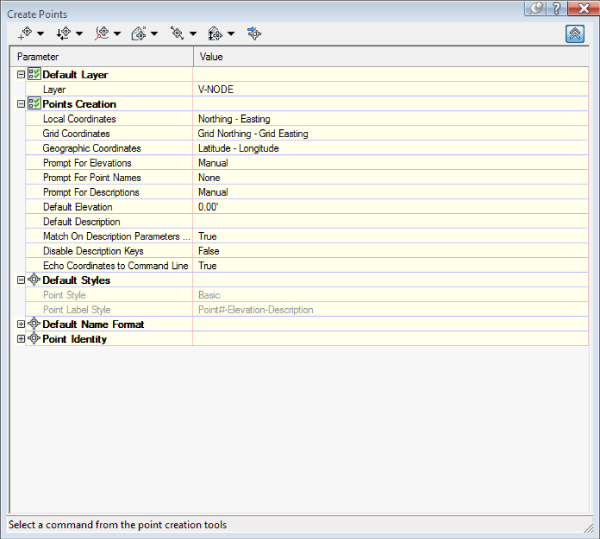
Figure 3.5 Verify the point object layer before creating points.
Points Creation and Default Styles
When creating points in your drawing, you have the option of being prompted for elevations, point names, and descriptions (see Figure 3.5). This process can be changed to take advantage of the intelligent environment of Civil 3D in the case of creating points from alignment geometry, when you can choose to have points pick up descriptions using the Automatic – Object option. Initially, the Default Description option is blank. In many cases, you'll want to leave these options set to Manual. That way, the command line will ask you to assign an elevation and description for every point you create. Even though the point names option is available, it is best to avoid using them in general (as described later in this section); therefore, leave the Prompt For Point Names option set to None.
If you're creating a batch of points that have the same description or elevation, you can change the Prompt toggle from Manual to Automatic and then provide the description and elevation in the default cells. For example, if you're setting a series of trees at an elevation of 10′, you can establish settings as shown in Figure 3.6.
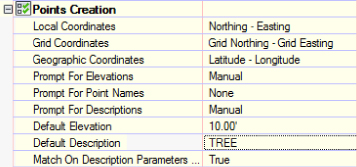
Figure 3.6 Default settings for placing tree points at an elevation of 10′
Note that these settings apply only to points created from this toolbar. The settings do not affect the elevation or description of points imported from a file.
Also note that the use of description key sets can be disabled in the creation of points, when the Disable Description Keys option is changed from the default False to True. The status of this toggle also defines the availability of options in the Default Styles section of the dialog. When the toggle is set to allow the use of key descriptors, then the Default Point and Label Style options are grayed out, since the descriptors will define those settings. But when the use of key descriptors is disabled, the default styles for points and labels can be customized. However, the default styles used in the creation of points can be changed even with the description keys enabled. You will learn more about this in Chapter 18 and Chapter 19.
Default Name Format and Point Identity
The Default Name Format section is where you can define the macros that manage the naming of the point groups and point names when these are created. You will learn about point groups and point names in the following sections. The Point Identity section is where you can define the settings used in the numbering of the point data both when it's created in the drawing by using the creation tools and when it is imported from outside sources. For example, here you have the option to define the starting number used, whether to use sequential numbering, and what offset should be used in the numbering. Also among these options you will find the settings that define the way to resolve conflicts in the numbering. You will usually run into these kinds of conflicts in the case of point data imported from outside sources that has point numbers that match existing points. In that case you have the option to define how the software should proceed when one of these conflicts arises.
Importing Points from a Text File
![]() One of the most common means of creating points in your drawing is to import an external text file (see Figure 3.7). The Import Points tool can be accessed either from the Create Points toolbar or from the Import Panel of the Insert tab on the ribbon.
One of the most common means of creating points in your drawing is to import an external text file (see Figure 3.7). The Import Points tool can be accessed either from the Create Points toolbar or from the Import Panel of the Insert tab on the ribbon.
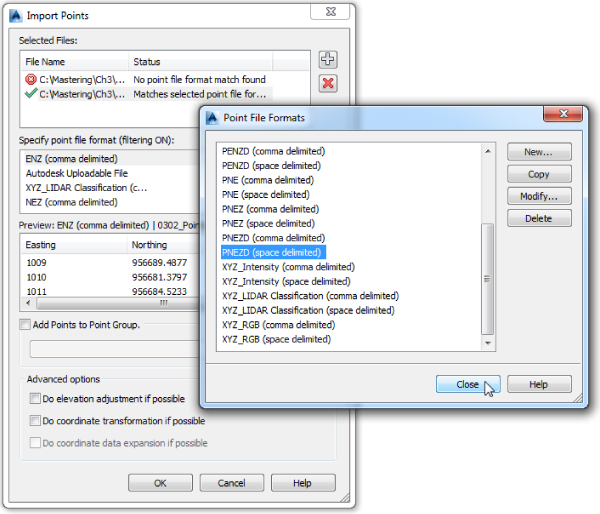
Figure 3.7 The Import Points and Point File Formats dialogs
![]() To add a file to your Import Points dialog, click the white plus sign to browse. You can add multiple files at once if they are in the same point format—such as a comma-delimited point number, northing, easting, elevation, description (i.e., PNEZD). The import process supports most text formats as well as Microsoft Access database (MDB) files. Later in this chapter, you will experience adding your own text format.
To add a file to your Import Points dialog, click the white plus sign to browse. You can add multiple files at once if they are in the same point format—such as a comma-delimited point number, northing, easting, elevation, description (i.e., PNEZD). The import process supports most text formats as well as Microsoft Access database (MDB) files. Later in this chapter, you will experience adding your own text format.
When your file is listed in the top of the dialog, a green check mark indicates that Civil 3D can parse the information. Be careful, though, because Civil 3D does not know the difference between a northing and an easting or a point number and an elevation. You still need to select the correct file format. When the format of the imported data does not match any of the present formats, a red mark will be displayed, and you will not be able to proceed without defining a custom import format that matches the layout of the data, as shown in Figure 3.7.
![]() The file format filter is available to help you. Civil 3D recognizes how the file is delimited (i.e., tab, comma, space) and shows you only the formats that apply. If you don't want the help, you can turn the filtering off by clicking the Filter icon. This will give you access to the full list of formats defined in the drawing.
The file format filter is available to help you. Civil 3D recognizes how the file is delimited (i.e., tab, comma, space) and shows you only the formats that apply. If you don't want the help, you can turn the filtering off by clicking the Filter icon. This will give you access to the full list of formats defined in the drawing.
Custom Point File Formats and Advanced Options
![]() If the file format you need is not available or you wish to use the adjustment and transformation capabilities, you can do so by clicking the Manage Formats button. Many types of data are available for adding to a point format, including LIDAR classification and various latitude-longitude types.
If the file format you need is not available or you wish to use the adjustment and transformation capabilities, you can do so by clicking the Manage Formats button. Many types of data are available for adding to a point format, including LIDAR classification and various latitude-longitude types.
As you can see in Figure 3.7 (shown previously), advanced options are available at the bottom of the Import Points dialog.
- Do Elevation Adjustment If Possible
- Do Coordinate Transformation If Possible
- Do Coordinate Data Expansion If Possible
These options will not affect your points unless the point file format has adjustment, transformation, or expansion built into it.
You can make an elevation adjustment if the point file contains additional columns for thickness, Z+ or Z-. To get Civil 3D to recognize these extra data columns, a new point file format is needed. You can perform a coordinate system transformation if a coordinate system has been assigned both to your drawing (under the drawing settings) and as part of a custom point format. In this case, the program can also do a coordinate data expansion, which calculates the latitude and longitude for each point.
Importing a Text File of Points
In this exercise, you'll learn how to import a TXT file of points into Civil 3D:
- Open the
0302_PointImport.dwg(0302_PointImport_METRIC.dwg) file, which you can download from this book's web page. - On the Home tab Create Ground Data panel Points, select Point Creation Tools.
 On the Create Points toolbar, click the Import Points button.
- Click the white + button to the right of the Selected Files field, and navigate to locate the
0302_Points.txt(0302_Points_METRIC.txt) file. - Select the file and click Open.
- In the Specify Point File Format field, set the format to PNEZD (Comma Delimited).
 Place a check mark in the box next to Add Points To Point Group and click the Create Point Group icon. Name the point group Mastering Survey Data and click OK.
- Leave the boxes under Advanced Options unchecked.
- Click OK.
You may have to use Zoom Extents to see the imported points. (Hint: Double-click your middle mouse wheel for zooming extents.)
- Save the drawing.
To compare your work with a completed example, see 0302_PointImport_FINISHED.dwg (0302_PointImport_METRIC_FINISHED.dwg).
Converting Points from Non-Civil 3D Sources
Base AutoCAD points, Land Desktop points, and Softdesk points are types of data that Civil 3D can readily convert from within a drawing. Other types of data that can be converted to Civil 3D points are represented by blocks. To convert, blocks must minimally be defined so that the insertion point's coordinates coincides with the coordinate values of the point and have an assigned z value that defines the elevation. If a block also has the number, description, and elevation as block attributes, it is even easier to convert them to Civil 3D points. Therefore, whenever possible, your best course of action would be to request the survey in text format or LandXML that can be easily imported into Civil 3D. However, if you need to migrate a drawing that contains legacy point data, tools are available to convert that data to Civil 3D point objects.
A Land Desktop point database (the Points.mdb file found in the COGO folder in a Land Desktop project) can be directly imported into Civil 3D in the same interface in which you'd import a text file.
Land Desktop point objects, which appear as AECC_POINTs in the AutoCAD Properties palette, can also be converted to Civil 3D points via the Convert Land Desktop Points option (see Figure 3.8). Upon their conversion, this tool gives you the opportunity to assign styles, create a point group, and more.
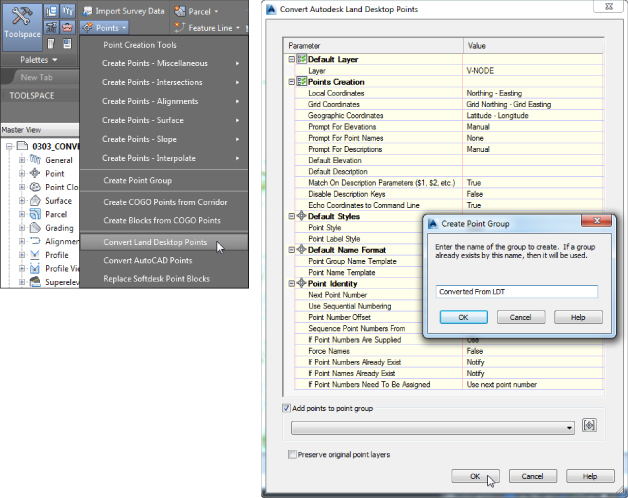
Figure 3.8 Selecting the Convert Land Desktop Points option (left) opens the Convert Autodesk Land Desktop Points dialog (right).
Converting Points
In this exercise, you'll convert Land Desktop point objects into Civil 3D points and export the data to LandXML and ASCII format files.
- Open the
0303_ConvertPoints.dwg(0303_ConvertPoints_METRIC.dwg) file, which you can download from this book's web page. - Use the List command or the AutoCAD Properties palette to confirm that most of the objects in this drawing are AECC_POINTs, which are points from Land Desktop.
- On the Home tab Create Ground Data panel Points menu, select Convert Land Desktop Points.
Note that the Convert Autodesk Land Desktop Points dialog allows you to choose point-creation settings and styles.
- Place a check mark next to Add Points To Point Group.
- Click the Create A New Point Group button.
- Name the group Converted From LDT, as shown in Figure 3.8, and click OK.
- Clear the Preserve Original Point Layers check box.
This option will move the resulting points to the layer specified in the description key set if there is a match. If there is no match, the point will go to the default layer.
- Click OK to complete the conversion process.
Civil 3D scans the drawing looking for Land Desktop point objects.
- Once Civil 3D has finished the conversion, zoom in on any of the former Land Desktop points.
The points should now show as COGO points in the AutoCAD Properties palette, confirming that the conversion has taken place. The Land Desktop points have been replaced with Civil 3D points, and the original Land Desktop points are no longer in the drawing.
- In Toolspace Prospector tab, expand the Point Groups category.
Notice that there is a yellow exclamation shield symbol indicating that the Converted From LDT point group needs to be updated.
- Right-click Point Groups and select Update.
- On update, the points will display using the defined settings.
- Select the Converted From LDT point group and right-click it. Select Export Points from the menu. Set the export format to PNEZD (Comma Delimited), define the destination file as a text file, name it
0303_ConvertPoints.txt(0303_ConvertPoints_METRIC.txt), and click Open. By default the selection of points is limited to the selected group. Clear the advanced options check marks if any are selected. Click OK. - Select the Converted From LDT point group once more, right-click it, and from the context menu select the Export LandXML option found toward the bottom of the menu. In the dialog box, by default your point group is selected to be exported. All you need to do is to click OK. You will be prompted to save the LandXML file, and the suggested name should be fine. Save the file.
- Once the export is done, save the drawing file.
To compare your work with a completed example, see 0303_ConvertPoints_FINISHED.dwg (0303_ConvertPOints_METRIC_FINISHED.dwg).
Converting Blocks
In this exercise, you'll convert blocks with data that can be extracted into Civil 3D points:
- Open the
0304_ConvertBlocks.dwg(0304_ConvertBlocks_METRIC.dwg) file, which you can download from this book's web page.Notice the point data in the form of blocks. You'll see that all of them are instances of the same block, their insertion point coincides with the origin of the field shot, they have a z value assigned to each that corresponds to the field elevation, and the attribute data assigned to each instance actually contains fields that you can use. This is the best scenario for conversion of blocks (see Figure 3.9).
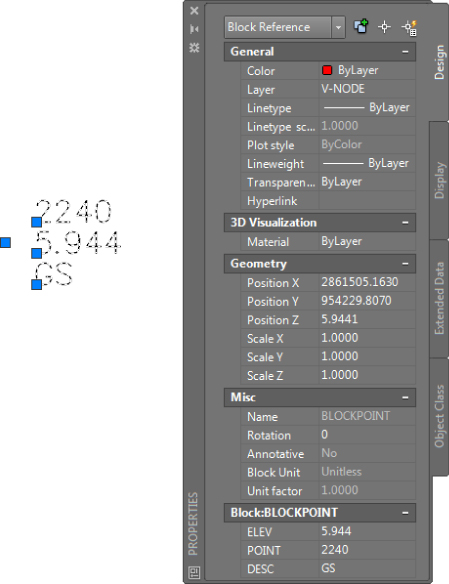
Figure 3.9 Block with data that can be extracted to a text file and reimported as a Civil 3D point
To convert the data you need to generate the text file that you can import back and create points.
- Go to the Insert tab Linking & Extraction Panel and click the Extract Data button.
- In the Data Extraction - Begin (Page 1 Of 8) dialog, select Create A New Data Extraction. Click Next. You will be prompted to save your data extraction as a new
.dxefile. Select the location and give it a proper name. Click Save to go to the next step. - In the Data Extraction - Define Data Source (Page 2 Of 8) dialog, change the selection from the default to Select Objects In The Current Drawing, and by using the selection button to the right of the option select the point blocks. Click Next.
- In the Data Extraction - Select Objects (Page 3 Of 8) dialog, clear the selection for everything but the BLOCKPOINT object. Click Next.
- In the Data Extraction - Select Properties (Page 4 Of 8) dialog, in the Category Filter area, clear the selection for everything but the Attribute and Geometry filters. Once these two filters are selected, you will have options for which properties you want to extract. In order to have a working PNEZD file, you will need to select and extract the following: POINT property for the Point Number, Position Y for the Northing, Position X for the Easting, ELEV property for Elevation, and DESC property for Description. Since the block already has a z value assigned to it, you can swap if needed the ELEV property for the Position Z, but for this exercise you will just use the ELEV property. Therefore, check the selection for the items listed here, clear the ones not in the list, and click Next.
- In the Data Extraction - Refine Data (Page 5 Of 8) dialog, clear the selections for Show Count Column and Show Name Column. You will be left with the five known columns for a PNEZD file, which you will need to rearrange to meet your point format requirement. Select the column headers and drag them into this order from left to right: POINT, Position Y, Position X, ELEV, and DESC. Click Next.
- In the Data Extraction - Choose Output (Page 6 Of 8) dialog, select to output data to an external file. When you see the file path and file type the data will be saved into, click the ellipsis button to select a new path. Select where you want to save, the name for the file, and choose
.xlsfrom the Files Of Type drop-down menu. Click Save to exit the dialog and Next to advance to the next step.Clicking Next will take you to Page 8. In this particular workflow, you will not see Page 7.
- In the Data Extraction - Finish (Page 8 Of 8) dialog, click the Finish button to end the extraction process.
- Open the file in Microsoft Excel and delete the first row, which contains the header cells. Save the modified file as CSV (Comma Delimited) by browsing to a location of your choice, assigning a name to the file, and disregarding the Excel warning regarding the loss of functionality when saving to CSV. The dialog box might provide you with different warnings based on what version of the Office suite you have.
- In Civil 3D, use the Import Points option from the Creation Points toolbar, choose PNEZD (Comma Delimited) as the format for points, and select the created CSV file as the source for the data. Add the points to a point group. A point group called Mastering Survey Data is already in the drawing, so you can use that as the point group for the insertion of this data.
- Once the import is complete, the points will be created in the drawing and you can safely delete the source blocks or change their layer if you still want to keep them in the drawing.
- The Extraction file (
.dxe) can be used for future extractions that match the settings for your non-Civil 3D data. - Save the drawing.
To compare your work with a completed example, see 0304_ConvertBlocks_FINISHED.dwg (0304_ConvertBlocks_METRIC_FINISHED.dwg).
A Closer Look at the Create Points Toolbar
![]() In Civil 3D 2015, you can find point-creation tools directly under the Home tab
In Civil 3D 2015, you can find point-creation tools directly under the Home tab ![]() Create Ground Data Panel
Create Ground Data Panel ![]() Points drop-down as well as in the Create Points toolbar. The toolbar is modeless, which means it stays on your screen even when you switch between tasks. If you go back to Figure 3.4, you'll see the available point-creation methods.
Points drop-down as well as in the Create Points toolbar. The toolbar is modeless, which means it stays on your screen even when you switch between tasks. If you go back to Figure 3.4, you'll see the available point-creation methods.
As you place points using these tools, a few general rules apply to all of them. If you place a point on an object with elevation, the point will automatically inherit the elevation of the object. If you use the surface options, the point will automatically inherit the elevation of the surface you choose.
- Miscellaneous Point-Creation Options The options in the Miscellaneous category allow you to create a point by manually specifying its location on screen or relative to existing basic objects in the drawing. Also within this category are the options to convert data from AutoCAD points or Softdesk point blocks (see Figure 3.10).
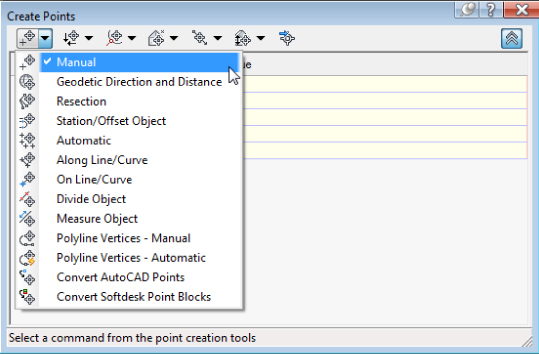
Figure 3.10 Miscellaneous point-creation options
- Intersection Point-Creation Options The options in this category allow you to place points based on the calculated intersection of specific items without defining construction lines. For example, if you needed a point at the intersection of two bearings, you could draw two construction lines using the Bearing Distance transparent command, manually place a point where they intersect, and then erase the construction lines. By using the tools within this category, you could use the Direction/Direction tool to accomplish the same without using construction lines (see Figure 3.11).
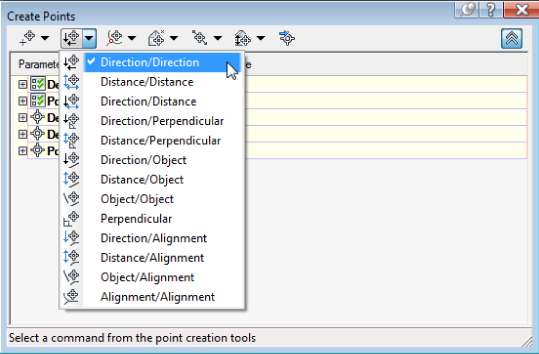
Figure 3.11 Intersection point-creation options
- Alignment Point-Creation Options The options in the Alignment category are designed for creating stakeout points based on a road centerline or other alignments. You can also set profile geometry points along the alignment using a tool from this menu. See Figure 3.12.
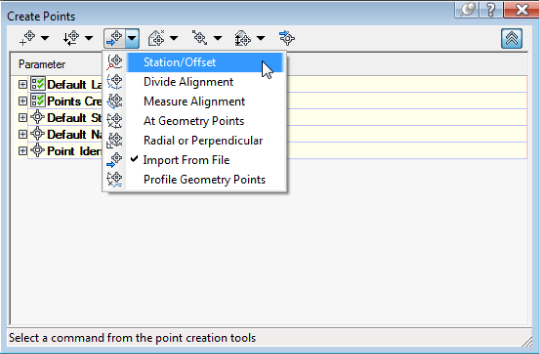
Figure 3.12 Alignment point-creation options
- Surface Point-Creation Options The options in the Surface category let you set points that harvest their elevation data from a surface. Note that these are points, not labels, and therefore aren't dynamic to the surface. You can set points manually, along a contour or a polyline, or in a grid (see Figure 3.13).
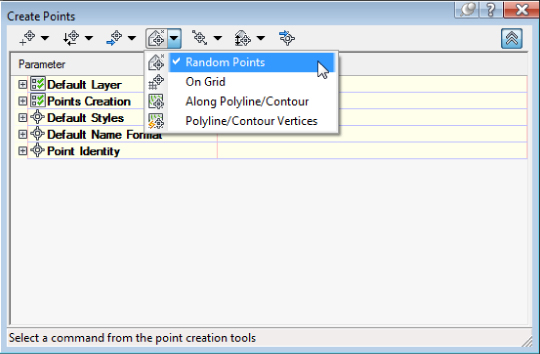
Figure 3.13 Surface point-creation options
- Interpolation Point-Creation Options The Interpolation category lets you fill in missing information from survey data or establish intermediate points for your design tasks. For example, suppose your survey crew picked up centerline road shots every 100′ (30 m) and you'd like to interpolate intermediate points every 25′ (8 m). Instead of doing a manual slope calculation, you could use the Incremental Distance tool to create additional points (see Figure 3.14).
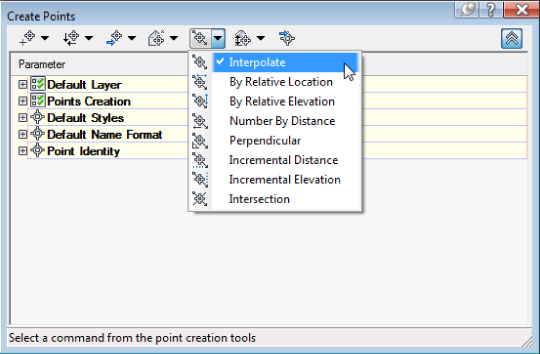
Figure 3.14 The Interpolation point-creation options
- Another use would be to set intermediate points along a pipe stakeout. You could set points for the starting and ending inverts and then set intermediate points along the pipe to assist the field crew.
- Slope Point-Creation Options The Slope category allows you to set points between two known elevations by setting a slope or grade. Similar to the options in the Interpolation and Intersection categories, these tools save you time by eliminating construction geometry and hand calculations (see Figure 3.15).
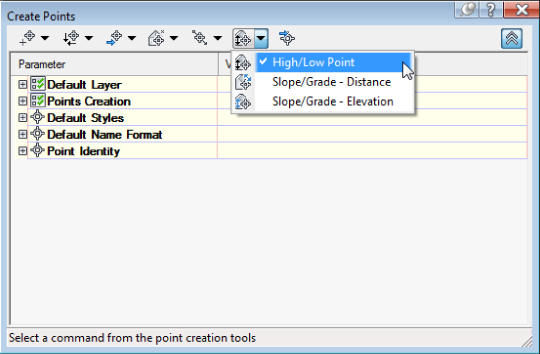
Figure 3.15 Slope point-: creation options
Creating Points
In this exercise, you'll learn how to create points along a parcel segment and along a surface contour:
- Open
0305_PointCreation.dwg(0305_PointCreation_METRIC.dwg), which you can download from this book's web page.Note that the drawing includes alignments, a series of parcels, and an existing ground surface.
- On the Home tab Create Ground Data panel Points menu, click Point Creation Tools.
- If it is not already expanded, click the chevron icon on the right to expand the dialog.
- Expand the Points Creation category.
- Change the Prompt For Elevations value to None and the Prompt For Descriptions value to Automatic by clicking in the respective cell in the Value column, clicking the down arrow, and selecting the appropriate option.
- Enter LOT for Default Description (see Figure 3.16).
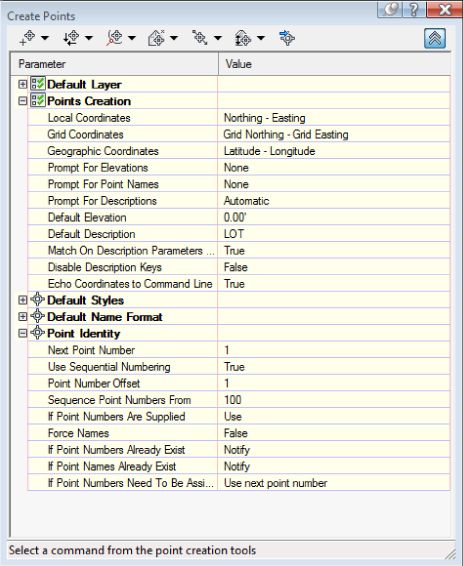
Figure 3.16 Point-creation settings in the Create Points dialog
This will save you from having to enter a description and elevation each time. Because you're setting stakeout points for rear lot corners, you will disregard elevation for now.
 Select the Automatic tool from the Miscellaneous flyout (the first button flyout on the top left of the Create Points toolbar).
- Focusing on the area at end of the cul-de-sac you will find the parcel named BCG_Lots : 1. Select that parcel by selecting one of its segments. Press ↵.
- Press Esc to exit the command.
A point is placed at each property corner and at the endpoints of each curve. Even if the marker is visible you will not see the point label. The reason is that since there is no description key within the set to manage the LOT key, the point's labeling is managed by the settings of the point group it belongs to. It belongs to the only point group defined in the drawing, the default _All Points, which has by default the labeling for its points set to <none>.
- Right-click the _All Points group within the Point Groups collection in the Prospector tab of Toolspace and choose Properties, as shown in Figure 3.17. Then choose Description Only from the Point Label Style drop-down on the Information tab of the Points Group Properties - _All Points dialog. Click OK to exit the dialog.
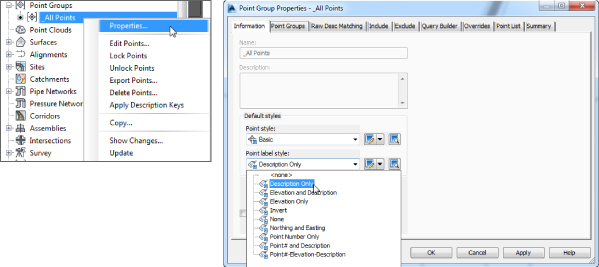
Figure 3.17 To assign a label style to the _All Points group, access its properties (left) and assign the desired style (right).
 Select the Measure Object tool from the Miscellaneous flyout.
- Click anywhere on the parcel boundary for BCG_Lots : 29.
After you select the parcel boundary for BCG_Lots : 29, this tool prompts you for starting and ending stations.
- Press ↵ twice to accept the default starting and ending stationing and again to accept the default of 0 for the offset.
- At the Interval prompt, enter 25 if you are working in feet and 10 if you are working in metric units. Press Enter to continue.
- Press Esc to exit the command.
A point is placed at 25′ (10 m) intervals along the property boundary.
Next, you'll experiment with the Direction/Direction option from the Intersection Point flyout. Be sure your Endpoint Osnap is on for the next steps.
 Let's focus now on BCG_Lots : 33. Click the Direction/Direction icon and click the northwest endpoint of the parcel line that this property shares with BCG_Lots : 1.
- Click the opposite endpoint of the segment that the two of them share to establish the direction of the line.
The yellow arrow that appears indicates the direction.
- Press ↵ to specify the default of 0 for the offset.
- Click the southeast corner of BCG_Lots : 33 on the property line that this property shares with BCG_Lots : 34 and then click the endpoint of the same property line to establish the second direction.
- Press ↵ to specify a zero offset.
A point is generated where the two lines would intersect if they were to be extended. Press Esc to exit the command.
- In the point-creation settings, change Prompt For Descriptions to Automatic – Object.
 From the Alignments flyout, choose At Geometry Points.
- When prompted for an alignment, select the green centerline alignment, ROAD G.
You are now prompted for a profile.
- Select FG-ROAD G from the drop-down and click OK.
- Press ↵ twice to confirm the starting and ending station values along the alignment.
- Press Esc to exit the command.
You should now see points whose names are based on alignment information.
- Return to the Point Settings category and change Prompt For Elevations to Manual and Default Description to EG.
The next round of points you'll set will be based on the existing ground elevation.
 Select the Along Polyline/Contour tool in the Surface flyout.
- When prompted with
Distance between points<10.0000>, key in 9 for feet (3 for meters) and press Enter to continue. - Click the magenta polyline inside BCG_Lots : 1. Notice that the points will be created, but their label style will not use the default of the _All Points group. You will know why if you look at the description key for the EG code.
- Press Esc to exit the command, close the Create Points toolbar, save the drawing, and keep it open for the next exercise.
You can go ahead and experiment with the variety of point-creation tools available.
Basic Point Editing
Despite your best efforts, the point data will often be placed in the wrong location or need additional editing to bring it to the desired status. For example, points may need to be rotated as a group to match a different horizontal datum or may need to be raised or lowered to match a different benchmark.
Graphic Point Edits
Points can be moved, copied, rotated, deleted, and more using standard AutoCAD commands and grip edits. When you pause your cursor over a grip, a special grip menu will appear with different options. Figure 3.18 (left) shows the grip menu options for the label. Figure 3.18 (right) shows the options available directly on the point. Using the options shown here, you can move the point and rotate it independently of the text and rotate the text label independently of the marker.
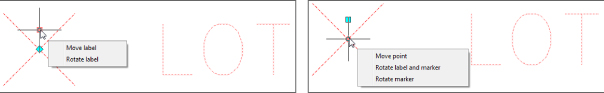
Figure 3.18 The top grip allows label modifications (left); the center grip allows marker modifications (right).
Panorama and Prospector Point Edits
You can access many point properties through the Point Editor in Panorama:
- Continue working in the drawing from the previous exercise, or open
0305_PointCreation_FINISHED.dwg(0305_PointCreation_METRIC_FINISHED.dwg) and choose a point (or several points).  From the COGO Point contextual tab Modify panel, select Edit/List Points.
Panorama brings up information for the selected point(s) (see Figure 3.19).
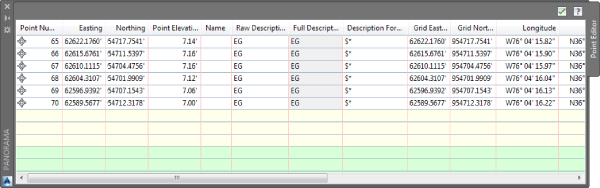
Figure 3.19 Edit points in Panorama
You can access a similar interface in the Prospector tab of Toolspace by following these steps:
- Highlight the Points collection (see Figure 3.20).
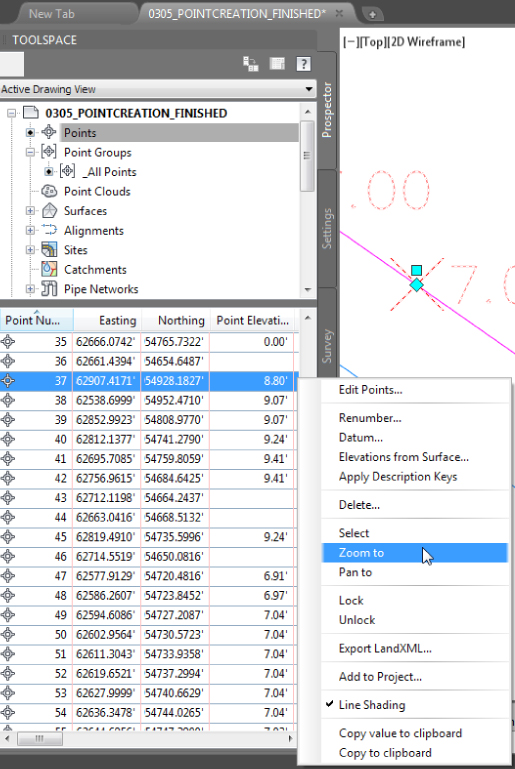
Figure 3.20 Prospector lets you view your entire Points collection at once.
- In either location, right-click the point or points you wish to examine and select Zoom To.
Prospector works like a spreadsheet in many ways. You can sort by any column by clicking the heading of the column. Clicking the column a second time will sort the data in the opposite order. For example, if you'd like to list your points alphabetically by description, click the Description column heading.
- Click the Raw Description column heading to re-sort the points.
- You can close Panorama for editing the points and close the file. It is up to you whether you want to save any modifications to the file.
Also note that the same interface is available for editing points when dealing with point groups.
Point Groups: Don't Skip This Section!
![]() Working with point groups is one of the most powerful techniques you will learn from this chapter. Do you want to select all your ground shots from within the survey? Make a point group! Want to move up last week's survey by the blown instrument height difference? Make a point group! Want to prevent invert shots from throwing off your surface model? You get it. Use a point group!
Working with point groups is one of the most powerful techniques you will learn from this chapter. Do you want to select all your ground shots from within the survey? Make a point group! Want to move up last week's survey by the blown instrument height difference? Make a point group! Want to prevent invert shots from throwing off your surface model? You get it. Use a point group!
A point group is a collection of points that results when a criteria-based filter is applied to the point data in the drawing. For the filter criteria you can use any point property or combination of properties such as description, elevation, and point number, or you can select specific points in the drawing.
You will see that a point group is already created by default in any Civil 3D drawing: the _All Points group. This group contains all points in the drawing regardless of filter criteria. This group cannot be renamed or deleted, nor can it have its properties modified to exclude any points. Therefore, you should create point groups for collections of points you might wish to separate from others, as shown in Figure 3.21.
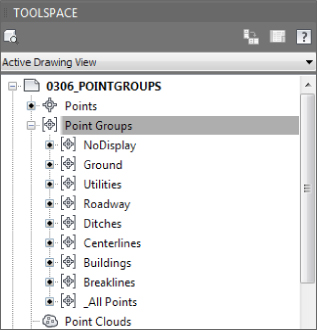
Figure 3.21 An example of useful point groups in Prospector
Point groups can (and should!) be created upon import of a text file, as shown previously in Figure 3.7. It is a good practice to create a point group for any new survey data added to the drawing so that if a problem comes to light about that group of points (such as incorrect instrument height), they can be isolated and dealt with apart from other points. Create a new point group by right-clicking the main point group category and selecting New.
In this exercise, you'll learn how to use point groups to separate points into usable categories:
- Open the drawing
0306_PointGroups.dwg(0306_PointGroups_METRIC.dwg), which you can download from this book's web page. - In Prospector, right-click Point Groups and select New.
- On the Information tab, name the point group Breaklines.
- Set Point Style to Basic Circle.
- Set Point Label Style to Description Only.
- Switch to the Include tab and place a check mark next to With Raw Descriptions Matching.
- In the With Raw Descriptions Matching field, type BB*,TB*.
The asterisk acts as a wildcard to include points that may have additional information after the description. You are adding multiple descriptions by separating them with a comma, as shown in Figure 3.22.
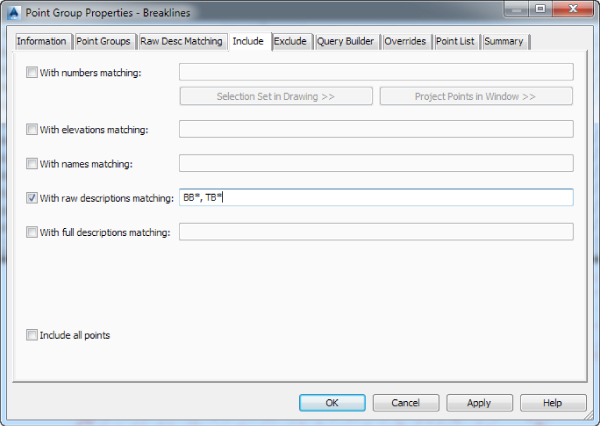
Figure 3.22 The Include tab of the Breaklines point group properties
- Switch to the Overrides tab.
- Place check marks next to Style and Point Label Style, as shown in Figure 3.23.
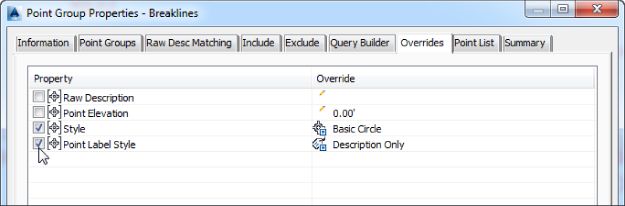
Figure 3.23 Overrides force the styles to conform by point group rather than the description key.
Doing so ensures that the point group, instead of the description keys, will control the styles.
- Switch to the Point List tab and examine the points that have been picked up by the group.
Only points beginning with BB and TB should appear in the list.
- Click OK.
- Again, right-click Point Groups and select New.
- On the Information tab, name the group No Display, as shown in Figure 3.24.
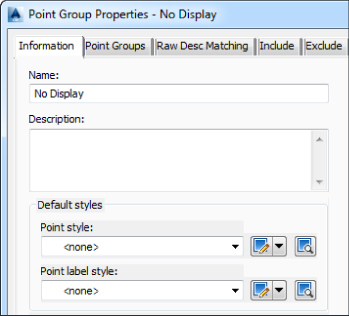
Figure 3.24 Most drawings should contain a No Display point group with styles set to <none>.
- Set both Point Style and Point Label Style to <none>.
- Switch to the Include tab, and at the bottom of the dialog, put a check mark next to Include All Points.
- Switch to the Overrides tab and place a check mark next to Style and Point Label Style.
- Click OK.
All the points are hidden from view as a result of the point group.
- Create another point group called Topo.
- Set Point Style to Basic Cross and Point Label Style to Elevation and Description.
- Switch to the Exclude tab and place a check mark next to With Elevations Matching.
- Type <=0 in the accompanying field.
- Place a check mark next to With Raw Descriptions Matching.
- Type PP*, TRANS*, WV*, WM*, FH*, MB*, PED*, GUY* in the accompanying field, as shown in Figure 3.25, and click OK. You may need to use the AutoCAD
REGENcommand to refresh the graphic and show your points again.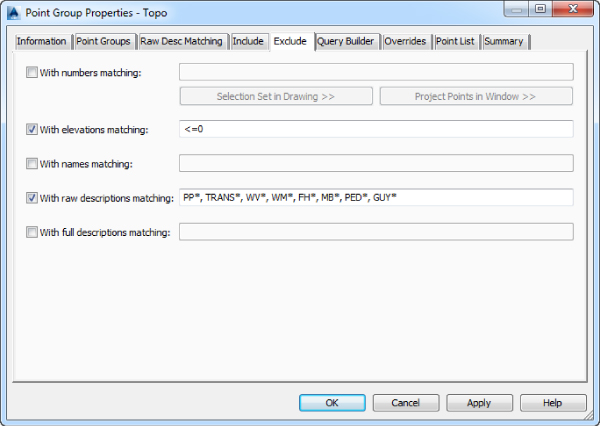
Figure 3.25 Use Exclude to create a Topo point group.
- Save the drawing.
To compare your work with a completed example, see 0306_PointGroups_FINISHED.dwg (0306_PointGroups_METRIC_FINISHED.dwg).
Point groups will dictate point and label styles only if the description key set does not manage those properties. If a description key set manages the point and label styles for the point, then the only way to override it is to use the settings in the Overrides tab for the point group. For example, if you have a point group that encompasses all your ground shots and the description key set defines their marker as an X, you could change that representation to + for the point group on the Overrides tab by toggling the setting for Point Style and selecting the style that has the desired representation. So in this case these settings take control of the styles away from the description key and place it with the point group.
Best Practice: Control Point Display Using Point Groups Rather Than Layers
Civil 3D drawings have many layers. It is much easier to switch the display of the point groups rather than create layer states for each point-visibility scenario.
A point can belong to more than one group at once. For instance, a water valve cover with elevation may be in a Topo group to be used in the definition of the surface, a Utilities group since it is part of the utilities point data, and the _All Points group since this is the default Civil 3D all-inclusive group. In these cases, the order in which the point groups are displayed in Prospector determines which point group controls the display of a specific point.
In this exercise, we will walk you through an example of how point group display order works:
- Open the drawing
0307_PointDisplay.dwg(0307_PointDisplay_METRIC.dwg), which you can download from this book's web page. - In Prospector, right-click Point Groups and select Properties (see Figure 3.26).
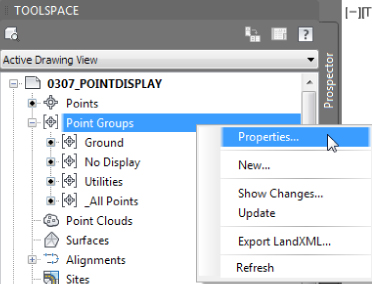
Figure 3.26 Select Point Groups
Properties to change point group display precedence. - Using the arrows on the far right of the Point Groups listing, select Utilities and move it to the top of the list.
- Move No Display so that it is listed directly below Utilities, as shown in Figure 3.27.
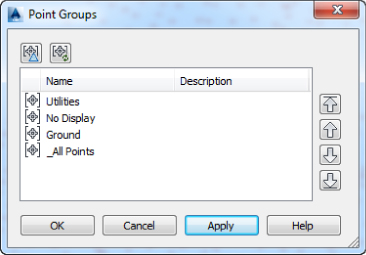
Figure 3.27 The order in which the point groups appear in this list controls precedence.
- Click OK. If the displayed objects are not updated to reflect the change, run a
regencommand.Notice that only points defined by the Utilities group are visible.
- Experiment with changing the order of the point groups using the properties.
- Save the drawing.
To compare your work with a completed example, see 0307_PointDisplay_FINISHED.dwg (0307_PointDisplay_METRIC_FINISHED.dwg).
Changing Point Elevations
We've already discussed the idea that points placed on or along an object that has elevation will automatically inherit the object's elevation. For the same reason, points placed with tools in the Surface flyout will automatically inherit the elevation of a surface model. If you have chosen to place points with manual elevation entry and then press ↵ when prompted to specify an elevation, the elevation will be null (no elevation).
You are never stuck with a COGO point's elevation. It can be changed individually or as a group using the Panorama window. Additional tools are available for manipulating points (see Figure 3.28) in the COGO Points contextual tab that opens when you select a point object.
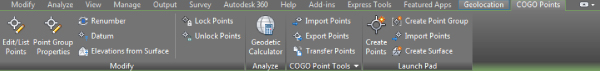
Figure 3.28 Point-editing commands in the ribbon
![]() Elevations From Surface is an extremely handy tool for forcing points to a surface elevation (see Figure 3.29).
Elevations From Surface is an extremely handy tool for forcing points to a surface elevation (see Figure 3.29).
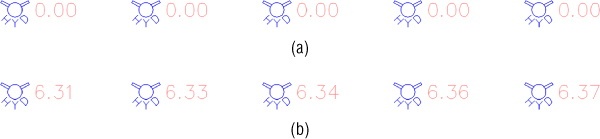
Figure 3.29 Hydrant Points as placed (a); hydrant points moved up to surface elevation (b)
In the event that you change the datum, you are most likely going to move a group of points' elevations. Right-click the name of the point group in Prospector and select Edit Points. Panorama will appear for your point-editing delight.
Use Windows keyboard tricks to control which points are selected for modification. Pressing Ctrl+A will select all points in the Panorama listing, as shown in Figure 3.30. When you have finished selecting points, right-click and choose Datum. The command line will prompt you to specify the change in elevation you require.
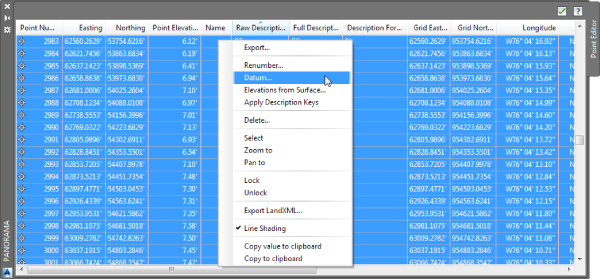
Figure 3.30 Right-click to access point-modification tools from Panorama.
Point Tables
You've seen some of the power of dynamic point editing; now let's look at how those dynamic edits can be used to your advantage in point tables.
Most commonly, you may need to create a point table for survey or stakeout data; it could be as simple as a list of point numbers, northing, easting, and elevation. These types of tables are easy to create using the standard point-table styles as a beginning reference. Follow these steps to create a point table:
- Open the
0308_PointTable.dwg(0308_PointTable_METRIC.dwg) file, which you can download from this book's web page.This file will appear empty, but it isn't. First, you will review reordering point group properties to change the display of points. You don't need to see points to make a point table from a group, but this will help you see that the table reflects the specific group.
- In Prospector, expand Point Groups.
You will see that No Display is listed on the top, which means the styles set in its properties are taking over the other point groups.
- Right-click Point Groups and select Properties.
- In the listing, move the group Corners To Locate to the top by using the arrows on the right. Click OK.
- Right-click the Corners To Locate point group and select the Zoom To option to focus on the desired points.
- Switch to the Annotate ribbon tab and click Add Tables Add Point Table.
 Verify that Table Style is set to Corner To Locate, and click the Point Group icon.
- Select Corners To Locate, and click OK.
- Verify that the check box next to Split Table is clear. When all your settings match those in Figure 3.31, click OK.
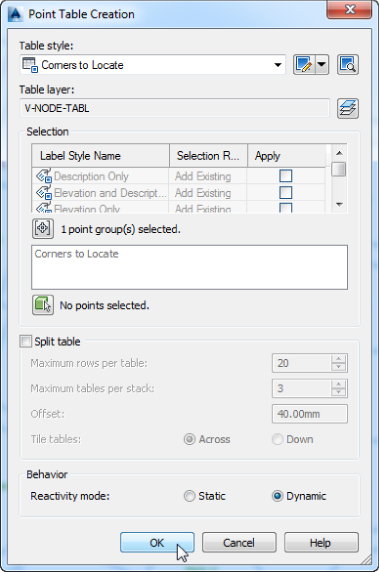
Figure 3.31 Point Table Creation options
- Click anywhere in the graphic to place the table.
- Save the drawing.
To compare your work with a completed example, see 0308_PointTable_FINISHED.dwg (0308_PointTable_METRIC_FINISHED.dwg).
User-Defined Properties
Standard point properties include items such as number, easting, northing, elevation, name, description, and the other entries you see when examining points in Prospector or Panorama. Now, what if you'd like to assign extra information to a point object and the field data for that information is not among the standard fields that ship with the software? Civil 3D is versatile in this situation since it provides the means to add custom fields to suit your needs.
It's common to receive points from a soil scientist that list additional information, such as groundwater elevation or subsurface elevation. Surveyed manhole points often include invert elevations or flow data. Tree points may also contain information about species or caliber measurements. All this additional information can be added as user-defined properties to your point objects. By using user-defined properties, you will be able to parse the nonstandard information and attach it to the point data during the import process. You can then use user-defined properties in point labeling, analysis, point tables, and more.
The Bottom Line
- Import points from a text file using description key matching. Most engineering offices receive text files containing point data at some time during a project. Description keys provide a way to automatically assign the appropriate styles, layers, and labels to newly imported points.
- Master It Open
Masterit_0301.dwg(Masterit_0301_METRIC.dwg), which you can download from the book's web page. Revise the Civil 3D description key set to contain only the parameters listed next.Code Point style Point label style Format Layer GS* Basic Elevation Only Ground Shot V-NODE EP* Basic Elevation and Description Road Edge V-NODE HYD* Hydrant (existing) Elevation and Description Hydrant V-NODE-WATR SW* Basic Elevation and Description Sidewalk V-NODE TREE* Tree Elevation and Description Tree V-NODE-TREE
Import the PENZD (space delimited) file
MasterIt_0301.txt(MasterIt_0301_METRIC.txt). Confirm that the description keys made the appropriate matches by looking at a handful of points of each type. Do the trees look like trees? Do the hydrants look like hydrants?Save the resulting file for use in the remaining exercises.
- Master It Open
- Create a point group. Building a surface using a point group is a common task. Among other criteria, you may want to filter out any points that tend to have erroneous elevations such as utilities or vegetation.
- Master It Create a new point group called Topo that includes all points except those with descriptor code of TREE and HYD. Use the DWG created in the previous “Master It” exercise or start with
MasterIt_0301_FINISHED.dwg(MasterIt_0301_METRIC_FINISHED.dwg).
- Master It Create a new point group called Topo that includes all points except those with descriptor code of TREE and HYD. Use the DWG created in the previous “Master It” exercise or start with
- Export points to LandXML and ASCII format. It's often necessary to export a LandXML or ASCII file of points for stakeout or data-sharing purposes. Unless you want to export every point from your drawing, it's best to create a point group that isolates the desired point collection.
- Master It Create a new point group that includes all the points with a raw description of SW. Export this point group via LandXML and a PENZD comma-delimited text file.
Use the DWG created in the previous “Master It” exercise or start with
MasterIt_0302_FINISHED.dwg(MasterIt_0302_METRIC_FINISHED.dwg).
- Master It Create a new point group that includes all the points with a raw description of SW. Export this point group via LandXML and a PENZD comma-delimited text file.
- Create a point table. Point tables provide an opportunity to list and study point properties. In addition to basic point tables that list number, elevation, description, and similar options, you can customize point table formats to include user-defined property fields.
- Master It Use the DWG created in the previous “Master It” exercise or start with
MasterIt_0303_FINISHED.dwg(MasterIt_0303_METRIC_FINISHED.dwg). Create a Centerline point group to include all the centerline points, and create a point table for this point group using the PNEZD format table style.
- Master It Use the DWG created in the previous “Master It” exercise or start with