
Chapter 11
Superelevation
Superelevation and cant are methods for changing the cross section of a design to keep cars and trains safely and comfortably on their paths when driving along a curve or series of curves. Superelevation tools also provide a convenient way to force the slope of a road for drainage purposes, without the need for additional assemblies.
Once you have a good grasp of alignments, assemblies, and corridors, you can add a level of sophistication to your design with the superelevation and cant tools within the Autodesk® AutoCAD® Civil 3D® software. Whether you are trying to match into an existing road's superelevation or creating new data, you will find the tools you need.
In this chapter, you will learn to
- Add superelevation to an alignment
- Create a superelevation assembly
- Create a rail corridor with cant
- Create a superelevation view
Preparing for Superelevation
Before superelevation can be applied to the design, you will need a design criteria file appropriate for your locale, design speeds applied to an alignment, an assembly with subassemblies that recognize superelevation, and an understanding of superelevation critical stations.
Critical Stations
Critical stations mark “milestones” in a superelevated region of an alignment. These points are located by means of calculations driven by the design criteria file.
- End Normal Shoulder (ENS) This is the first station in the Transition In region. Normal shoulder slope is maintained, as shown in Figure 11.1, but at subsequent stations, shoulder slope gradually becomes planar.
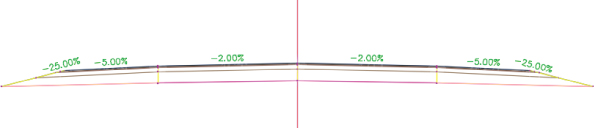
Figure 11.1 End Normal Shoulder (ENS), the first station in the Transition In region
- End Normal Crown (ENC) Normal lane slope is maintained, as shown in Figure 11.2, but at subsequent stations lane slope gradually becomes planar. ENC also marks the beginning of runout distance in the region.
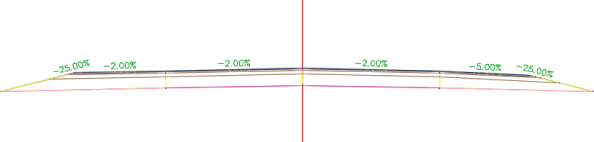
Figure 11.2 End Normal Crown (ENC), where the outside lane slope starts to flatten
- Level Crown (LC) One side of the assembly will flatten to 0.00%, as shown in Figure 11.3. This occurs in the Transition In region as well as the Transition Out region. It marks the beginning of runoff distance in the Transition In region and the beginning of runout distance in the Transition Out region.
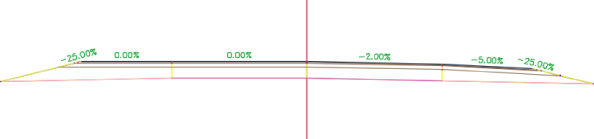
Figure 11.3 Level Crown (LC), where the outside lane flattens
- Reverse Crown (RC) The outside lane becomes planar with the inside lane matching slope (normal), as shown in Figure 11.4. This occurs in the Transition In region as well as the Transition Out region in the runoff distance.
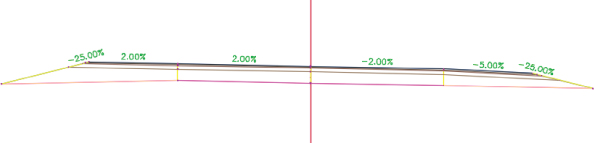
Figure 11.4 Reverse Crown (RC), where the outside lane becomes planar with the inside lane
- Begin Full Super (BFS) Both lanes are planar and are at their maximum rate of superelevation (emax), as shown in Figure 11.5. This occurs at the end of the Transition In region.
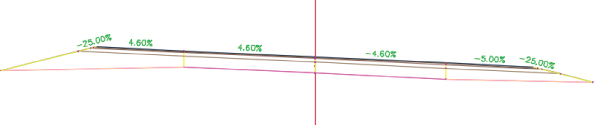
Figure 11.5 Begin Full Super (BFS), with both lanes at maximum slope
- End Full Super (EFS) EFS has the same cross-slope conditions as Begin Full Super (Figure 11.5). This station marks the beginning of the Transition Out region and marks the beginning of the runoff distance for that region.
- Begin Normal Crown (BNC) BNC has the same cross-slope conditions as End Normal Crown (Figure 11.2). This station in the Transition Out region marks the end of the runout distance.
- Begin Normal Shoulder (BNS) BNS has the same cross-slope conditions as End Normal Shoulder (Figure 11.1). This station marks the end of the Transition Out region.
Now that you are familiar with the terminology used to describe transition stations, you are ready to examine design criteria.
Design Criteria Files
Having the correct design criteria file in place is the first step to applying superelevation to your corridor. These XML-based files contain instructions to the software on when to flag your design for geometry problems both horizontally and vertically. Design criteria files are the brains behind how your road behaves when superelevation is applied to the design.
Several design criteria files are supplied with Civil 3D upon installation. The out-of-the-box standards include AASHTO 2001, AASHTO 2004, and AASHTO 2010 for both metric and Imperial units. Several of the country kits include design criteria files for your locality if you are outside of the United States. If country or state kits do not exist for your situation, you can create your own user-defined files.
To create your own design criteria, follow these steps:
- Select any alignment.
- From the Alignment context tab
 Modify panel, click the Design Criteria Editor.
 - It is easier to modify an existing table in your desired units than to start from an empty file.
- Be sure to click the Save As icon before making any changes.
Inside the Design Criteria Editor (Figure 11.6), you will see three headings: Units, Alignments, and Profiles. The Units page tells Civil 3D what type of values it will be using in the file. The Alignments page is used for checking design, creating superelevation, and widening outside curves. The Profiles page provides tabular data for minimum K-value used to check vertical design.
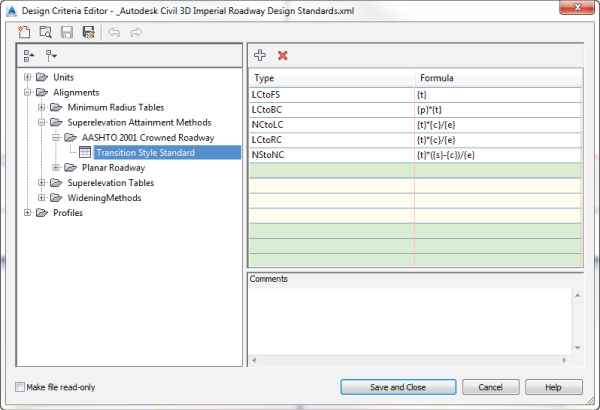
Figure 11.6 Inside the Design Criteria Editor
Civil 3D will graphically flag alignments when the design speed specified in the alignment properties has a radius less than the value specified in the Minimum Radius Table. The Minimum Radius Tables from AASHTO use superelevation rates in the table names, but this does not lock you into that rate for applying superelevation to the corridor. In other words, just because you use a more conservative value in your radius check, that doesn't mean you can't superelevate at a steeper rate. The tables are independent of one another.
Also in the Alignments branch you will find the superelevation attainment equations. These equations determine the distance between superelevation critical stations. Familiarize yourself with the terminology and locations represented by these stations, as shown in Figure 11.7.
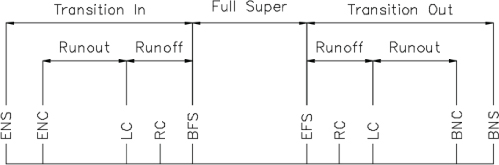
Figure 11.7 Diagram of superelevation critical stations and regions calculated by Civil 3D
In the following exercise, you will modify an example design criteria file and save it:
- Open the
1101_Criteria.dwg(1101_Criteria_METRIC.dwg) file, which you can download from this book's web page at www.sybex.com/go/masteringcivil3d2015. This exercise will also require1101_CriteriaExample.xml(1101_CriteriaExample_METRIC.xml).  Select the USH 10 alignment that already exists in the drawing.
 On the Alignment contextual tab Modify panel, select Design Criteria Editor.
- Click the Open button at the top of the dialog, and browse to the
1101_CriteriaExample.xml(1101_CriteriaExample_METRIC.xml) file. Click Open. - Expand the Alignments branch, and expand the Superelevation Tables branch.
There is only one superelevation table in this example for 4% maximum slope.
- Right-click Superelevation Tables, and select New Superelevation Table.
- Double-click the new table and rename it Example 6% Super.
- Right-click Example 6% Super, and select New SuperelevationTypeByTable.
- Expand the new branch, right-click SuperelevationTypeByTable, and select New Superelevation Design Speed, as shown in Figure 11.8.
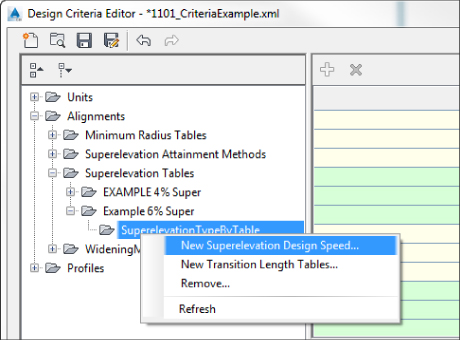
Figure 11.8 Adding a design speed to the design criteria file
When you expand the SuperelevationTypeByTable branch, you will see that Civil 3D has created a new table with a default design speed of 10 regardless of the units you are working in.
- Double-click Design Speed 10 and change the design speed to 30 mi/hr (50 km/hr).
Notice that you need only the numeric value; Civil 3D fills in the rest of the table name for you.
- Highlight your new design speed table.
The right side of the dialog will display an empty table containing columns labeled Radius and Superelevation Rate.
- Select the first row of the table. Click the first field in the Radius column to start entering data. Add several radius and superelevation values, as follows:
Curve radius (feet) Curve radius (meters) Superelevation % 300 90 6 1000 300 4.5 1500 450 3.2 2000 600 2.6 4000 1250 NC When you have completed your data entry from the table, the US units Design Criteria Editor will resemble Figure 11.9.
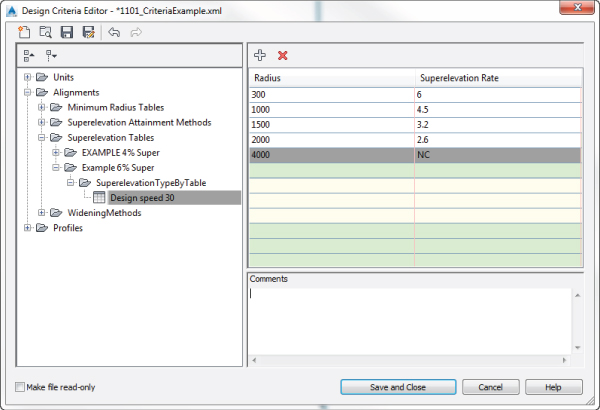
Figure 11.9 Adding example data using the Design Criteria Editor
- Add a note in the Comments field that reads Example Data Only!
- Click the Save And Close button at the bottom of the editor.
- Click Save Changes and exit when prompted.
- Save and close the current drawing.
Ready Your Alignment
Superelevation stations are connected to alignment curves (unless you create a user-defined curve in a tangent section). The design speed from the alignment properties is needed at each curve to specify which superelevation rate tables to use from the design criteria. The design speed has an effect on the distance between superelevation critical stations and the cross slope used when the road is at full-super.
It is a good idea to get your alignment geometry and design speed locations finalized before attaching superelevation. If a change is made to your alignment, the superelevation stationing will be marked as out of date.
Super Assemblies
As a general rule, if the lane subassembly has the word super somewhere in its name, it will respond to superelevation. If you want to verify that the lane you are choosing will behave the way you want it to in a superelevation situation, you can right-click it from the tool palette and access the subassembly help.
As long as you stay away from the Basic tab, all of the shoulder and curb subassemblies have parameters you can set to dictate how the assembly is to behave when an adjacent lane superelevates.
Most subassemblies that are capable of superelevating are intended for use where the pivot point for the cross section is at the center crown of the road. When the pivot point is at the center of the road, the baseline profile dictates the final elevation of the crown of the road. Figure 11.10 shows an example of a two-lane highway (top image) and a four-lane divided highway (bottom image) that are designed to be used with the superelevation tools.
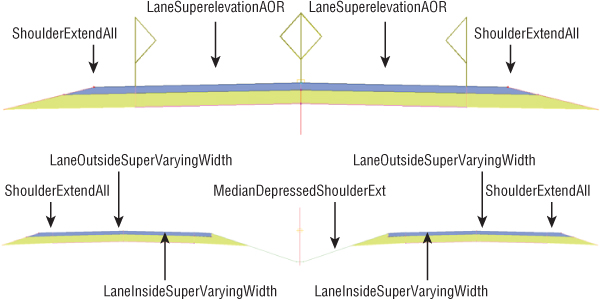
Figure 11.10 Two-lane and four-lane road assemblies designed to be used in super
Axis of Rotation Support
The axis of rotation (AOR) subassembly can be used when the centerline of the road is not the pivot point for superelevation. The flag symbols (as shown in Figure 11.11) indicate potential pivot points on the assembly.
Figure 11.11 AOR subassemblies used on an undivided, crowned roadway
The flag symbols on LaneSuperelevationAOR indicate where the lane can be pinned down and used as a pivot point. When the axis of rotation is not the centerline of the road, the lane geometry is used to determine the change in elevation that will occur as a result.
When building assemblies with LaneSuperelevationAOR you may see warnings appear, as shown in Figure 11.12.
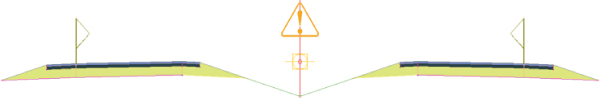
Figure 11.12 A warning symbol on an assembly using LaneSuperelevationAOR
Here are some of the warnings you may encounter:
- Center Pivots Not Applied When Only One Group This usually occurs when you start your assembly with a median at the center. The construction of the assembly then does not have distinct left and right groups. Check the Construction tab of the assembly Properties dialog to verify. The fix is to build your assembly with left and right sides and add the median last.
- Unsupported Subassemblies This warning will appear when you're attempting to use an assembly that has the Superelevation Axis Of Rotation parameter absent from its parameters.
- Unsupported In Assemblies Containing Offsets Using an offset assembly will interfere with the software's ability to calculate the correct slope and curve widening on a superelevated road. Therefore, offset assemblies are not recommended for use with the AOR subassembly. You can still use offsets in traditional center-pivot-based superelevation.
- No Center Pivots Found Make sure your assembly properties list the assembly as the correct type. For example, if you accidentally set Assembly Type to Divided Crowned Road when it is actually an undivided crowned road, you will receive this message. Check the Construction tab of the assembly Properties dialog to verify.
You can still add assemblies with warnings to a corridor; however, the superelevation may not behave as expected.
Applying Superelevation to the Design
Civil 3D takes into account other factors such as curve station locations and assembly geometry. Superelevation information is associated with the alignment but is handled in a separate calculation area. In this section, you will put all the pieces in place that are needed for the software to dynamically apply superelevation or cant to your design.
Start with the Alignment
To begin applying superelevation to the design, select your alignment:
- Open the
1103_Super.dwg(1103_Super_METRIC.dwg) file, which you can download from this book's web page. - Select the USH 10 alignment that already exists in the drawing.
- From the Alignment contextual tab, select Superelevation Calculate/Edit Superelevation.
- When prompted by the dialog, click Calculate Superelevation Now.
- On the Calculate Superelevation – Roadway Type page, select the Undivided Crowned radio button.
- From the Pivot Method drop-down, choose Center Baseline, as shown in Figure 11.13, and click Next.
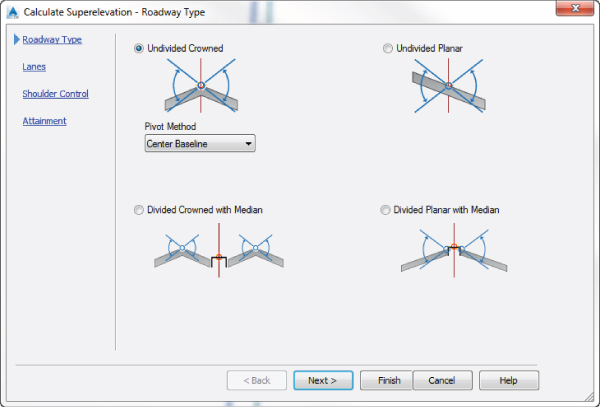
Figure 11.13 Roadway type specification for superelevation
- On the Calculate Superelevation – Lanes page, verify that the Symmetric Roadway check box is selected.
- Set Normal Lane Width to 12′ (4 m), and set Normal Lane Slope to -2.00%, as shown in Figure 11.14, and click Next.
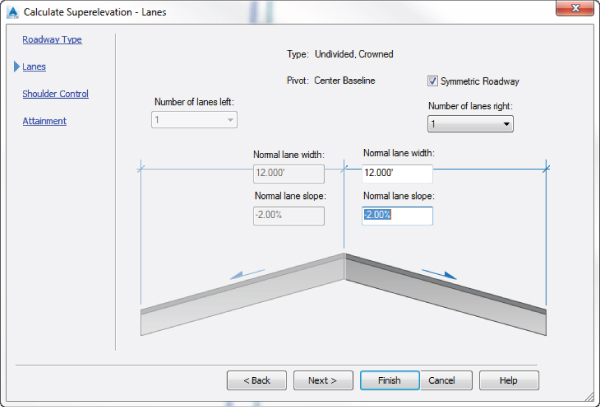
Figure 11.14 Lane information
- On the Calculate Superelevation – Shoulder Control page, make sure the Calculate check box is selected on the right side of the page.
- Only the Outside Edge Shoulders options should be active. Since this is an undivided road, the options for the inside median shoulders are grayed out.
- Set Normal Shoulder Width to 6′ (2 m), and set Normal Shoulder Slope to -5.00%.
- For Shoulder Slope Treatment, set the following:
- Set the Low Side option to Breakover Removal.
- Set the High Side option to Default Slopes.
- Place a check mark next to Maximum Shoulder Rollover and set the value to 8.00%.
- Your Shoulder Control screen should look like Figure 11.15.
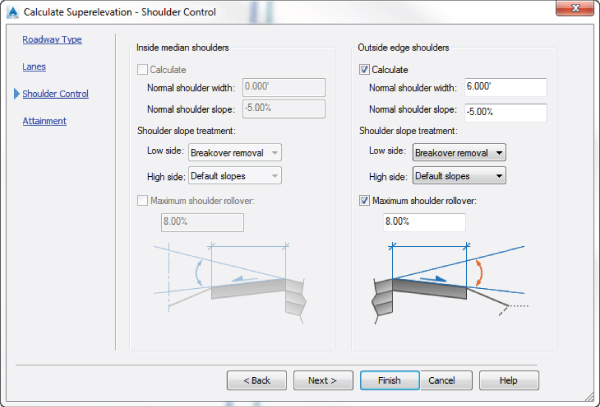
Figure 11.15 Shoulder Control and Breakover Removal parameters
- Click Next.
- On the Calculate Superelevation – Attainment page, click the ellipsis button to set the design criteria file to
Autodesk Civil 3D Imperial (2004) Roadway Design Standards.xml(Autodesk Civil 3D Metric (2004) Roadway Design Standards.xml). - Set the superelevation rate table to AASHTO 2004 US Customary eMax 4% (AASHTO 2004 Metric eMax 4%).
- Set the transition length table to 2 Lane.
- Set the Attainment method to AASHTO 2004 Crowned Roadway.
- Place a check mark next to Apply Curve Smoothing and set Curve Length to 50′ (20 m).
- Leave all other settings at their defaults, as shown in Figure 11.16.
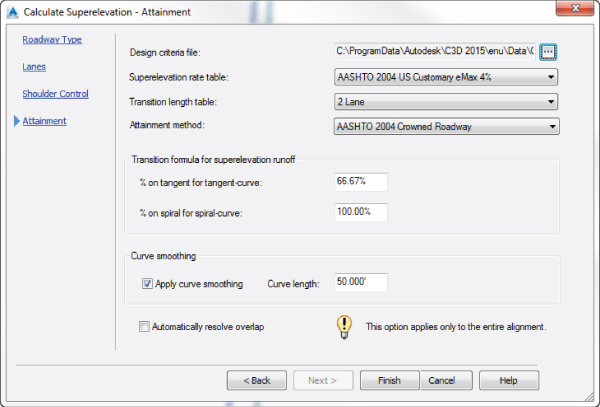
Figure 11.16 Finalizing the superelevation on the Attainment screen
- Click Finish.
You should now see the Superelevation Tabular Editor appear inside Panorama with the data resulting from the wizard. Examine your alignment; you should now have labels showing the superelevation critical stations created by the wizard.
As you click in the table, you will see helpful glyphs showing you which superelevation station and corresponding curve you are editing, as shown in Figure 11.17.
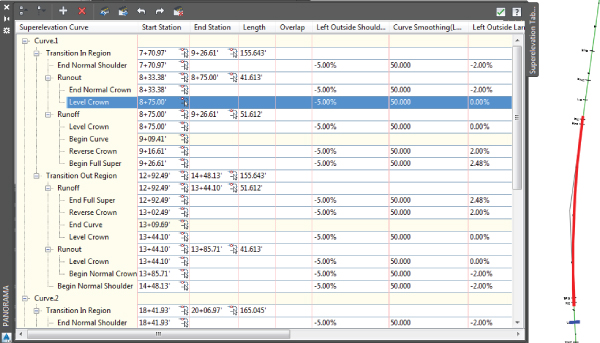
Figure 11.17 Superelevation table with glyphs in the graphic
Compare your work with 1103_Super_FINISHED.dwg or 1103_Super_METRIC_FINISHED.dwg.
Transition Station Overlap
It is not uncommon to have overlap warnings in your superelevation table. You should resolve the transition station overlap before you continue your design.
Overlap occurs when there is not enough room between curves to fully transition out of one curve and back into the next. Transition station overlap will always occur when a reverse curve or compound curve exists in your alignment. As you can see in Figure 11.18, Curve 1 does not complete its transition out until station 9+16.64, but according to the attainment calculations, Curve 2 will begin affecting the shoulder starting at station 5+98.21.
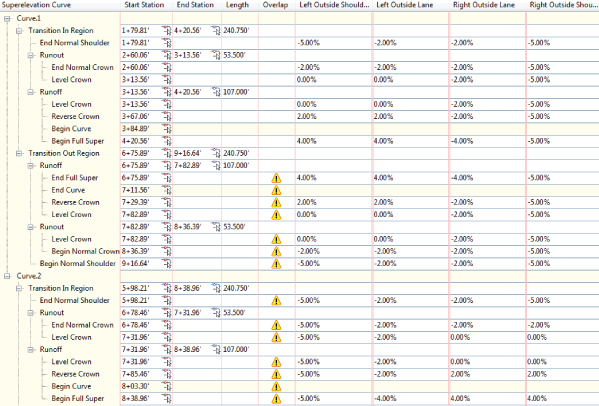
Figure 11.18 Superelevation table showing overlap between two curves
You have several options for fixing superelevation overlap:
- You can choose to have Civil 3D rectify the overlap for you.
- You can manually modify the stations in the table.
- You can change the stationing for superelevation by modifying the superelevation view, which we will discuss later in this chapter.
To have Civil 3D clear the overlap for you, click the warning symbol that appears in the Superelevation Tabular Editor. Civil 3D resolves overlap by omitting noncritical stations and/or by compressing the transition length between certain stations. In the case of a reverse curve, Civil 3D will pivot the road from full-super to full-super, without transitioning back to normal crown. Be sure to verify that the software has made the update that meets the requirements of your locale.
Calculating Cants for Rail
In the civil engineering industry, the terms superelevation and cant are used interchangeably. Inside Civil 3D, the terms have distinct meanings. Superelevation tools in Civil 3D are used for roads; the cross-slope changes within a curve are expressed by a percentage. Unlike superelevation, cant applies to railways and is expressed as a difference in height between the outer and inner rails (Figure 11.19).
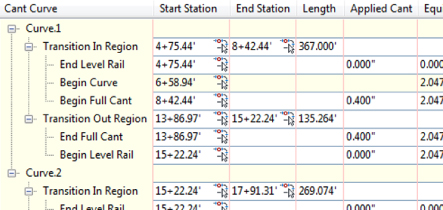
Figure 11.19 Example cant curve data table
Preparing for Cants
In order to work with cant, the following must be in place:
- Alignment Type Set to Rail Normally, you would set the alignment type when you first define the alignment. If you forget to set this initially, you can change it at any time in the Alignment properties on the Information tab.
- Alignment Design Speed Like motorways and superelevation, rail requires a design speed in order to apply cant. Cant design standards are provided with the software and can be edited in the same manner as other design criteria files.
- Cant Calculation Like superelevation, cant is attached to an alignment and its curves. As shown in Figure 11.20, the icon's location in the Alignment contextual tab should be reminiscent of the superelevation button.
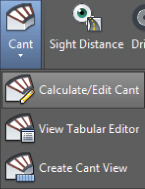
Figure 11.20 Accessing the Cant Calculation tools from the Rail Alignment contextual tab
- Rail Assembly When working with an assembly for rail, the type must be set to Railway. You can set this on assembly creation or in the Assembly properties after the fact. There is one subassembly that is purpose-built for cant, the RailSingle subassembly, shown in Figure 11.21. If you are working with a drawing created in a release prior to 2013, make sure you replace the old assemblies with this new rail subassembly to ensure cant takes place. You can verify the version by checking Advanced Parameters Version in the AutoCAD Properties palette.
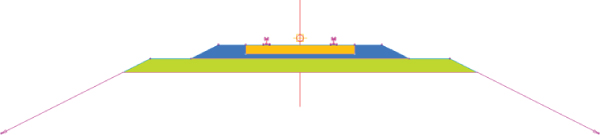
Figure 11.21 The RailSingle subassembly
Creating a Rail Assembly
You will find the RailSingle subassembly in the Bridge And Rail tab of the tool palettes. The following exercise will walk you through creating a typical rail bed design:
- Open the drawing
1104_Rail.dwg(1104_Rail_METRIC.dwg), which you can download from this book's website.This drawing contains an alignment and design profile.
- On the Home tab Create Design panel, choose Assembly Create Assembly.
- Name the assembly Rail w Service Road.
- Set Assembly Type to Railway, and click OK.
- Click to place the assembly anywhere in the graphic.
- Open the subassembly tool palettes if they are not already open. In the subassembly tool palettes, locate the Bridge And Rail palette, and click RailSingle. In the Properties palette, make the following changes:
- Set the subballast width to 20′ (6 m).
- Set the subballast side slope to 0.001:1.
Leave all other parameters at their defaults.
- Click the assembly to place the RailSingle subassembly.
- Switch to the Basic tab of the subassembly tool palettes, and click GenericPavementStructure.
This will be your service road, constructed out of the same material as the subballast.
- Enter the following data into the Properties palette, remembering that the codes are case sensitive:
- Set Side to Left.
- Set Width to 8′ (2.5 m).
- Set Depth to 1′ (0.3 m).
- Set DeflectOuterVerticalFace to Yes.
- Set Outer Edge Slope to 2.00:1.
- Set TopLink Codes to Top, and set BottomLink Codes to Datum.
- Set Shape Codes to Subballast.
- When your parameters resemble Figure 11.22, click to place the GenericPavementStructure to the left of the subballast rail subassembly.
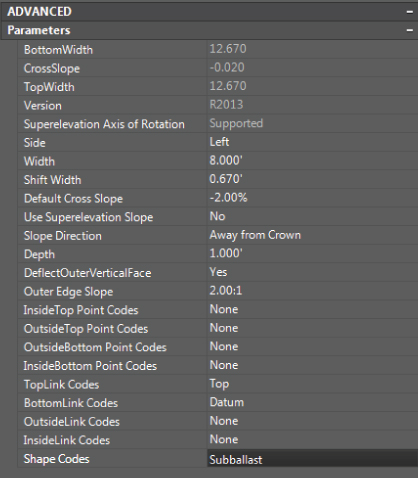
Figure 11.22 Advanced Parameters for service road
- Remain in the GenericPavementStructure tool, but change the width to 0.1’ (0.03 m) and the side to Right.
- Click to place the structure on the right side of the rail subassembly.
- Switch to the Generic palette, and click LinkSlopeToSurface.
- Set Slope to -50 and click the “tip” of the generic pavement structure on both sides of the assembly.
Your completed assembly will look like Figure 11.23.
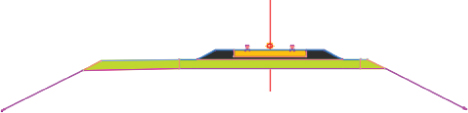
Figure 11.23 Your completed rail assembly
- Save and close the drawing.
Compare your work with
1104_Rail_FINISHED.dwgor1104_Rail_METRIC_FINISHED.dwgto see how you fared.
Applying Cant to the Alignment
Like superelevation in a roadway alignment, cant is related to a rail alignment. The following exercise will walk you through applying cant to the alignment. You should experience a distinct feeling of déjà-vu if you completed earlier exercises involving applying superelevation to the alignment.
- Open the drawing
1105_RailAlignment.dwg(1105_RailAlignment_METRIC.dwg), which you can download from this book's website. - This drawing contains a corridor with rail; your task is to update the alignment to apply cant. Observe the section views in the drawing (shown in the lower modelspace viewport in the file). Each is created at a location on the curve that should have cant applied. However, these views show flat rails.
- Select the alignment from the upper viewport. From the Rail Alignment contextual tab Modify panel, click Cant Calculate/Edit Cant.
- Click Calculate Cant Now.
- Keep the pivot method as Low Side Rail, and click Next.
- Place a check mark next to Automatically Resolve Overlap.
- Set the Applied Cant Table setting to Freight Train Applied Cant Table (metric users, use Mixed Passenger And Freight Cant).
- Leave all other settings at their defaults, and click Finish.
- Panorama opens showing the Cant Tabular Editor, as shown in Figure 11.24.
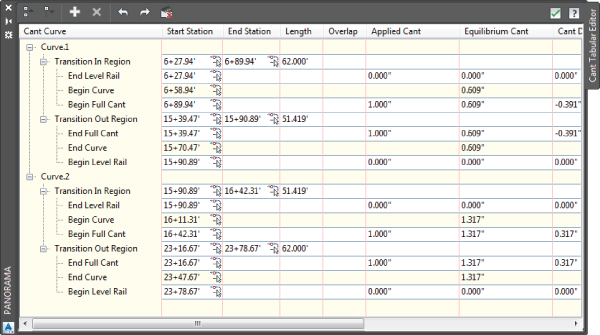
Figure 11.24 The Cant Tabular Editor
- In Prospector, right-click and rebuild the Hiawatha corridor.
- Save and close the drawing.
- You should observe in the lower viewport that your section views show the cant applied to the design. Check your design against
1105_RailAlignment_FINISHED.dwgor1105_RailAlignment_METRIC_FINISHED.dwgif desired.
Superelevation and Cant Views
Superelevation and cant views are a graphic representation of the roadway or rail superelevation. Grip edits to the graphical view will also edit the superelevation stations. The view itself is not intended for plotting. The superelevation view plots station against lane slope to form a graph of the left and right edges of the pavement.
In the following exercise, you will create a superelevation view:
- Open the drawing
1106_SuperView.dwg(1106_SuperView_METRIC.dwg), which you can download from this book's website. - The alignment in this file already has superelevation calculated for it. Your task is to create the superelevation view.
- Select the Route 66 alignment by clicking it in the graphic.
- From the Alignment contextual tab Modify panel, click Superelevation Create Superelevation View, as shown in Figure 11.25.
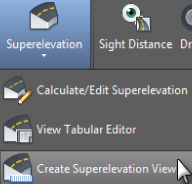
Figure 11.25 Creating a superelevation view
- In the Create Superelevation View dialog, set the colors for the lane and shoulder slopes as shown in Figure 11.26 by double-clicking the ByBlock field and picking the colors indicated.
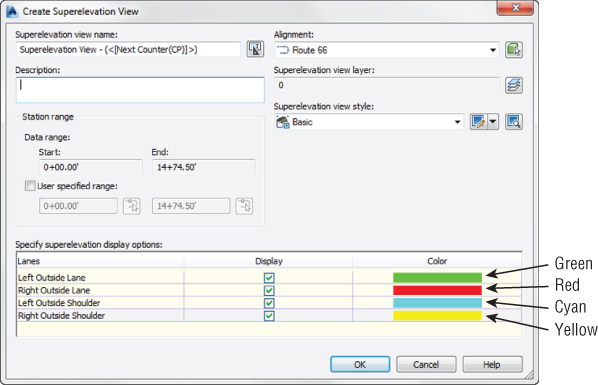
Figure 11.26 Set colors for different assembly components to easily differentiate them in the superelevation view.
- Click OK and then click in the graphic to place the superelevation view. Your result should look like Figure 11.27.
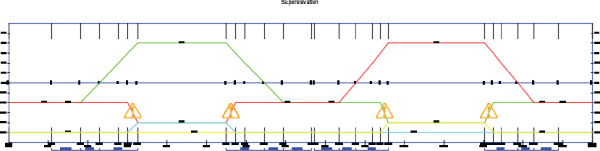
Figure 11.27 The superelevation view for the Route 66 alignment
- Save the file for use in the next exercise.
At first glance, the superelevation view may seem difficult to read, but with a little explanation it can shed a lot of light on what is going on with your lane and shoulder slopes. The superelevation graphic plots the station value against the percent cross-slope of each edge of pavement and edge of shoulder. The upper line shows the behavior of the right edge of the pavement, and the lower line shows the left edge of the pavement.
Where no superelevation is applied, the graph data for the lanes remains at -2% while the shoulders are shown at their default cross-slope of -5%. As the assembly twists into position during superelevation, the distances between the lines become greater as the right edge slopes up to a maximum superelevation of 4%.
There are a few more observations you can make about your superelevation view. No overlap exists between the two curves' superelevation data. You can tell this by observing the center portion of the graph; the superelevation lines go back to the default cross-slope. The very astute observer can ascertain by looking at this graph that a maximum breakover slope of 8% was used on the shoulder. How can you tell? By seeing that when the lanes are in max super (i.e., the lane is at +4% slope), the shoulder slope jumps up to -4%.
Using a Superelevation View to Edit Data
Next, you will use the superelevation view to edit superelevation data. Editing superelevation data by the superelevation view is an alternative to editing the data in tabular form, as you learned about earlier.
The diamond-shaped grips can be slid in one axis to modify stationing (the horizontally oriented grips) or slope (the vertically oriented grips). The rectangular grip can be moved to reduce the maximum lane slope when it is in a full-super state, as shown in Table 11.1.
Table 11.1 Superelevation view grips
| Superelevation View Symbol | Meaning |
| Grip (blue) is at a superelevation critical station and a grade break occurs at that station. Vertically oriented grips can be moved up or down to change the slopes associated with them. | |
| Grip is at a superelevation station. Horizontally oriented grips change the value of superelevation stations. | |
| Grip will appear at locations of constant slope. These can be moved up or down to change the superelevation cross-slope. | |
| Grip (gray) is at a superelevation critical station, but no grade breaks occur at the location. Vertically oriented grips can be moved up or down to change the slopes associated with them. | |
| The plus sign next to any grip indicates that more than one item is the same slope at that station. |
In the following exercise, you will use the superelevation view to remove the normal crown area in the middle of the alignment. In other words, you will force the curves to transition directly from one to the other. You will also adjust the rate of maximum superelevation.
- Continue working in the drawing
1106_SuperView.dwg(1106_SuperView_METRIC.dwg). You need to have completed the previous exercise before continuing. - Isolate the right outside lane line in the superelevation view by holding down Ctrl as you click the red line. (Hint: If you are not sure which line represents the various superelevation slopes, pause your cursor over the line to get a tooltip showing the line's information.)
- Pause your cursor (without clicking) over the blue grip at station 5+73.47 (0+175.06 in the metric drawing).
- Select Remove Grade Break from the grip menu, as shown in Figure 11.28. Press Esc after the grip is removed.
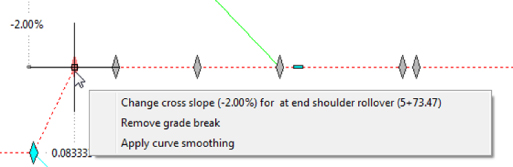
Figure 11.28 The grip menu at the superelevation critical station
- Repeat steps 3 and 4 to remove the grade break at 8+35.56 (0+258.53 in the metric drawing).
- Press Esc to clear your selection.
- Hold down Ctrl and select the green line representing the left outside lane.
- Using the same technique as before, remove the grade break at stations 6+93.47 (0+207.56 in the metric drawing) and 9+39.31 (0+286.03 in the metric drawing). Press Esc to clear the selection when complete.
- Turn on dynamic input (F12 on your keyboard) if it is not already on.
- Click your superelevation view to select it. All of the grips should be available.
- Click the flat blue grip in the first left outside shoulder region just after station 1+09.41 (0+039.60 in the metric drawing). The grip will be associated with the cyan line.
- In the dynamic input box, key-in -4.5, as shown in Figure 11.29, and then press Enter.
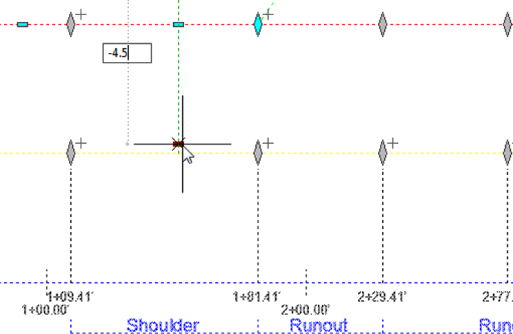
Figure 11.29 Changing the slope using grips and dynamic input
- The shoulder slope has been changed slightly to match existing conditions.
- Save the file.
- Compare your work to
1106_SuperView_FINISHED.dwgor1106_SuperView_METRIC_FINISHED.dwgif desired.
The Bottom Line
- Add superelevation to an alignment. Civil 3D has convenient and flexible tools that will apply safe, correct superelevation to an alignment curve.
- Master It Open the
MasterIt1101.dwg(MasterIt1101_METRIC.dwg) file, which you can download from www.sybex.com/go/masteringcivil3d2015. Verify that the design speed of the road is 20 miles per hour (35 km per hour) and apply superelevation to the entire length of the alignment. Use AASHTO 2004 design criteria with an eMax of 6% 2-Lane. Use the option to automatically resolve overlap. For the remainder of the options, use the default settings unless otherwise directed.
- Master It Open the
- Create a superelevation assembly. For superelevation to happen, you need to have an assembly that is capable of superelevation.
- Master It Continue working in
MasterIt1101.dwg(MasterIt1101_METRIC.dwg). You must have completed the previous exercise before starting this one. Create an assembly similar to the one in the top image shown earlier in the chapter in Figure 11.10. Set each lane to be 14′ (4.5 m) wide and each shoulder to be 6′ (2 m) wide. Leave all other options at their defaults. If time permits, build a corridor based on the alignment and assembly.
- Master It Continue working in
- Create a rail corridor with cant. Cant tools allow users to create corridors that meet design criteria specific to rail needs.
- Master It In the drawing
MasterIt1102.dwg(MasterIt1102_METRIC.dwg), create a Railway assembly with the RailSingle subassembly using the default parameters for width and depth. Add a LinkSlopeToSurface generic link with 50 percent slope to each side. Add cant to the alignment in the drawing using the default settings for attainment. Create a corridor from these pieces.
- Master It In the drawing
- Create a superelevation view. Superelevation views are a great place to get a handle on what is going on in your roadway design. You can visually check the geometry as well as make changes to the design.
- Master It Open the drawing
MasterIt1103.dwg(MasterIt1103_METRIC.dwg). Create a superelevation view for the alignment. Show only the left and right outside lanes as blue and red, respectively.
- Master It Open the drawing