1
Introduction
1.1 Energy and Sustainable Development
This book is written by a chemical engineer and an electronic engineer who believe that continuing to burn fossil fuels for energy is not sustainable and that a transition to renewable energy is feasible. Let us start the discussion by reflecting on what sustainability of certain development is all about. “Sustainable development” is characterized as the “development that meets the needs of the present without compromising the ability of future generations to meet their own needs.” Now it becomes clear why continuation of using fossil fuels for energy is not sustainable. First, the combustion of fossil fuels results in the release of carbon dioxide (CO2) and other pollutants (NOx, SOx, particulates, mercury, and other toxic metals) into the atmosphere. The increased atmospheric concentrations of these pollutants cause a series of environmental impacts, including global warming and respiratory health effects. Second, the rate at which we consume fossil fuels is much higher than the rate at which they are replenished so mankind cannot rely on this source of energy forever.
The main candidates for facing this dual challenge of carbon dioxide (CO2) emissions and fossil fuel depletion are coal with carbon capture and sequestration (CCS), nuclear, and renewable sources of energy. However, safe and economic concepts for carbon sequestration have not been proven; nuclear suffers from high cost, radioactive waste management, fuel availability, and nuclear weapon proliferation issues; and renewables have been limited by resource limits, high cost, and intermittency problems. Biomass could be a substitute for fossil fuels, but enough land or water to both meet the demand for power and to feed the world’s growing population is not available. Solar energy has huge potential—tens or hundreds of terawatts (TW) are practical, but it suffers from intermittency. Wind resources are less abundant and even more variable than solar, but in many regions they can complement the variability of solar resources.
The cost challenge for solar electricity is being resolved as recent drastic cost reductions in the production of photovoltaics (PV) paved the way for enabling solar technologies to become cost competitive with fossil fuel energy generation. Such cost competitiveness, called “cost grid parity,” has already been accomplished for parts of the southwest United States, Chile, Spain, Italy, and other countries. PV rooftop systems and utility power plants are relatively easy to build and deployment grows fast. Nevertheless solar is still a minor contributor in electricity mixtures worldwide as inertia in energy policy is stalling the transformation urgently needed. To this end, our book aims in conveying the great potential of PV and helping accelerate their deployment in a world longing for sustainable development.
1.2 The Sun, Earth, and Renewable Energy
We are entering a new solar age. For the last few hundred years, humans have been using up fossil fuels that took around 400 million years to form and store underground. We must now put huge effort—technological and political—into energy systems that use the sun’s energy more directly. It is one of the most inspiring challenges facing today’s engineers and scientists and a worthwhile career path for the next generation. PV, the subject of this book, is one of the exciting new technologies that is already helping us toward a solar future.
Most politicians and policymakers agree that a massive redirection of energy policy is essential if planet Earth is to survive the 21st century in reasonable shape. The 21st Conference of the Parties (COP21) that brought 190 countries together in Paris in December 2015 agreed that consistent efforts are needed worldwide to keep the global temperature increase to below 2°C, or preferably below 1.5°C.
This is not simply a matter of fuel reserves. It has become clear that, even if those reserves were unlimited, we could not continue to burn them with impunity. The resulting carbon dioxide emissions and increased global warming would lead to a major environmental crisis if we do not curtail the CO2 concentration in the atmosphere and do it soon, before we are locked into irreversible processes. So the danger is now seen as a double‐edged sword: on the one side, fossil fuel depletion and, on the other, the increasing inability of the natural world to absorb emissions caused by burning what fuel remains.
Back in the 1970s there was very little public discussion about energy sources. In the industrialized world we had become used to the idea that electricity is generated in large centralized power stations, often out of sight as well as mind, and distributed to factories, offices, and homes by a grid system with far‐reaching tentacles. Few people had any idea how the electricity they took for granted was produced, or that the burning of coal, oil, and gas was building up global environmental problems. Those who were aware tended to assume that the advent of nuclear power would prove a panacea; a few even claimed that nuclear electricity would be so cheap that it would not be worth metering! And university engineering courses paid scant attention to energy systems, giving their students what now seems a rather shortsighted set of priorities.
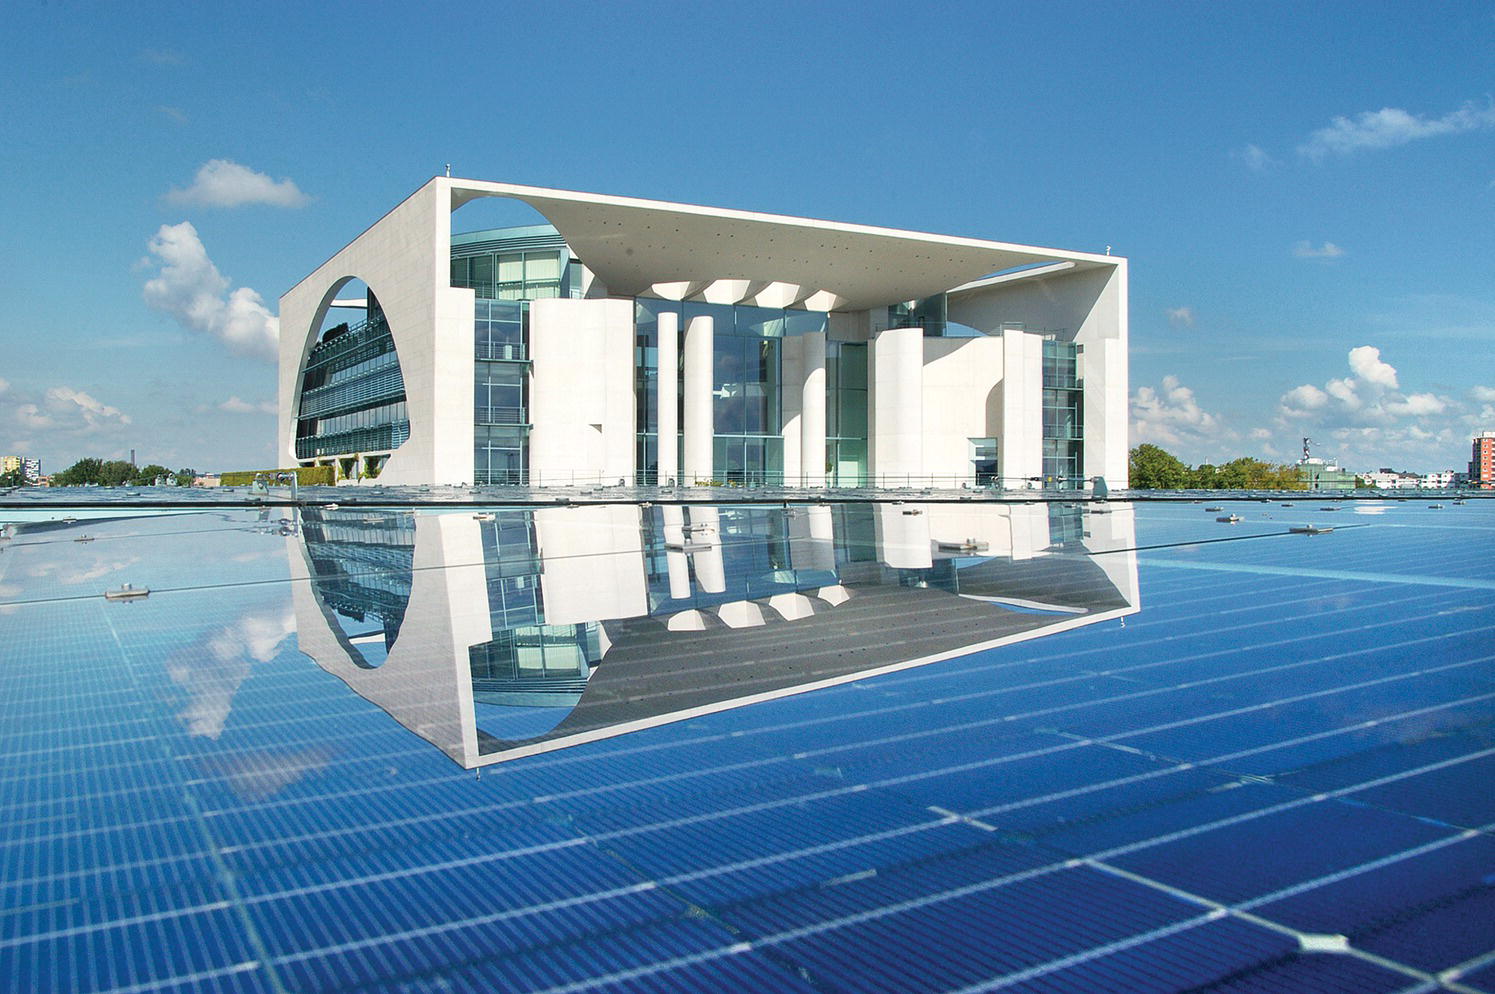
Figure 1.1 Toward the new solar age, this rooftop PV installation at the Mont‐Cenis Academy in Herne, Germany, is on the site of a former coal mine.
(Source: Reproduced with permission of IEA‐PVPS)
Yet even in those years, there were a few brave voices suggesting that all was not well. In his famous book Small is Beautiful,1 first published in 1973, E.F. Schumacher poured scorn on the idea that the problems of production in the industrialized world had been solved. Modern society, he claimed, does not experience itself as part of nature, but as an outside force seeking to dominate and conquer it. And it is the illusion of unlimited powers deriving from the undoubted successes of much of modern technology that is the root cause of our present difficulties. In particular, we are failing to distinguish between the capital and income components of the Earth’s resources. We use up capital, including oil and gas reserves, as if they were steady and sustainable income. But they are actually once‐and‐only capital. It is like selling the family silver and going on a binge.
Schumacher’s message, once ignored or derided by the majority, is increasingly seen as the essence of sustainable development. For the good of planet Earth and future generations, we have started to distinguish between capital and income and to invest heavily in renewable technologies—including solar, wind, and wave power—that produce electrical energy free of carbon emissions. The message has been powerfully reinforced by former US Vice President Al Gore, whose inspirational lecture tours and video presentation An Inconvenient Truth2 have been watched by many millions of people around the world. Most importantly, the vision was captured by industry leaders who made solar and wind systems affordable and continue to advance them.
Whereas the fossil fuels laid down by solar energy over hundreds of millions of years must surely be regarded as capital, the sun’s radiation beamed at us day by day, year by year, and century by century is effectively free income to be used or ignored as we wish. This income is expected to flow for billions of years. Nothing is “wasted” or exhausted if we don’t use it because it is there anyway. The challenge is to harness such renewable energy effectively, designing and creating efficient and hopefully inspiring machines to serve humankind without disabling the planet.
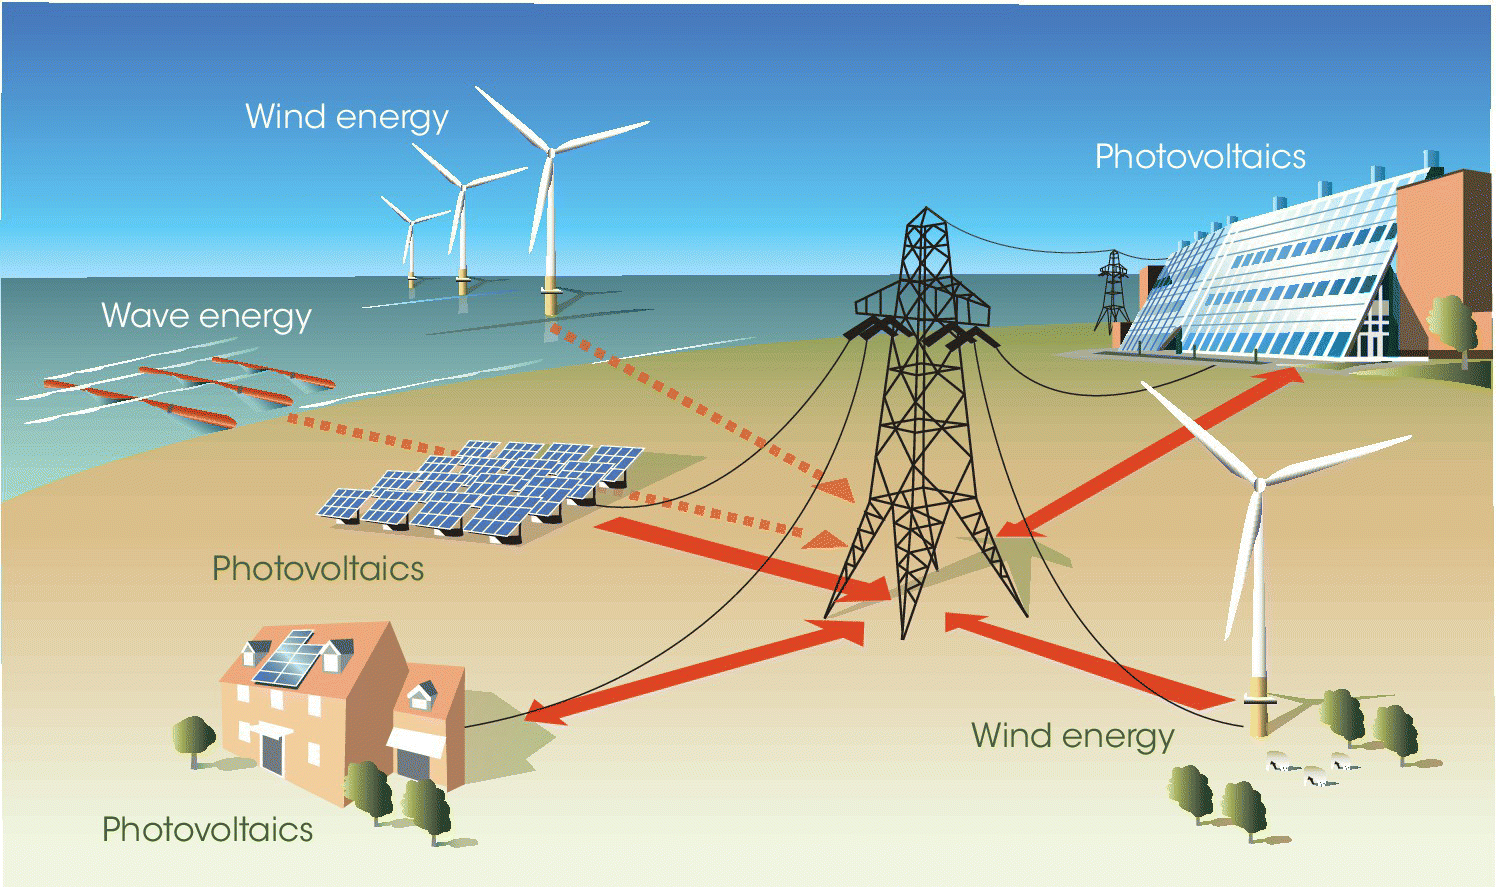
Figure 1.2 Three important renewable technologies: PV, wind, and wave.
We should perhaps consider the meaning of renewable energy a little more carefully. It implies energy that is sustainable in the sense of being available in the long term without significantly depleting the Earth’s capital resources, or causing environmental damage that cannot readily be repaired by nature itself. In his excellent book A Solar Manifesto,3 the late German politician Hermann Scheer considered planet Earth in its totality as an energy conversion system. He notes how, in its early stages, human society was itself the most efficient energy converter, using food to produce muscle power and later enhancing this with simple mechanical tools. Subsequent stages—releasing relatively large amounts of energy by burning wood and focusing energy where it is needed by building sailing ships for transport and windmills for water pumping—were still essentially renewable activities in the previously mentioned sense.
What really changed things was the 19th‐century development of the steam engine for factory production and steam navigation. Here, almost at a stroke, the heat energy locked in coal was converted into powerful and highly concentrated motion. The industrial society was born. And ever since we have continued burning coal, oil, and gas in ways that pay no attention to the natural rhythms of the Earth and its ability to absorb wastes and by‐products, or to keep providing energy capital. Our approach has become the opposite of renewable and it is high time to change priorities.
Since the reduction of carbon emissions is a principal advantage of PV, wind, and wave technologies, we should recognize that this benefit is also proclaimed by supporters of nuclear power and carbon dioxide capture and carbon sequestration (CCS) technologies. But frankly they make strange bedfellows, in spite of sometimes being lumped together as “carbon‐free.” It is true that all offer electricity generation without substantial carbon emissions, but in almost every other respect they are poles apart. The renewables offer the prospect of widespread, both large‐ and small‐scale electricity generations, but nuclear must, by its very nature, continue the practice of building huge centralized power stations. CCS could, in the best case, capture only a part of CO2 emissions, but there are not safe sequestration options, and it would increase health, safety, and environmental impacts at the coal mining areas and in subsequent stages. Both fossil fuels and uranium are depletable resources. PV, wind, and wave need no fuel and produce no waste in operation; the nuclear industry is beset by problems of radioactive waste disposal. On the whole, renewable technologies pose no serious problems of safety or susceptibility to terrorist attack—advantages that nuclear power can hardly claim. And finally there is the issue of nuclear proliferation and the difficulty of isolating civil nuclear power from nuclear weapons production. Taken together these factors amount to a profound divergence of technological expertise and political attitudes, even of philosophy.
It would however be unfair to pretend that renewable energy is the perfect answer. For a start such renewables as PV, wind, and wave are relatively diffused and intermittent. Often, they are rather unpredictable. And although the “fuel” is free and the waste products are minimal, up‐front investment costs tend to be large. There are certainly major challenges to be faced and overcome as we move toward a solar future, and these are discussed comprehensively in this new edition.
Our story now moves on toward the exciting technology of PV, arguably the most elegant and direct way of generating renewable electricity. But before getting involved in the details of solar cells and systems, it is necessary to appreciate something of the nature of solar radiation—the gift of a steady flow of energy income that sustains life on the planet.
Figure 1.3 The promise of photovoltaics.
(Source: Reproduced with permission of European Photovoltaic Industry Association)

Figure 1.4 A rooftop residential system at Long Island, New York (Vasilis Fthenakis).
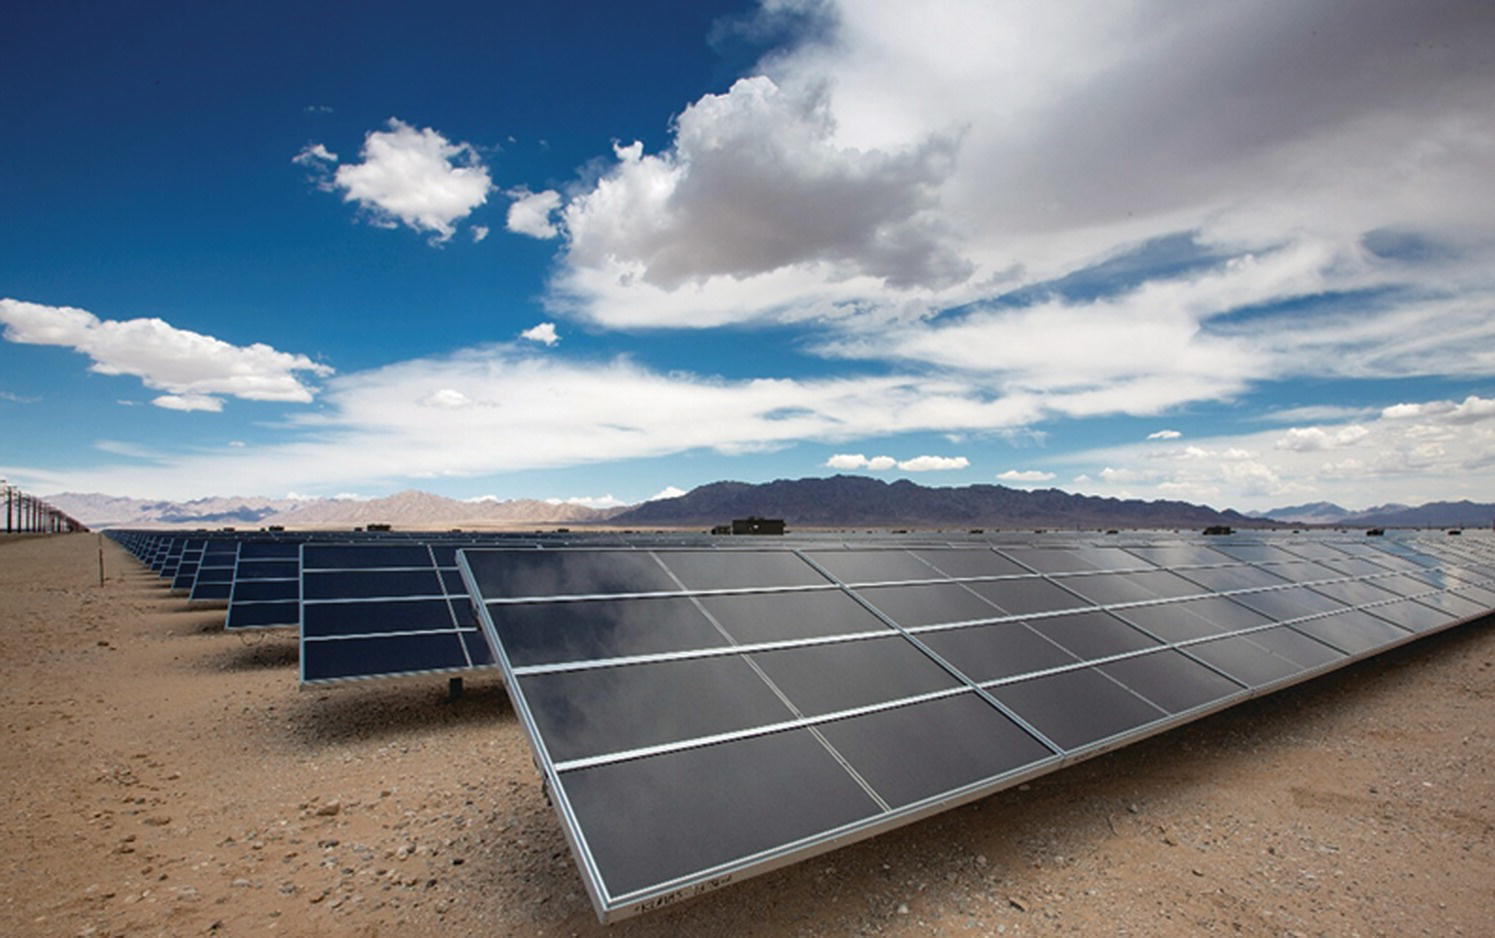
Figure 1.5 A large PV utility system in South California.
(Source: Reproduced with permission of Desert Sunlight, First Solar/NEXTera Energy)
1.3 The Solar Resource
The sun sends an almost unimaginable amount of energy toward planet Earth—around one hundred thousand TW; 1 TW is 1 trillion watts. In electrical supply terms this is equivalent to the output of about 100 million modern fossil fuel or nuclear power stations. To state it another way, the sun provides in about an hour the present energy requirements of the entire human population for a whole year. It seems that all we need do to convert society “from carbon to solar” is to tap into a tiny proportion of this vast potential.
However some caution is needed. The majority of solar radiation falls on the world’s oceans. Some is interrupted by clouds and a lot more arrives at inconvenient times or places. Yet, even when all this is taken into account, it is clear that the sun is an amazing source of energy, an enormous fusion reactor at a safe distance from the Earth. The opportunities for harnessing its energy, whether represented directly by sunlight or indirectly by wind, wave, hydropower, or biomass, seem limited only by our imagination, technological skill, and political determination.
The sun’s power density (i.e., the power per unit area normal to its rays) just above the Earth’s atmosphere is known as the solar constant and equals 1366 W/m2. This is reduced by around 30% as it passes through the atmosphere, giving an insolation at the Earth’s surface of about 1000 W/m2 at sea level in the early afternoon on a clear day. This value is the accepted standard for “strong sunshine” and is widely used for testing and calibrating terrestrial PV cells and systems.
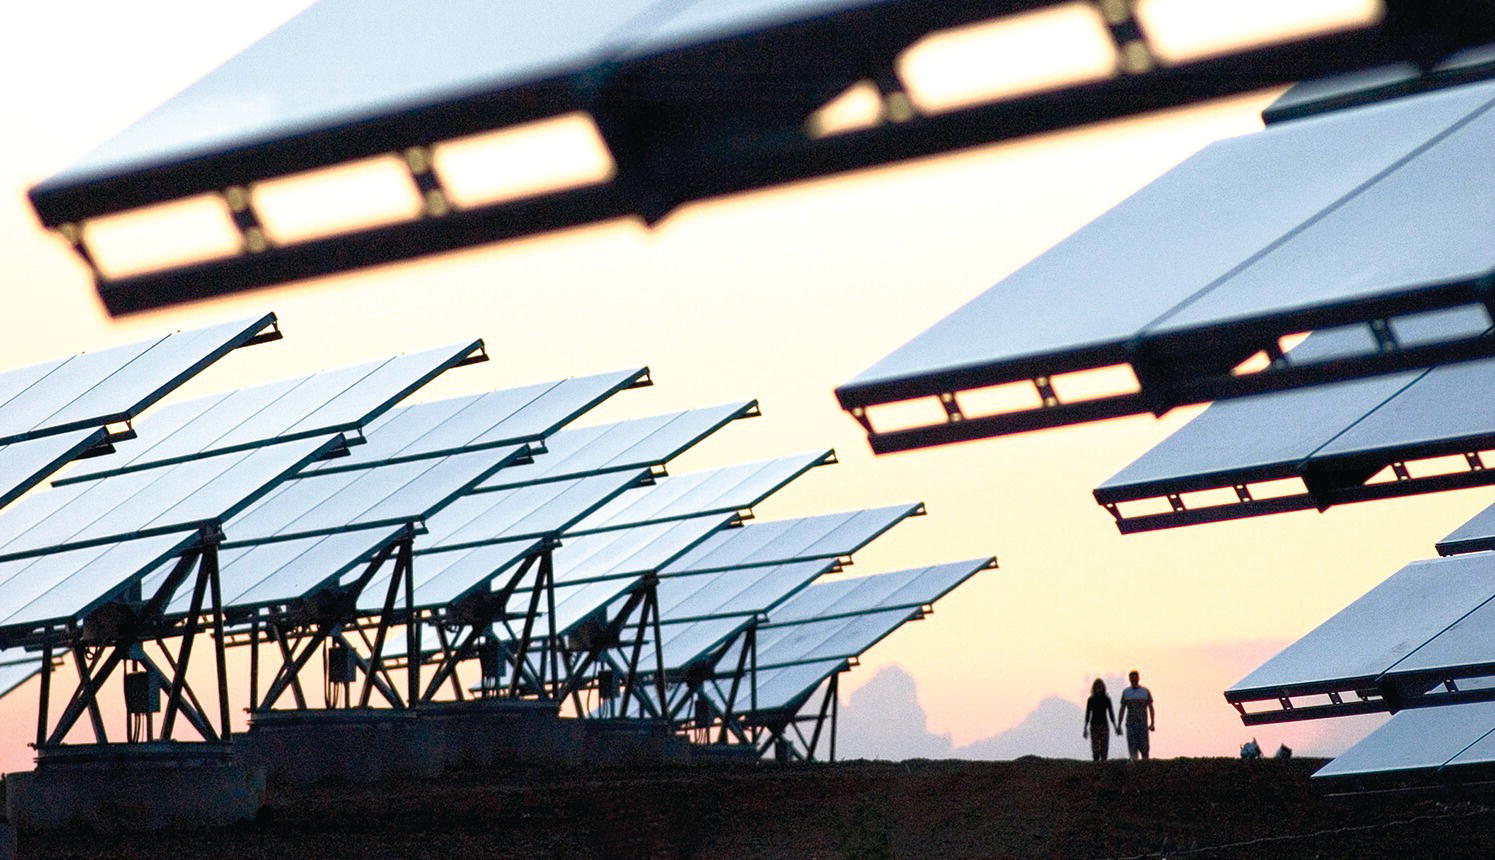
Figure 1.6 Energy for ever: an installation in Austria.
(Source: Reproduced with permission of IEA‐PVPS)
Another important quantity is the average power density received over the whole year, known as the annual mean insolation. A neat way of estimating it is to realize that, as seen from the sun, the Earth appears as a disk of radius R and area πR2. But since the Earth is actually spherical with a total surface area 4πR2, the annual mean insolation just above the atmosphere must be 1366/4 = 342 W/m2. However it is shared very unequally, being about 430 W/m2 over the equator, but far less toward the polar regions that are angled well away from the sun. The distribution is illustrated in the upper half of Figure 1.7.
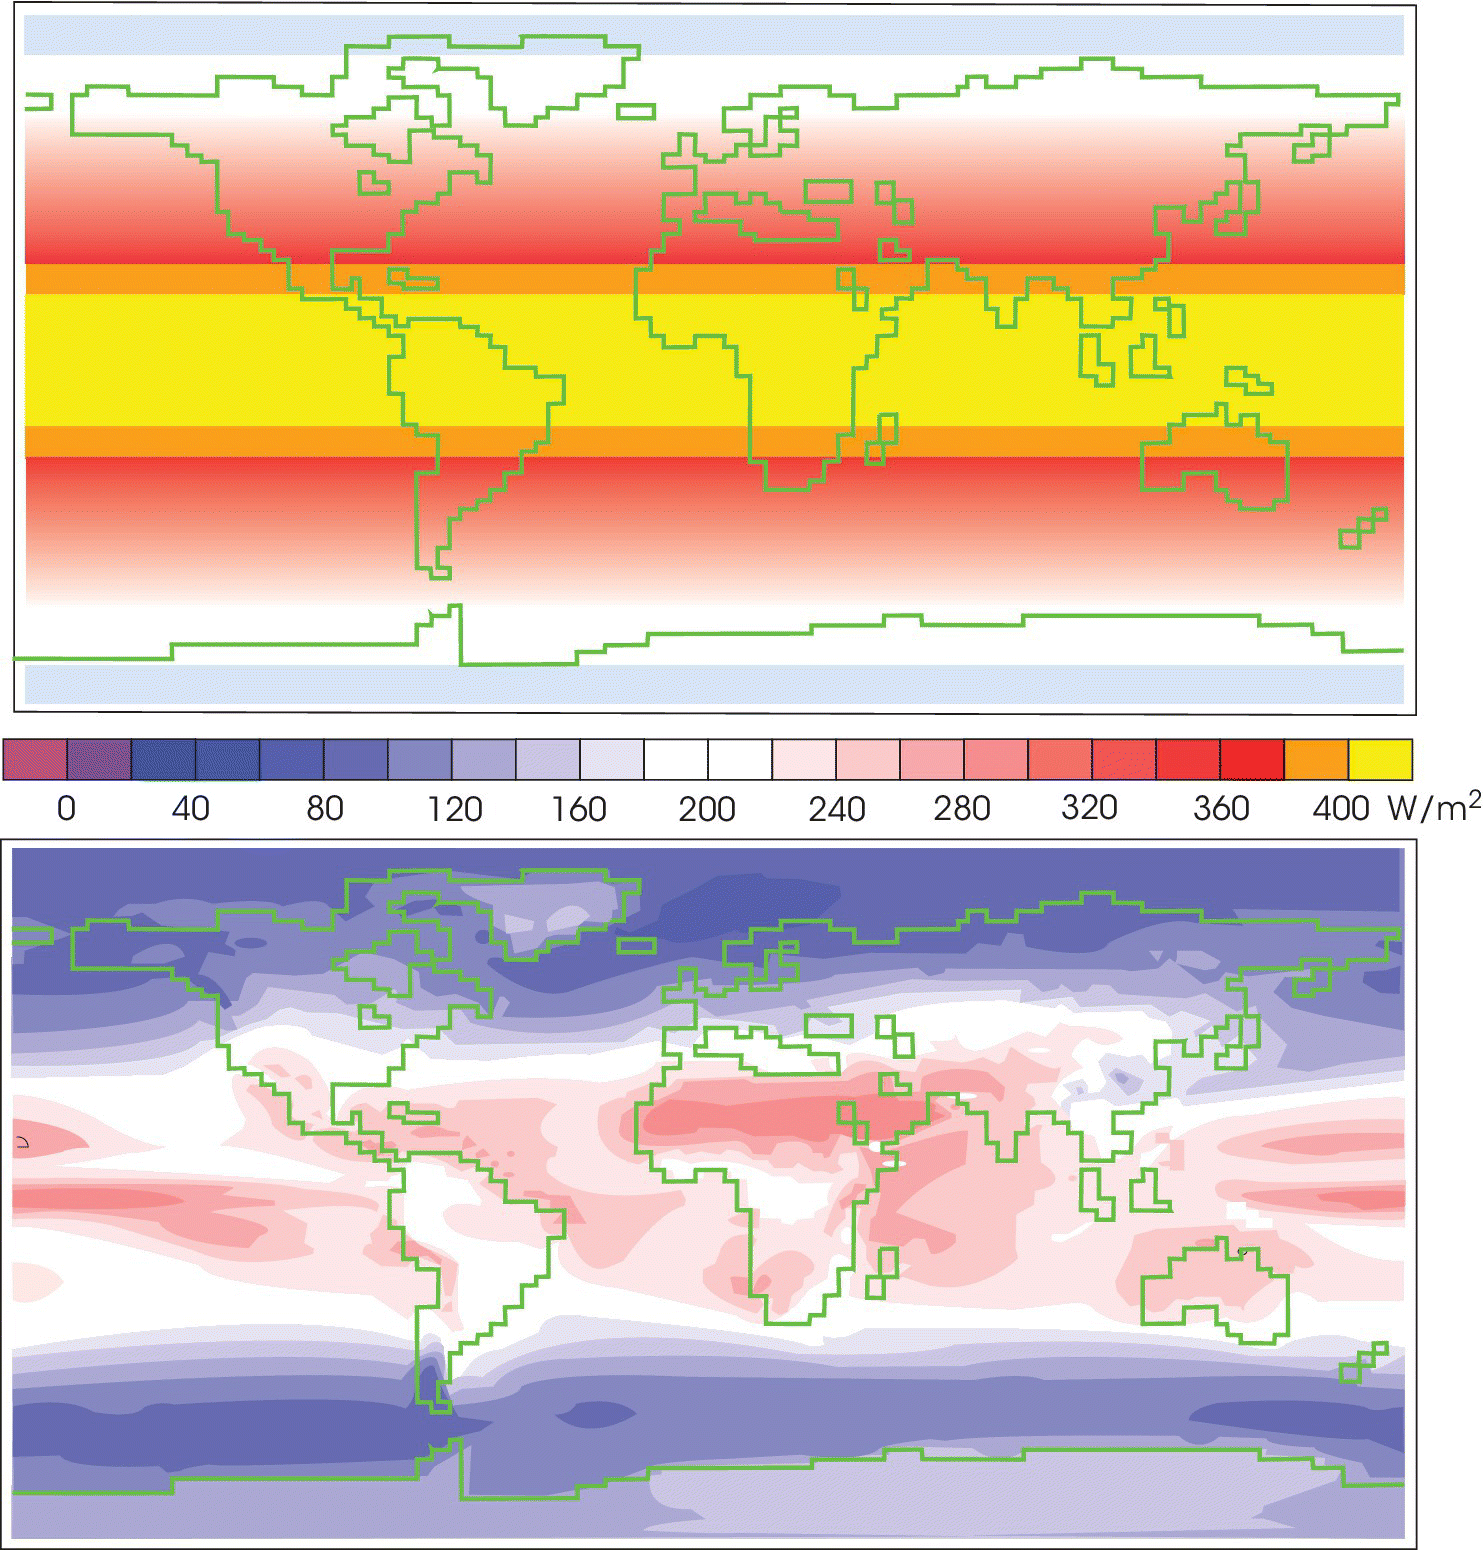
Figure 1.7 Annual mean insolation just outside the Earth’s atmosphere (top) and at the Earth’s surface (bottom).
(Source: Adapted from Wikipedia)
The lower half of the figure shows the reduction in insolation caused by the Earth’s atmosphere. Absorption by gases and scattering by molecules and dust particles are partly responsible. Clouds are a major factor in some regions. We see that the daily (24‐hour) average insolation at the Earth’s surface is greatly affected by local climatic conditions, ranging from about 300 W/m2 in the Sahara Desert and parts of the Pacific Ocean to less than 80 W/m2 near the poles. Hourly irradiance levels on planes that track the sun’s movement could reach and even exceed 1000 W/m2 during clear summer days in sunny locations.
If we know the average insolation at a particular location, it is simple to estimate the total energy received over the course of a year (1 year = 8760 hours). For example, London and Berlin, both with annual mean insolation of about 120 W/m2, have annual energy totals of about 120 × 8760/1000 = 1050 kWh/m2. Sydney’s mean of about 200 W/m2 is equivalent to 1750 kWh/m2. These levels correspond to total (direct and diffuse) irradiation over a horizontal plane, called global horizontal irradiation (GHI). The highest GHI levels are measured in subtropical arid climates where many deserts lie. The high altitude Atacama Desert in North Chile receives a GHI as high 2530 kWh/m2/year. However, higher irradiation levels can be obtained over the course of the year if the plane of incidence is tilted at an angle approximately equal to the latitude of a location, and even higher irradiation can be harvested if the plane tracks the movement of the sun. For example, global irradiation on a latitude tilt plane at the Atacama is 3160 kWh/m2/year and at a one‐axis sun‐tracking plane is 3900–4000 kWh/m2/year. Irradiation measurements and conversions on different planes are discussed in Chapter 3.
Such figures are useful to PV system designers who need to know the total available solar resource. However, we must remember that they are averaged over day and night, summer and winter, and are likely to vary considerably from year to year. It is also interesting to speculate how far global warming, with its interruptions to historical weather patterns, may affect them in the future.
So far we have not considered the sun’s spectral distribution—that is, the range and intensity of the wavelengths in its emitted radiation. This is a very important matter because different types of solar cell respond differently to the various wavelengths in sunlight. It is well known that the sun’s spectrum is similar to that of a perfect emitter, known as a black body, at a temperature of about 6000 K. The smooth curve in Figure 1.8 shows that such black‐body radiation spreads over wavelengths between about 0.2 and 2.0 µm, with a peak around 0.5 µm. The range of wavelengths visible to the human eye is about 0.4 µm (violet) to 0.8 µm (red). Shorter wavelengths are classed as ultraviolet (UV) and the longer ones as infrared (IR). Note how much of the total spectrum lies in the IR region.
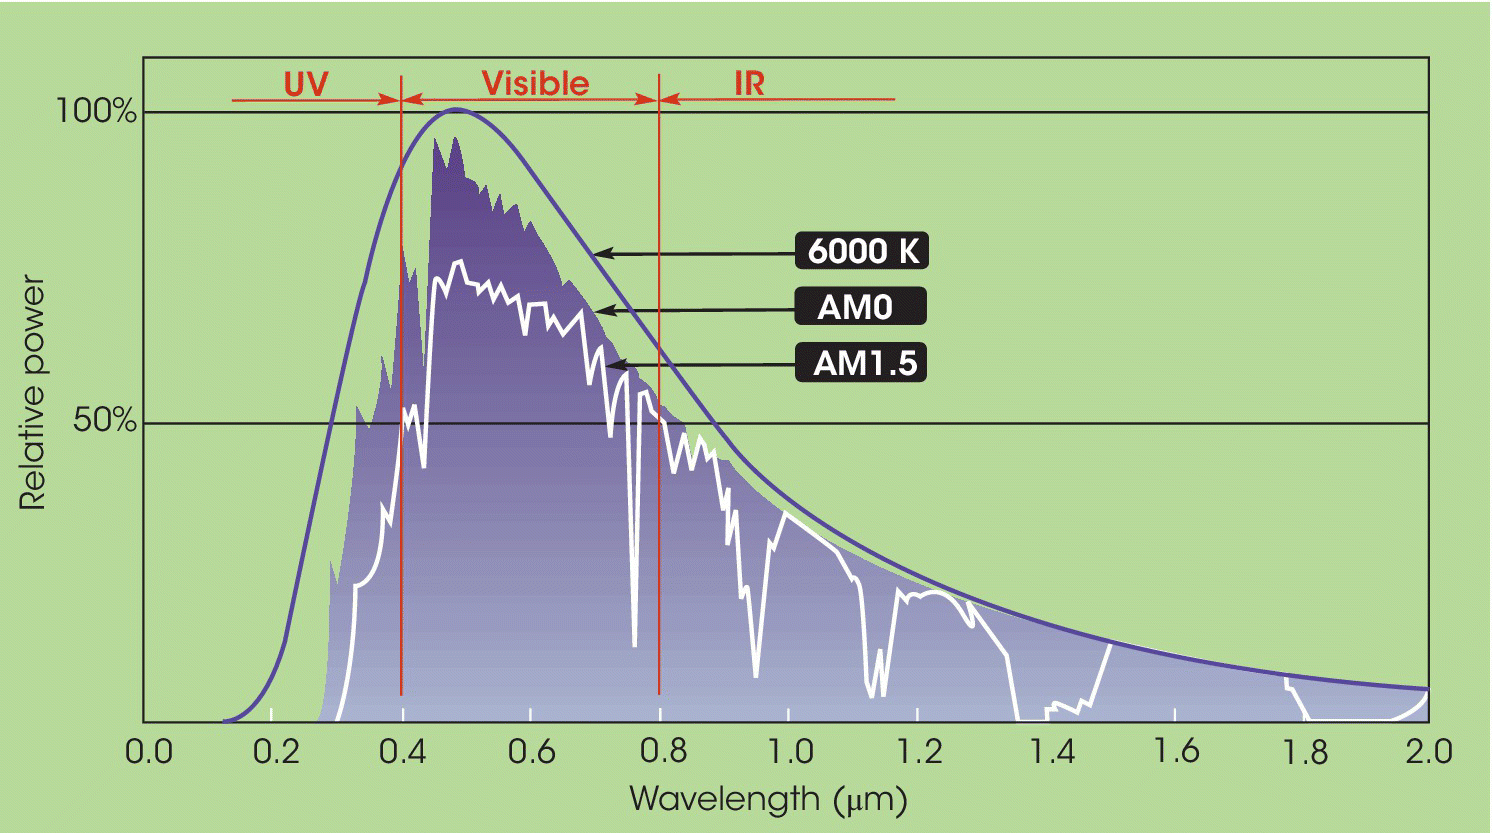
Figure 1.8 Spectral distributions of solar energy.
The figure shows two more curves, labeled AM0 and AM1.5, representing actual solar spectral distributions arriving at Earth. To explain these we need to consider the pathlength or air mass (AM) of sunlight through the atmosphere. AM0 refers to sunlight just outside the atmosphere (pathlength zero) and is therefore relevant to PV used on Earth satellites. In the case of terrestrial PV, the pathlength is the same as the thickness of the atmosphere (AM1) when the sun is directly overhead. But if it is not overhead, the path length increases according to an inverse cosine law. The widely used AM1.5 curve, shown in the figure, represents the early afternoon conditions when the solar beam to Earth is 48.2° from overhead and is generally accepted as a good average for assessing PV cells and systems. The deep notches of the AM1.5 curve are due to absorption by oxygen, water vapor, and carbon dioxide. AM2 conditions would correspond to the sun being lower at the horizon (60° from overhead).
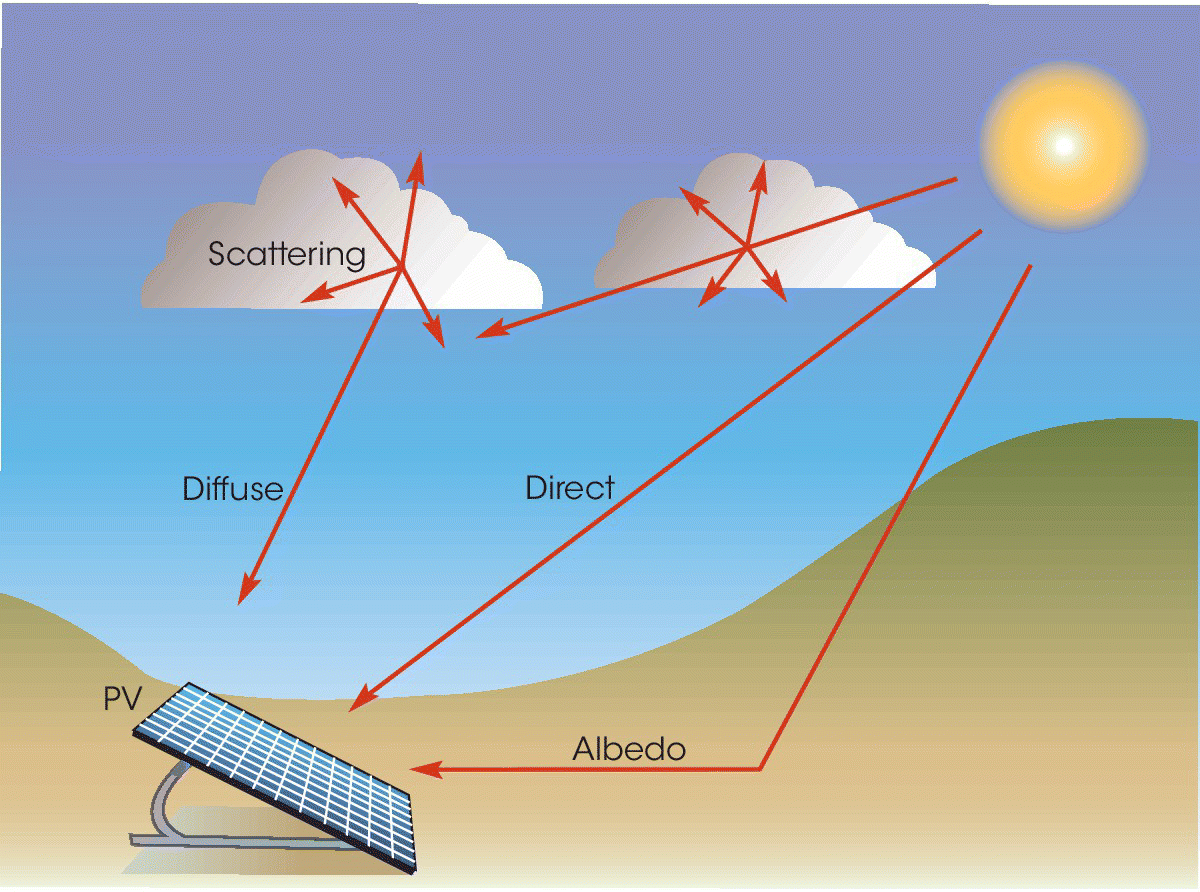
This is not quite the whole story because when solar cells are installed at or near ground level, they generally receive indirect as well as direct solar radiation. This is shown in Figure 1.10. The diffuse component represents light scattered by clouds and dust particles in the atmosphere; the albedo component represents light reflected from the ground or objects such as trees and buildings. The electrical output from the cells depends on the combined effect of all components—direct, diffuse, and albedo. In strong sunlight the direct component is normally the greatest. But if the cells are pointed away from the sun, or if there is a lot of cloud, the diffuse component may well dominate (clouds also cause blocking, or attenuation, of direct radiation). The albedo contribution is often small but can be very significant in locations such as the Swiss Alps due to strong reflections from fallen snow.
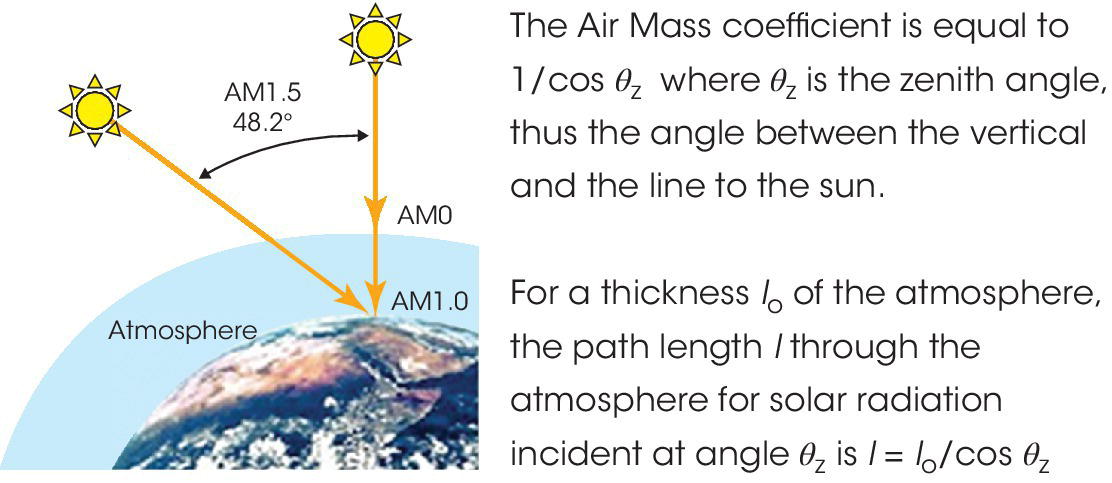
Figure 1.9 Air mass (AM) definitions
We have now covered the main features of solar radiation as it affects terrestrial PV. We shall find this information useful when considering the mounting and orientation of PV cells and modules in Chapter 3.
1.4 The Magic of Photovoltaics
From time to time human ingenuity comes up with a new technology that seems to possess a certain magic. We can all think of examples from the past—the printing press, steam locomotion, radio communication, powered flight, and medical imaging—although our choices inevitably reflect personal tastes and priorities. In most cases such technologies were unimaginable to previous generations and caused amazement and even fear when they appeared. Quite often a technology that promises major social as well as commercial benefits turns out to have rather questionable applications. American aviation pioneers Wilbur and Orville Wright, whose first powered flights at Kitty Hawk in 1903 changed the world forever, initially believed that scouting aircraft would render wars obsolete by allowing each nation to see exactly what the others were doing. But by the end of World War 1, it had become clear that this view was overoptimistic and Orville instead declared that “the aeroplane has made war so terrible that I do not believe any country will again care to start one.” Perhaps we are rather more realistic today and understand that technological advance almost always carries risk as well as social benefit. The magic is not without its downside.
Where does PV fit in the landscape of technological change? Half a century ago few people realized that sunlight could be converted directly into electricity. Even the early pioneers of PV could hardly have guessed that their researches would lead to a worldwide industry providing electricity to millions of people in developing countries. A generation ago it seemed unlikely that PV would branch out from its early success in powering space satellites and come down to Earth. More recently it would have taken courage to suggest that terrestrial PV would move into a multi‐gigawatt era and start rivaling conventional methods of electricity generation in the developed world. From the technical point of view, it is certainly a remarkable story—and one that, on a historical timescale, is still in its early stages.
Just as importantly, it is difficult to see any major downside in PV’s gentle technology. Few people find much to object to in the deployment of solar cells and modules. True, some worry that the aesthetics of existing homes, offices, and public buildings can be marred by having PV attached to them, although this is a matter of taste. There is also the question of land use: It seems that PV takes up a lot of space compared with a conventional power plant, but not if we take account of the whole life cycle of the fuel. For example, the coal life cycle in the United States takes more space than PV for the same amount of electricity generation, because coal surface mining takes a lot of land. Furthermore, PV does not damage the land as coal mining does, and it often uses marginal or unproductive land in deserts or old industrial areas; and unlike wind turbines that offend many people by their visual intrusion, ground‐mounted PV is hardly ever visually aggressive or unattractive. Finally there may be some risk when PV comes to the end of its useful life, but most of the materials involved are benign and the industry is very aware of its environmental credentials and the need for recycling and careful disposal; we discuss this in Chapter 7. All in all the negative impacts of PV seem relatively modest and containable.
Much of PV’s magic is due to its elegance and simplicity. A solar cell turns sunlight directly into electricity without fuel, moving parts, or waste products. Made from a thin slice or layer of semiconductor material, it is literally a case of “photons in, electrons out.” By contrast a fossil fuel or nuclear power station working on a classic thermodynamic cycle turns heat from fuel combustion or nuclear reaction into high pressure steam and then uses the steam to drive a turbine coupled to an electrical generator. This complex chain of events produces undesirable by‐products, including spent fuel and a great deal of waste heat, and in the case of fossil fuels also a lot of carbon dioxide and other greenhouse gases. The high pressures and temperatures at which modern plant is operated put great stresses on materials and components. Small‐scale electricity production using diesel generators has similar disadvantages. Meanwhile the solar cell works silently and effortlessly, a model of operational simplicity. Place it under sunlight and you can tap electricity directly from its terminals.
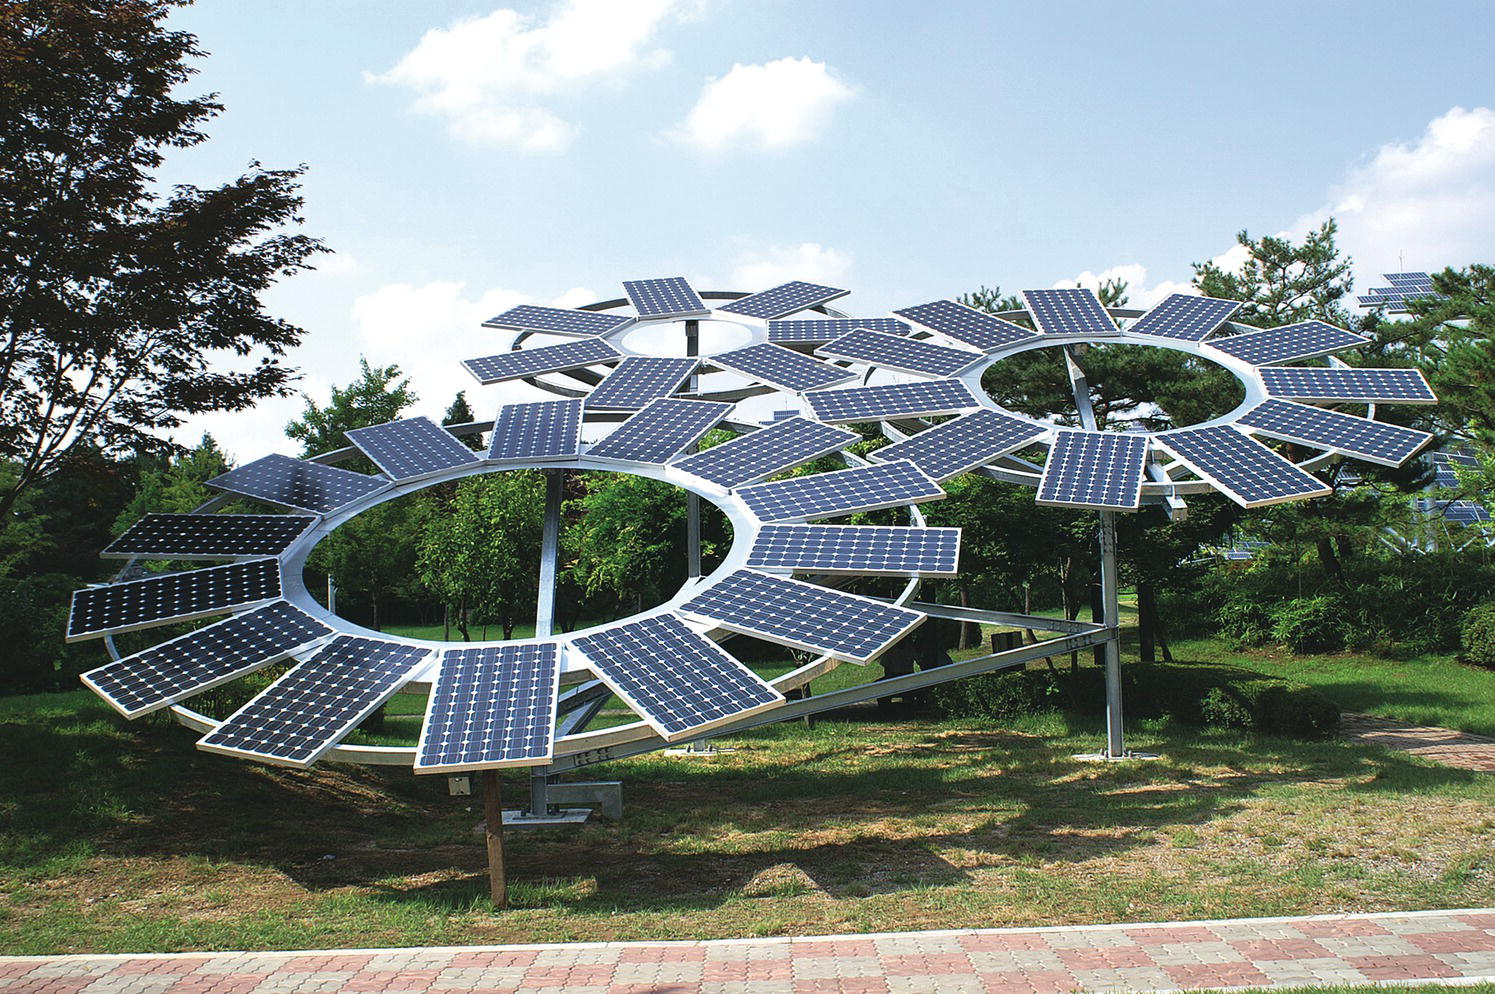
Figure 1.11 A certain magic: “sunflowers” in Korea.
(Source: Reproduced with permission of IEA‐PVPS)
Not that PV is simple science. As we shall see, solar cells are high‐tech products based on more than half a century of impressive research in universities, companies, and government institutes around the world. Their manufacture demands very high standards of precision and cleanliness. And they are strongly related to another modern technology that has a certain magic for many people—semiconductor electronics and computers.
1.5 A Piece of History
Light has fascinated some of the world’s greatest scientists. One of the most famous of them all, Isaac Newton (1642–1727), thought of it as a stream of particles rather like miniature billiard balls. But in the early 19th century, experiments by the English polymath Thomas Young and French physicist Augustin Fresnel demonstrated interference effects in light beams, which include the bands of colors often seen on the surface of soap bubbles. This suggested that light acts as a wave rather like the ripples on a pond—a theory reinforced by James Clerk Maxwell’s work in the 1860s, showing visible light to be part of a very wide spectrum of electromagnetic radiation.
Yet Newton’s “billiard ball” theory refused to go away. The German physicist Max Planck used it to explain the characteristics of blackbody radiation, and it subsequently proved central to Albert Einstein’s famous work on the photoelectric effect in 1905 for which he got the Nobel Prize, in which he proposed that light is composed of discrete miniature particles or packets of energy known as quanta. The subsequent development of quantum theory was one of the great intellectual triumphs of the 20th century. So our modern view is that light has an essential duality: for some purposes we may think of it as a stream of particles and, for others, as a type of wave. The two aspects are complementary rather than contradictory.
The earliest beginnings of PV go back to 1839 when the young physicist Edmond Becquerel, working in his father’s laboratory in France, discovered the PV effect as he shone light onto an electrode in an electrolyte solution. By 1877 the first solid‐state PV cells had been made from selenium, and these were later developed as light meters for photography. Although a proper understanding of the phenomena was provided by quantum theory, practical application to useful PV devices had to await the arrival of semiconductor electronics in the 1950s. Thus, there was a gap of over a hundred years between Becquerel’s initial discovery and the development of PV as we know it today.
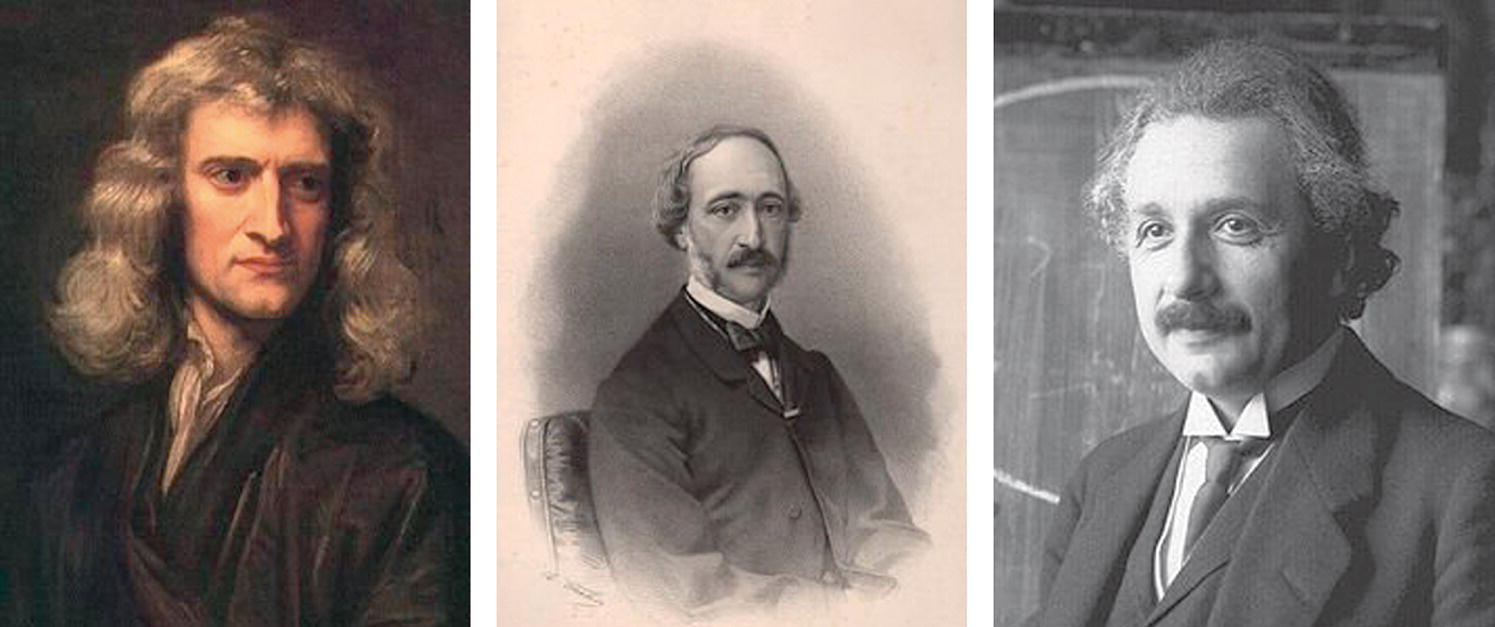
Figure 1.12 Isaac Newton, Edmond Becquerel, and Albert Einstein (Wikipedia).
The story of modern PV has been expertly reviewed in an article by solar cell pioneer Joseph Loferski,4 formerly a professor at Brown University in the United States. Although we must leave aside the technical details of his account, the following broader points will serve well to bring the PV story up toward the 21st century.
The modern PV age may be said to have begun in 1954 with the work of researchers at the Bell Telephone and RCA laboratories, who reported new types of semiconductor devices, based on silicon and germanium, that were an order of magnitude more efficient than previous cells at converting radiation directly into electricity. The fledgling PV community hoped that this would lead to new applications for solar cells including electrical power generation. However their hopes were not realized, in part because that decade was a time of great expectations for nuclear energy. Sceptics believed that solar energy was too diffuse and intermittent, and the new devices far too expensive. At that moment in history, PV looked rather like a solution in search of a problem.
What changed the situation almost overnight was the launch of the first Earth satellite, the USSR’s Sputnik, in 1957. Satellites and solar cells—even expensive ones—were made for each other. The early satellites needed only a very modest amount of electricity, and the weight and area of solar panels needed to produce this were acceptable to satellite designers. Also, the types of cell made in 1954 were proving reliable and seemed likely to operate in the space environment for many years without significant deterioration. The first US research satellite using a PV power supply was launched in 1958. It was the size of a large grapefruit. Its solar cells covered an area of about 100 cm2 and produced just a few tens of milliwatts. In 1962 the first‐ever commercial telecommunication satellite, Telstar, was launched with sufficient solar cells to produce 14 W from the sun (Figure 1.13). By the early 1970s, space satellites powered by solar cells had become quite commonplace. PV in space had already made its mark.
The possibilities for “bringing PV down to Earth” depended crucially on lowering the price of solar cells. In 1970 the US price was around $300/Wp (we normally quote solar cell power in peak watts (Wp), being the rated power at a standard insolation of 1000 W/m2). This was acceptable for extremely expensive space satellites, but hopeless for terrestrial electricity production on a significant scale. What encouraged PV researchers to hold on to their dream was the realization that prices would almost certainly fall dramatically as production levels rose, in accordance with the well‐known “learning curve” concept. Experience had shown that, for every doubling of cumulative production of a wide range of manufactured products, price tended to drop between 10 and 30%. For mature technologies such as steel or electric motors, such doubling, given the high current production levels, would require many decades. But a fledgling technology like PV had many doublings of cumulative production to look forward to, so major reductions in cost could be expected over a comparatively short timescale. Indeed, it was predicted that by the time cumulative PV cell production reached gigawatt levels (1 GW being equal to 1000 MW), as required for serious terrestrial application, the price would have dropped nearer to $1/Wp. As with other technologies, new inventions and manufacturing systems that could not be visualized would arise, unpredictable political and economic factors would occur, and the price would be driven down.
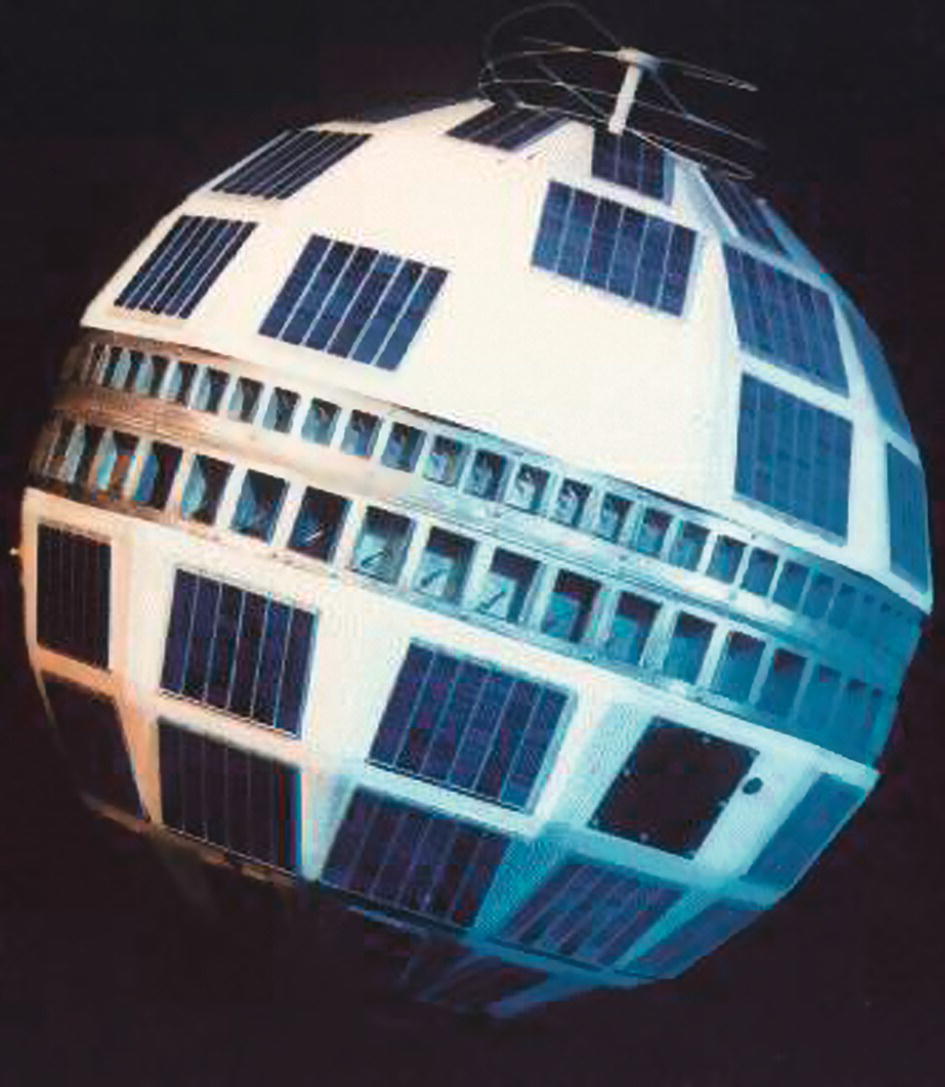
Figure 1.13 Telstar 1, the first commercial telecommunication satellite; diameter approximately 0.8 m; weight 77 kg.
(Source: Courtesy of NASA)
This apparently bold prognosis, which helped lift the gloom and spurred the PV community on to ever‐greater efforts, proved farsighted. The actual “learning curve” for world PV production over the period 1987–2016 is shown in Figure 1.14, plotted on logarithmic scales in terms of US dollars per peak watt against cumulative peak megawatts (MWp). We see that as cumulative production advanced from 100 MWp in 1987 to 1000 MWp in 1999, the cost per peak watt fell from about $15 to $7. Another tenfold advance to 10 000 MWp was achieved in 2007 and the cost reduced to around $3.0. At that time a new technology, thin‐film cadmium telluride (CdTe), was introduced in the market and quickly became the lowest production cost technology combining quick processing and economy on semiconductor materials. The market growth continued, accounting to annual growth rates of 44% in the period of 2000–2015.
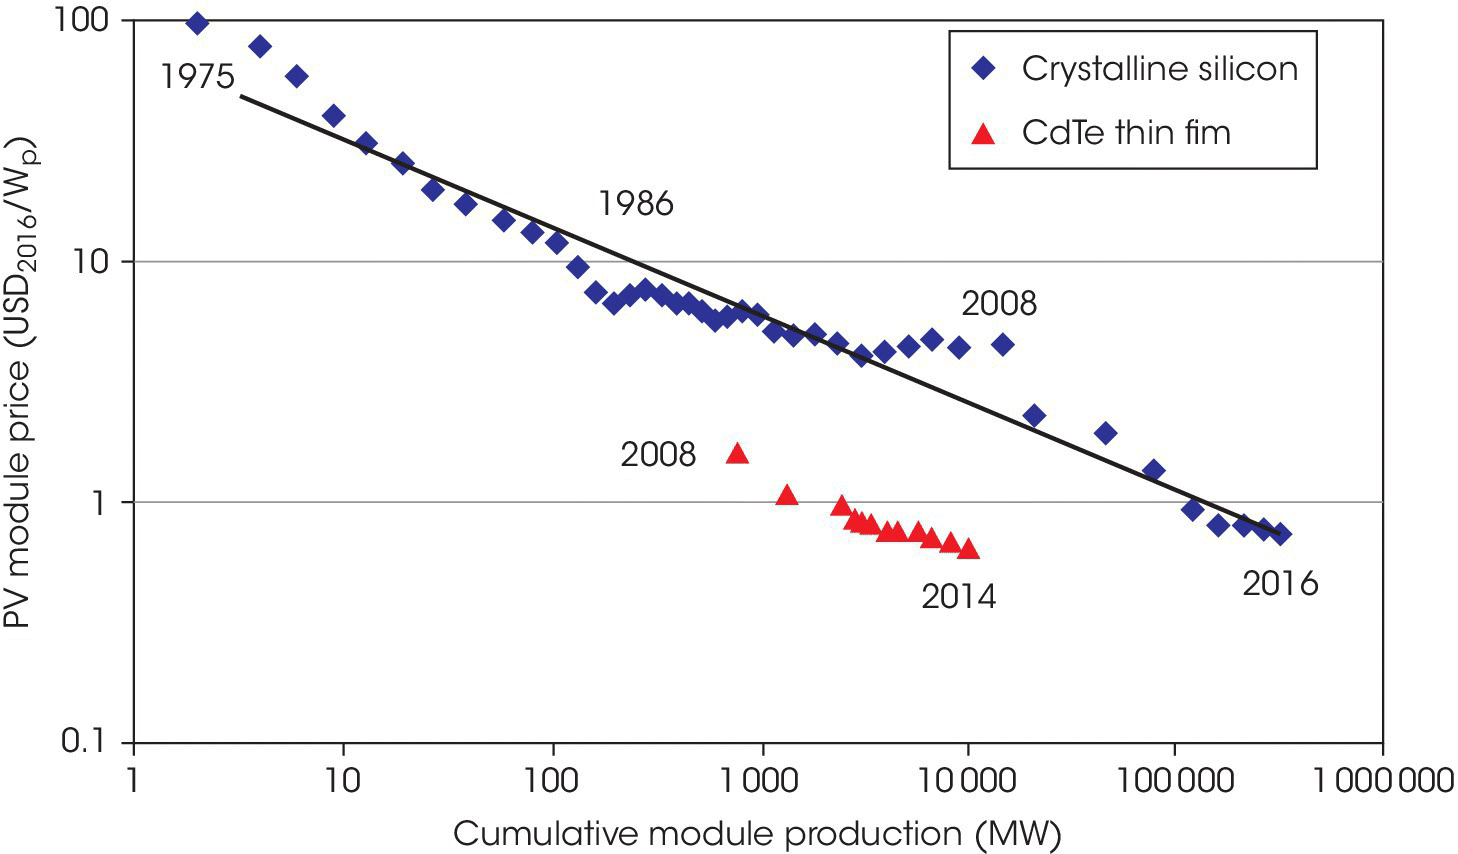
Figure 1.14 The “learning curve” (price‐experience curve) for PV modules.
(Source: A. Jäger‐Waldau; PV Status Report 2016; EUR 28159 EN)
As of 2017, the cumulative production of crystalline Si PV has grown to 200 000 MW (200 GW), and the lowest module cost, for modules made in China, has decreased to $0.40/W of rated power. CdTe PV modules made in the United States and Malaysia have been also produced at such low costs. This outstanding trend corresponds to an average cost reduction of about 20% for every doubling of cumulative production. PV has become truly competitive with conventional electricity generation in several regions. The costs of the balance of system components (i.e., power electronics, structures, installation) were not reduced as rapidly as the module costs with the total installed system costs being in the range of $1–1.5/W for large utility systems and $2–4/W for residential rooftop systems. We expect that PV costs will continue to decrease as technologies and systems integration improves and their cost is reaching parity with conventional electricity in regions of tropical and subtropical climates. These are exciting times!
Returning now to our historical review, the renewed optimism of the PV community, based on “learning curve” predictions, was bolstered by the first “oil shock” in 1973 when oil‐producing countries decided greatly to increase the price of crude oil and exert more control over its supply. Funding for PV research and development (R&D) in the United States under President Jimmy Carter then increased dramatically. Unfortunately, government support was subsequently cut back hard by President Ronald Reagan’s administration from 1980 onward, but great advances had already been made, and major PV research programs in Germany and Japan were adding their own important contributions. The efficiencies of solar cells were constantly being raised; new PV materials and cell structures were being investigated, and, on the applications front, a range of PV power plants emerged with multi‐megawatt capacity. In 1985 Professor Martin Green’s group at the University of New South Wales in Australia pushed the efficiency of new design of silicon cells above the 20% barrier—some four times higher than the cells that had heralded the arrival of the modern PV age in 1954. By 1990 the same group achieved efficiencies of 24% in the lab, and it has continued as a major pacesetter for crystalline silicon cells, the long‐term workhorse of the PV industry. Also during the 1980s, Professor Richard Swanson’s group at Stanford developed the point‐contact solar cell, with laboratory cell records of 28% in concentrator cells and 23% in one‐sun cells. Dr. Swanson founded SunPower in 1985, which today is the world’s leader in high‐efficiency solar cells offering modules of 21.5% efficiency, composed of 24% efficient cells.
The early 1990s proved also to be crucial for thin‐film PV with CdTe leading the way. Photon energy in Colorado was first to raise the CdTe cell efficiency above 12%. Ting and Shirley Chu—University of South Florida professors—improved it to 14.6%; and in the summer of 1992, their former students Christos Ferekides and Jeff Britt raised it to near 16%. This record was held for nearly 10 years with the National Renewable Energy Laboratory increasing the record research cell efficiency to 16.5% in 2001. The technology was commercialized by First Solar, which in 2007 was able to produce 10% efficient modules at a cost of only a dollar per watt. First Solar led the global PV industry in module cost reductions and as of 2016 they produced 16.6% efficient modules at only $0.40/Wp, while on schedule for further improvements toward their record efficiency of 21.5%.
The pace of PV research, development, and application for all technologies continues unabated today. Growing awareness of global warming and the vital role of the renewable energies in combating it have ensured that governments around the world appreciate the need to encourage and stimulate PV, and we are now in the multi‐gigawatt era. This must have been almost unimaginable half a century ago.
At the end of his 1993 article, Joseph Loferski noted that the blossoming PV edifice was destined to grow manyfold again. The small band of researchers who had ushered in the modern PV age in the 1950s had multiplied into “a band of brothers and sisters, we happy few,” who shared the dream that solar PV electricity was destined for an ever‐greater future in the service of humanity. From today’s perspective, his vision and optimism seem entirely justified.
1.6 Coming Up to Date
How can we summarize the current status of a technology such as PV that has been, and still is, experiencing dramatic growth? Today’s research and development, novel PV installations, and global statistics will very soon seem history. But fortunately certain trends that have developed over the past 15 or 20 years seem likely pointers to the future. We can discuss these trends more easily by dividing PV systems into two broad categories: grid‐connected systems (also called grid‐tied systems) that feed any surplus PV electricity into a grid and accept electricity from the grid when there is a solar deficit and stand‐alone systems that are self‐contained and not tied to a conventional electricity grid. These categories may usefully be subdivided as follows:
Grid‐connected systems
- Building‐integrated photovoltaics (BIPV) and rooftop systems on houses, offices, factories, and other commercial premises (or on adjacent land)—covering a wide power range from 1 kWp to several MWp
- Land‐based PV power plants, often remote from individual electricity consumers—typically 10–150 MWp, with a few up to 550 MWp
Stand‐alone systems
- Low‐power solar home systems (SHSs), supplying small amounts of electricity to individual homes in developing countries—typically 30–100 Wp
- Higher‐power systems for isolated homes and buildings in the developed world—typically 1–20 kWp
- PV systems for a wide range of applications, including water pumping and irrigation, isolated telecommunications equipment, marine buoys, traffic control signs, and solar‐powered cars and boats
In the 1980s PV started to make a major contribution, supplying small amounts of electricity to the millions of families in “sunshine countries” of the developing world with no access to, or promise of, an electricity grid. This was rightly seen as a noble social objective as well as a commercial opportunity that would increase PV’s international market. However it became increasingly evident that SHSs (item 3 earlier) could not, by themselves, boost global production toward the levels dreamed of by the PV community. A typical SHS requires only one small PV panel, but even so the “up‐front” costs cannot easily be afforded by individual families in developing countries without effective government financing schemes that are not always forthcoming. And maintenance problems (generally with batteries or other system components rather than the PV itself) can easily reduce reliability. So although the SHS market is socially important and continues to grow, it no longer represents a major plank of the global PV industry.
Various other types of stand‐alone system were steadily developed in the 1980s, often providing valuable PV electricity in remote locations that would otherwise need diesel generators. In addition a number of grid‐connected PV power plants were commissioned, mainly in the United States, by electric utilities keen to assess the commercial possibilities and reliability of the new technology. However, the limited number and scale of all these systems offered little prospect for the exciting expansion of PV needed to make it a major source of electricity.
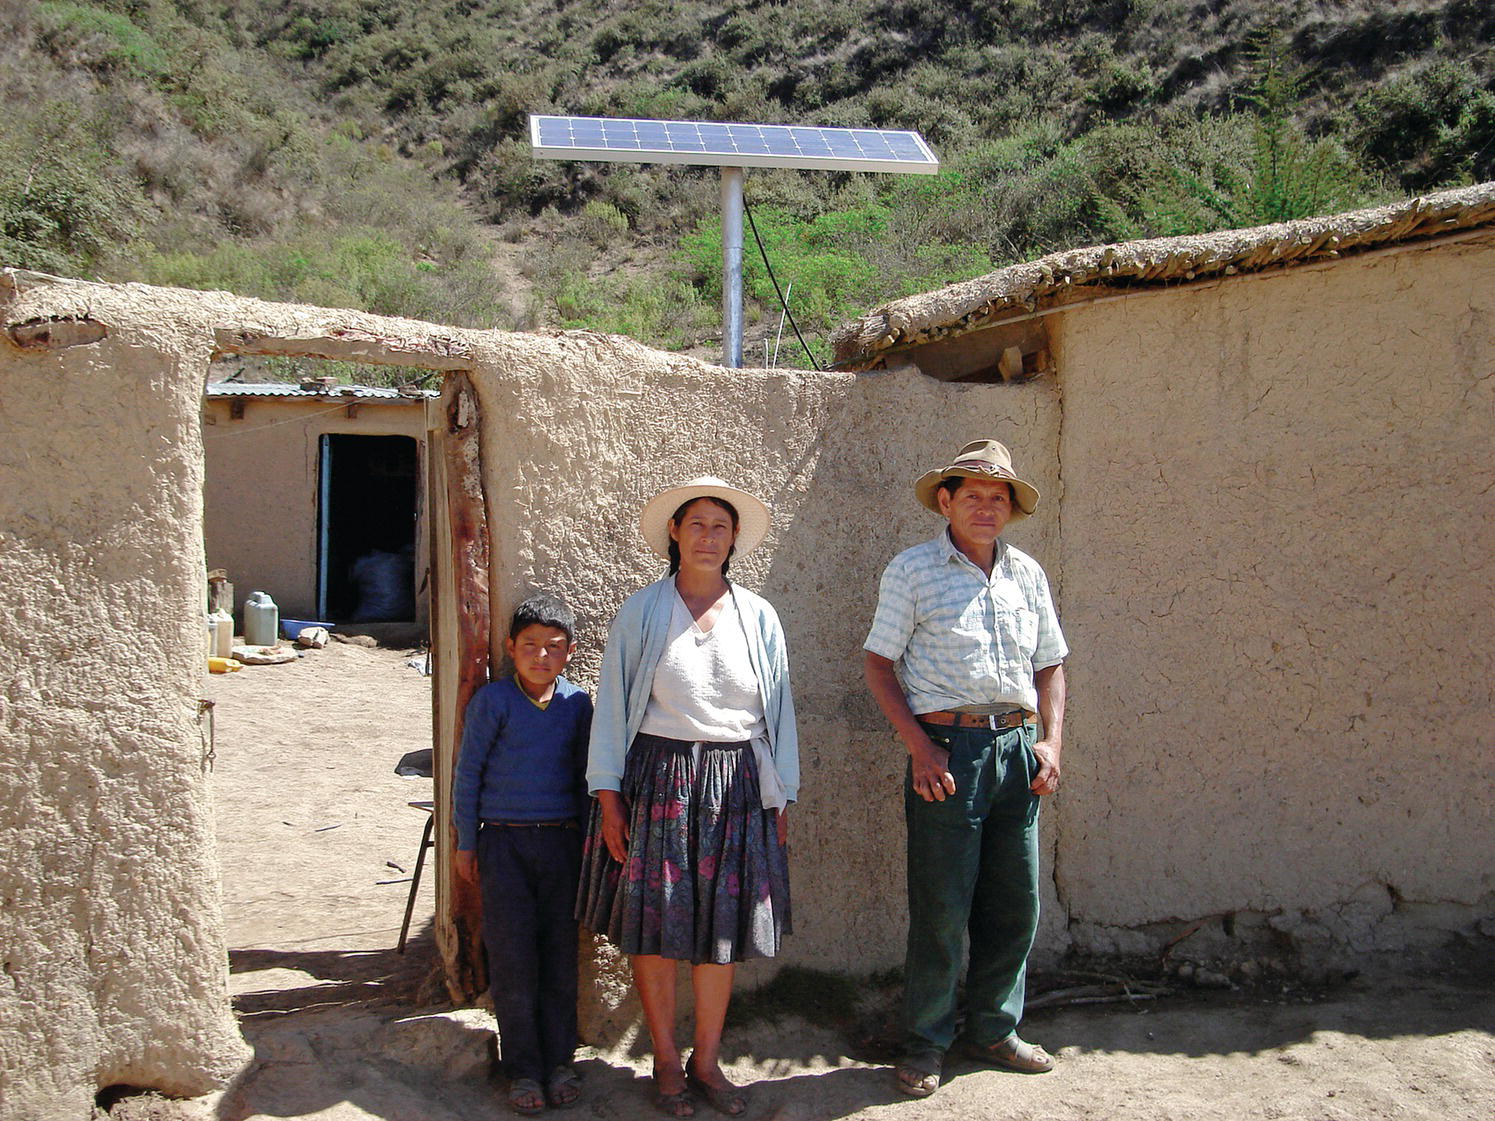
Figure 1.15 This PV module powers a solar home system in Bolivia.
(Source: Reproduced with permission of EPIA/BP Solar)
What really changed the outlook for global PV production was the emphatic shift toward grid‐connected systems in the developed world that got under way in the 1990s. It was the citizens of richer countries that would provide the up‐front costs and market stimulus to propel PV faster along its “learning curve,” leading to price reductions as cumulative production really took off. This policy shift was supported by increasing awareness among governments of the importance of renewable energy for combating climate change, and by the growing enthusiasm of individuals and companies to “do their bit” by installing roof‐top systems, even though the price of solar electricity was not yet competitive. Electricity utilities began to accept that the flow of electricity was not all “one‐way,” allowing customers to be providers as well as consumers and introducing tariffs for feeding electricity back into the grid.
As far as governments are concerned, the price support mechanisms devised for grid‐connected systems have proved crucial. PV is similar to other renewables such as hydroelectric and wind in having high up‐front capital costs and very low running costs. But this can make it hard for families and organizations to find the initial capital, and even harder if they are not guaranteed an attractive price for surplus PV electricity fed back into the grid. In recent years many governments have provided capital grants to encourage people to install domestic PV systems, and the more farsighted ones have introduced feed‐in tariffs that offer long‐term guaranteed payments for renewable electricity. Countries that have given PV a big boost with feed‐in tariffs—especially Germany—have stimulated their home markets and, by doing so, have pushed PV decisively along its “learning curve” into the multi‐gigawatt era. As cumulative world production surges and the price comes down, poorer families in sunshine countries are more likely to get their SHSs.
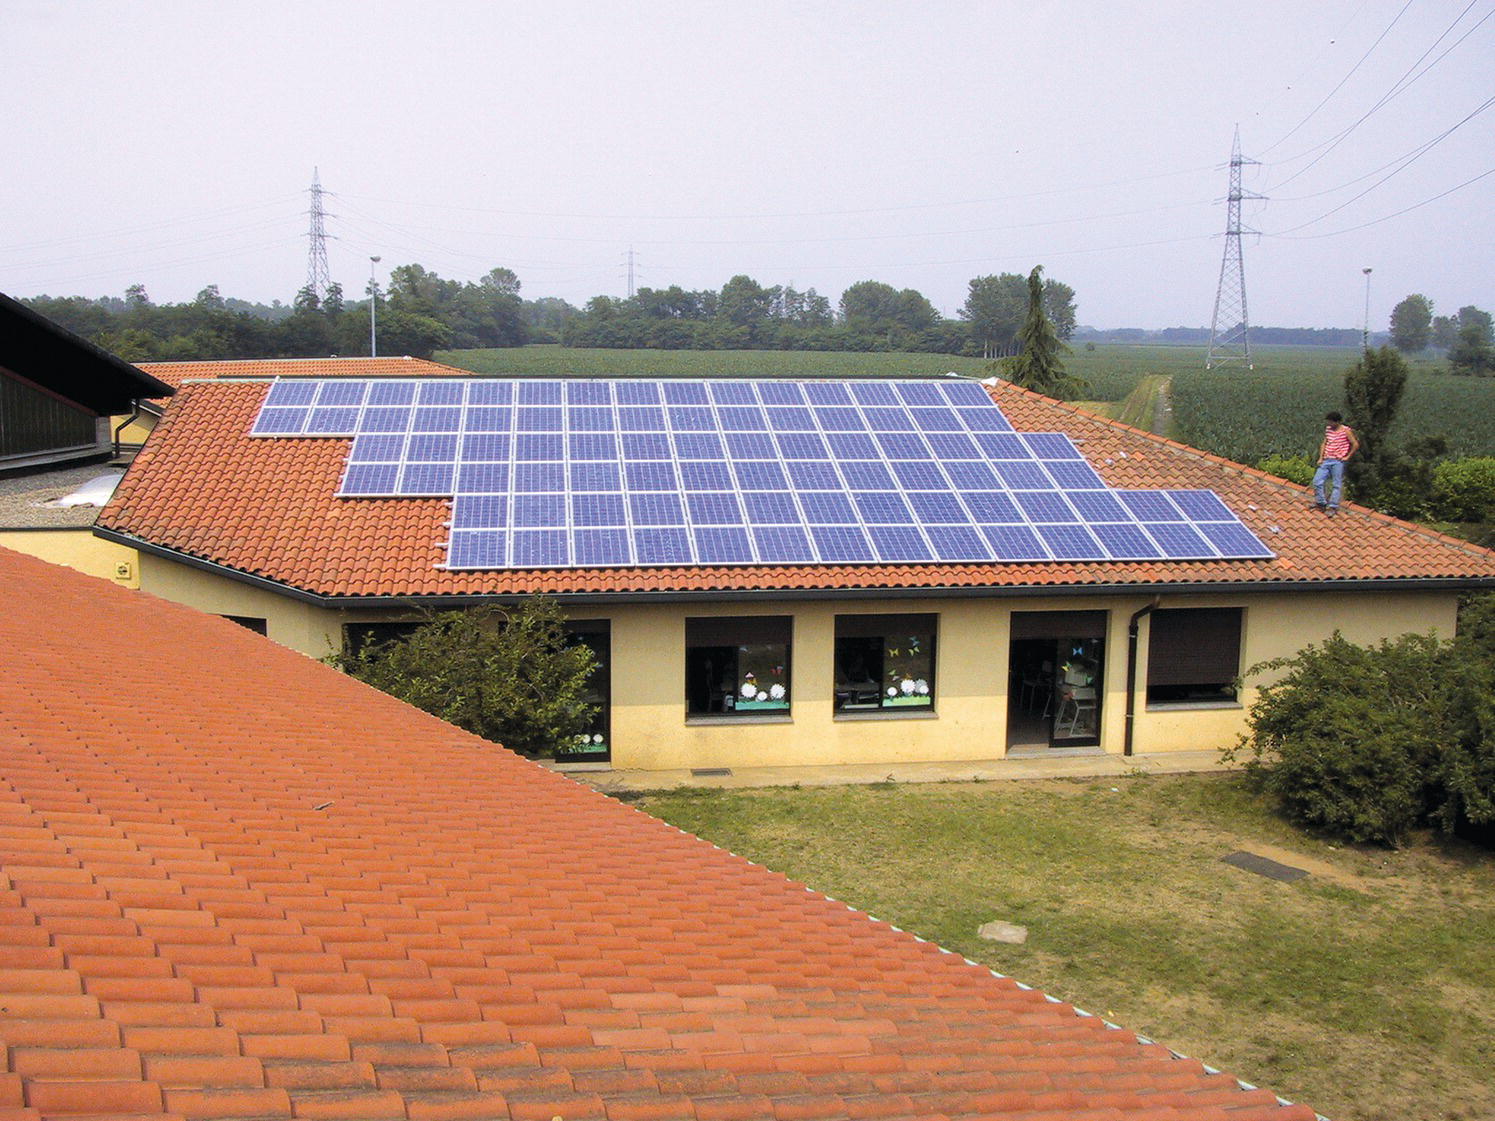
Figure 1.16 A 9 kWp grid‐connected PV system in Northern Italy.
(Source: Reproduced with permission of IEA‐PVPS)
Not that feed‐in tariffs and other forms of government support are universally popular. Some politicians tend to regard them with suspicion, arguing that market forces alone should determine the price of PV and other renewables, forgetting that power production from fossil fuels had and still have government subsidies. Others are more likely to vote for taxpayers’ or consumers’ money being used to support a new and promising technology that will, in due course, benefit the whole of society as well as the planet. Such differences tend to produce stop–go support for PV when governments change, causing confusion and clouding investment decisions. Yet in spite of these drawbacks, the clear trend is toward support by governments regardless of their political hue, mainly because of near‐universal agreement that global warming must be checked and renewable energy championed.
The emphasis on grid‐connected systems in the developed world continues today, making them far more important than stand‐alone systems in terms of the total volumes of PV required. Huge numbers of rooftop installations are being installed on homes, offices and commercial buildings increasingly use PV on their roofs and facades, and large factory rooftops are being fitted with PV, sometimes retrospectively. The market for power plants is also developing rapidly, with Germany, China and the United States prominent in pressing ahead with ever larger installations. Several PV plants of 200–550 MW capacities were constructed in the southwest of the United States and more are planned for China, India, southern Europe, Chile, and the Middle East.
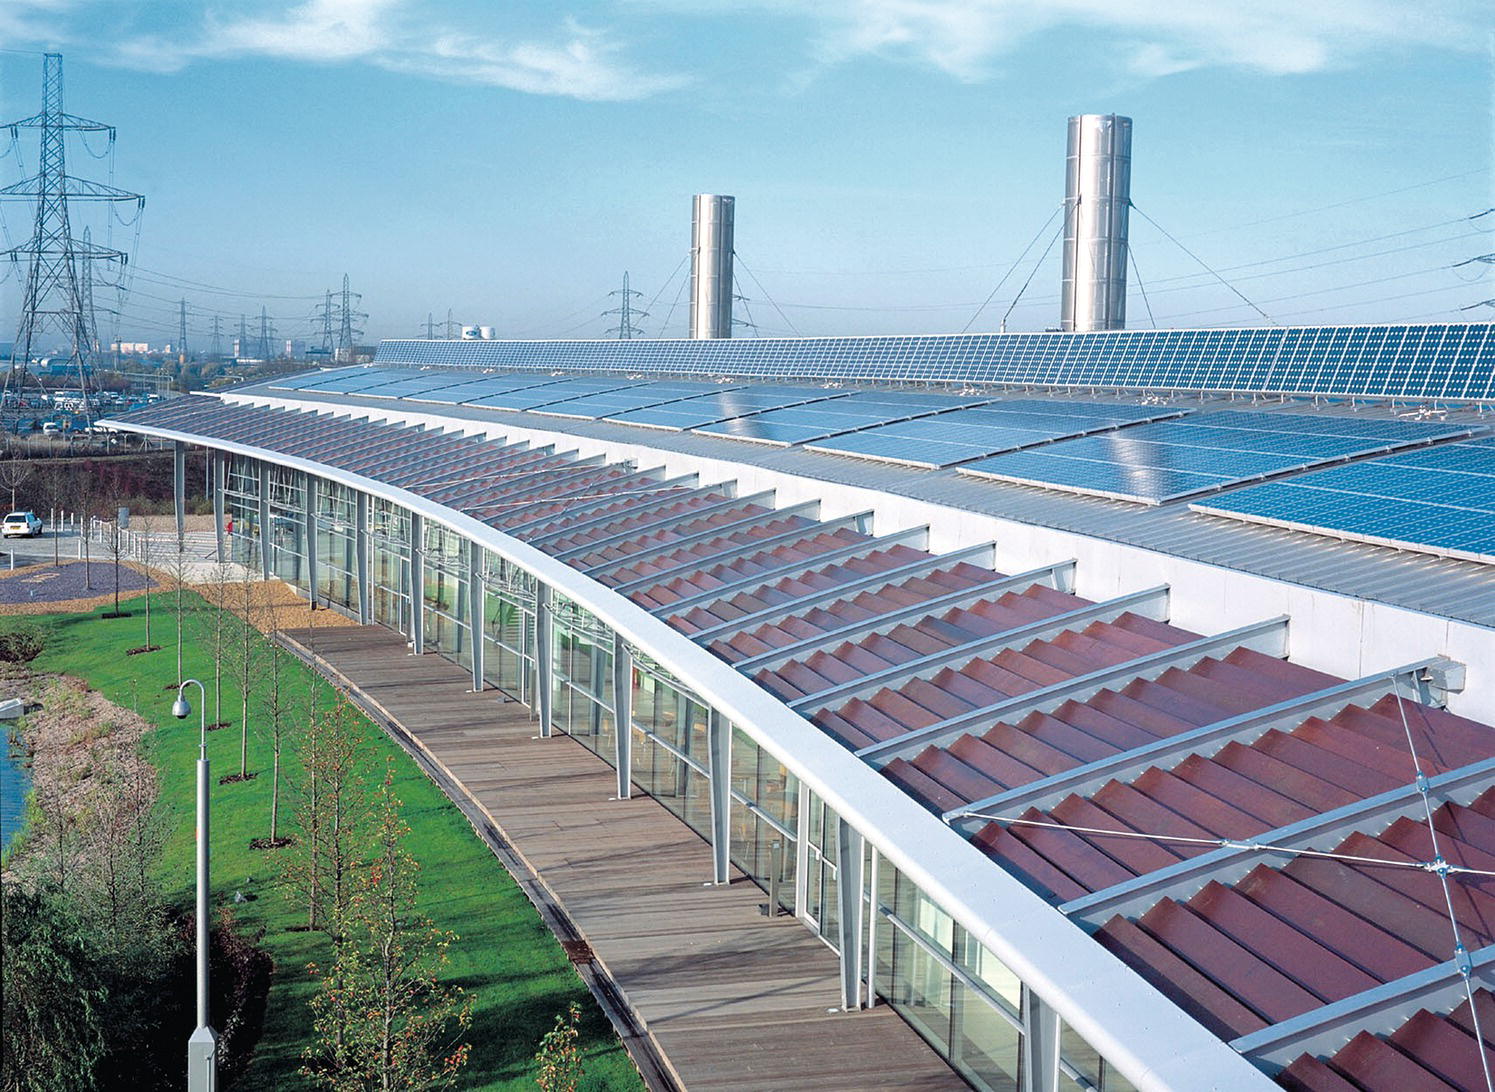
Figure 1.17 115 kWp rooftop installation of the Ford Motor Company in London.
(Source: Reproduced with permission of IEA‐PVPS)
So where has all this activity got us? We previously noted that world cumulative PV production passed the 10 GWp landmark in 2007 and it exceeded 350 GWp in the middle of 2017. PV electricity generation has grown to 47 GW in the United States, with most deployment in the country happening during the last 7 years. Reflecting back in time, in 2008, Fthenakis with collaborators James Mason and Ken Zweibel published in Scientific American5 and in Energy Policy6 a “Solar Grand Plan” demonstrating the feasibility of renewable energy in providing 69% of the US electricity demand by 2050 while reducing CO2 emissions by 60% from 2005 levels; the PV contribution to this plan was assessed to be 250 GW by 2030 and 2900 GW by 2050. For 2020 we projected a module manufacturing cost of $0.50/W and installed PV power plant cost of $1.20–1.30/W; as of 2016 the industry has already reached these 2020 targets. The US Department of Energy (DOE) more detailed SunShot vision study, released in 2012, showed the possibility of having 300 GW of PV installed in the United States by 2030 and 630 GW by 2050.7 As of 2017, the PV industry has already accomplished the efficiency improvements and price reduction projections targeted for 2020.
The industry is now in an exciting new phase, with multi‐gigawatt annual production set to challenge fossil fuel and nuclear plants and achieve “grid parity.” Crystal ball gazing is always risky, but if current and projected increases in cumulative production are maintained, it seems possible that we will be approaching 1000 GWp of PV installed around the world by 2020 or soon after. Recalling that a large conventional power station generates about 1 GW, it is clear that renewable electricity on this scale would make a serious contribution to global supplies.
This raises an interesting question: what total area will be required to accommodate all this PV? After all, sunlight is not a highly concentrated energy source and 1000 GWp of installed capacity would take up a large area. Will Planet Earth be smothered with solar cells? An approximate answer may be found by noting that 1 kWp of 16% efficient solar modules has an area of about 6 m2. However, modules cannot generally be crammed together, especially in large ground‐mount installations where space may be needed to allow servicing and prevent shading, so we might allow 15 m2/kWp. This means that 1 000 GWp, equal to 1 000 × 106 kWp, would need around 15 000 × 106 m2, which could be provided by 1 220 × 1 220 km2 of land, roughly two times the area taken up by London and its suburbs, or by Paris. In other words, our projected global PV scenario for 2020 might require a total area comparable with just two large modern cities—but spread right around the globe. When we consider that huge arid regions and deserts of the world, marginal and ex‐industrial land, and hundreds of millions of rooftops on houses and commercial buildings are all candidates for PV, there appears to be plenty of space, and as we discuss in Chapter 7 this space is less than coal mining uses!
Our brief summary of recent developments and likely trends has so far ignored one of the most important aspects—R&D of solar cells, modules, and the additional items that go to make up a complete PV system. In fact, the past 20 years has seen extraordinary R&D activity by teams in universities, government institutes, and PV companies. Solar cells are constantly being improved, new types of cell invented, and system components improved in reliability as well as reduced in price. However, we will be in a better position to consider such topics after covering some of the basic science of solar cells in the next chapter.
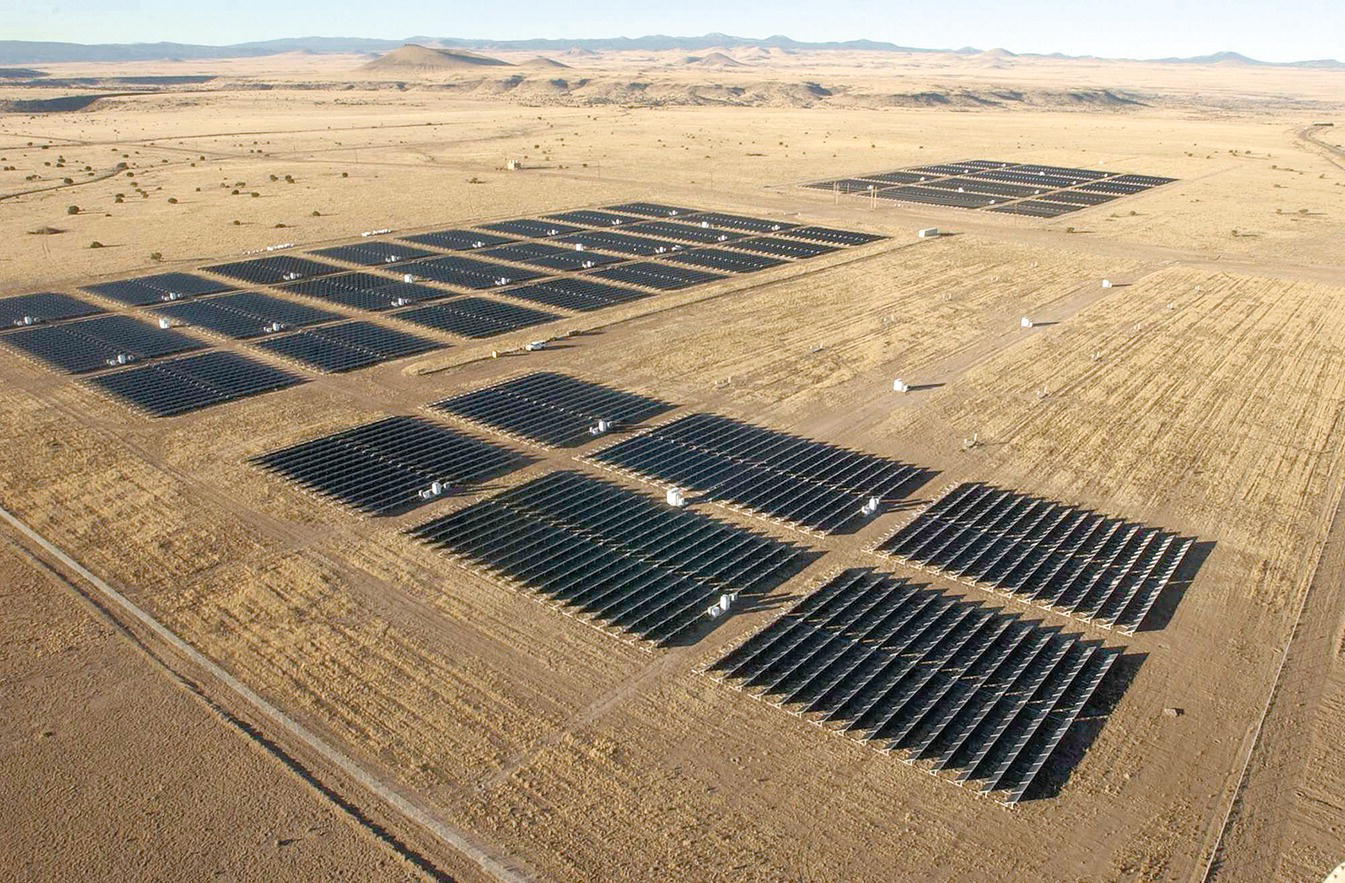
Figure 1.18 PV power plant in Colorado, USA.
(Source: Reproduced with permission of IEA‐PVPS)
Appendix 1.A Energy Units and Conversions
| Thermal (primary) energy | Electricity |
| Joule(J); kilojoule(kJ), 1 kJ = 103 J; Megajoule(MJ), 1 MJ = 106 J; Exajoule(EJ), 1 EJ = 1016 J | Wh; kWh; MWh; GWh, 1 GWh = 109 Wh; TWh, 1 TWh = 1012 Wh |
| Btu; QBtu(Quad), 1 QBtu = 1015 Btu | 1 kWh = 1000 W × 3600 s = 3.6 MW s = 3.6 MJelectricity (MJe) |
| 1 MJe = ~3 MJ (conversion of electricity to primary energy assuming an average grid conversion factor of 0.33) | |
CO2 Emissions per Fuel Type
| Fuel type | kg of CO2 per unit of consumption |
| Grid electricity | 40–60/kWh (depending on grid mix) |
| Natural gas | 3142/Mt |
| Diesel fuela | 2.68/l (l) |
| Petrolb | 2.31/l |
| Coal | 2419/Mt |
a One liter of diesel weighs 0.83 kg. Diesel consists 86% of carbon, or 0.72 kg of carbon per liter. According to the stoichiometry of the combustion reaction, C + O2 = CO2 12 kg of C produces 3.6 times more (44 kg) of CO2. Thus, combustion of one liter of diesel would produce approximately 2.6 kg of CO2.
b One liter of petrol weighs 0.75 kg. Petrol consists 87% of carbon, or 0.65 kg of carbon per liter of petrol. In order to combust this carbon to CO2, 1.74 kg of oxygen is needed. The sum is then 2.39 kg of CO2 per liter of petrol.
| Vehicle type | Miles/gal (mpg) | km/l | kg CO2/km |
| Medium hybrid cara | 50 | 18 | 0.11 |
| Medium gasoline cara | 28 | 12.5 | 0.20 |
| Diesel carb | 47 | 20 | 0.12 |
| Trailer truck, diesel engine | 3 | 2.68 | |
| Rail | 0.06/person | ||
| Air, short haul (500 km) | 0.18/person | ||
| Air, long haul | 0.11/person | ||
| Shipping | 0.01/ton |
a A car rated at 20 km/l (47 mpg) uses 5 l/100 km; this corresponds to 5 l × 2.6 kg/l/(per 100 km), thus 0.13 kg CO2/km.
b An average consumption of 5 l/100 km then corresponds to 5 l × 2.39 g/l/(per 100 km) = 0.12 kg CO2/km.
Self‐Assessment Questions
- Q1.1 Explain the difference between capital and income as applied to the Earth’s energy resources.
- Q1.2 Using Figure 1.7, estimate the approximate annual mean insolation in W/m2 just outside the Earth’s atmosphere and at the Earth’s surface for (a) Oslo, Norway; (b) Lisbon, Portugal; and (c) the Caribbean Islands.
- Q1.3 Explain why solar spectrum AM0 is relevant to PV on Earth satellites, whereas spectrum AM1.5 is generally used for terrestrial PV.
- Q1.4 What is meant by the direct, diffuse, and albedo components of sunlight received by solar cells? Would you expect direct or diffuse radiation to be more significant in the following locations: (a) Phoenix, Arizona; (b) Glasgow, Scotland; and (c) Atacama desert, Chile.
- Q1.5 Solar panels on the Telstar 1 telecommunication satellite (see Figure 1.13) were rated at 14 W, sufficient for its entire power requirements. To put this into an everyday perspective, how long would a 14 W heating element take to raise the temperature of 0.3 l of water from 20 to 90°C, sufficient for a generous mug of coffee? Neglect heat losses.
- Q1.6 During the last decade global cumulative PV capacity has been increasing at an average annual rate of about 40%. What is the equivalent percentage for your nation (or country of residence), and what factors (climatic, economic, political) seem responsible for any difference?
- Q1.7 What is the difference between primary energy and electricity and what losses are accounted for in converting the first to the latter?
- Q1.8 What are (a) the total annual electricity demand and (b) the total annual energy demand for your nation (or country of residence) expressed in kWh, GWh, and TWh for electricity and in MJ, EJ, and quads for primary energy.
- Q1.9 Consider a ground‐mounted 10 MWp solar farm on flat land. If the modules are 17% efficient, and the total area allocated to the solar farm is 2.5 times larger than the area covered by the modules to allow access and prevent shading, what is approximately the total area of the solar farm, expressed in (a) square meters, (b) hectares, and (c) acres?
Problems
- 1.1 The current US annual electricity demand is approximately 4000 TWh; what is the primary energy corresponding to this demand if the energy mixture is 37% natural gas, 30% coal, 20% nuclear, 10% hydro and 3% wind and solar? How would the primary energy demand change if the renewable energy contribution to the mixture increases to 70% by 2050 (according to the Solar Grand Plan) from the current 13% and the balance of 30% is satisfied by 10% each of coal, natural gas and nuclear? Assume a 10,000 TWh/year scenario. Assume the following primary to electrical energy conversion factors: natural gas 0.4; coal 0.28; nuclear 0.33; hydro 1.0, wind and solar 0.1.
- 1.2 What is the height required for a flow of one ton of water per second to produce 1 kWh of electricity, in a hydrodynamic plant with efficiency of 100%?
- 1.3 Derive the conversion of Joule to units of mass, length, and time in the metric systems using the kinetic energy equation.
- 1.4 How many tons of CO2 are produced annually by a typical internal engine car and by a hybrid car?
- 1.5 Burning a metric ton of coal with 67% carbon content generates about 2.4 tons of CO2 and burning a liter of petroleum generates about 2.7 kg of CO2.
- If a total of 20 million tons of coal are burned every day, worldwide, calculate the weight of carbon dioxide emitted into the atmosphere from burning coal and associated ppm increase, ignoring the absorption of CO2 on land and the sea.
- Calculate the same for the total combustion of petroleum assuming a global consumption of 70 million barrels per day (a barrel of petroleum contains 42 gallons and a gallon is 3.78 l).
- Calculate the same for 20,000 tons consumption of natural gas.
- 1.6 The United States with a population of 300 million accounts for about 18% of the 550 quad (quadrillion Btu) global energy demand. (a) What would be the increase in the global demand if all the 7.4 billion people on the globe used the same per capita energy as the US population and (b) what would be the corresponding CO2 emissions assuming that the composition of the energy source mix doesn’t change? Use the following US energy mix composition: 30% natural gas; 37% petroleum; 14% coal; 9% nuclear; 10% wind + solar. (see Appendix 1.A for emission factors per fuel).
- 1.7 A square silicon solar cell with 5 cm × 5 cm and thickness of 250 µm has an electric power input of 22 W. The bottom surface of the cell is exposed to a coolant whose temperature is 20°C. If the convection heat transfer coefficient between the cell and the coolant is 180 W/m2/K, determine the surface temperature of the cell.
Answers to Questions
- Q1.1 Fossil fuel resources are finite so the income provided by using them can not last for ever. In contrast solar and wind are renewable energy resources.
- Q1.2 (a) 220, 100 (b) 320, 180 (c) 400, 240
- Q1.3 AMO corresponds to irradiation at the top of the atmosphere whereas AM1.5 corresponds to average daily irradiation at the surface of the earth.
- Q1.4 (a) direct (b) diffuse (c) direct
- Q1.5 105 minutes
- Q1.6 The answer is country‐specific.
- Q1.7 Primary is the energy embedded in a fuel and there are heat losses during combustion and other processing that converts primary energy to electricity.
- Q1.8 The answer is country specific; conversion factors are listed in Appendix 1.A.
- Q1.9 (a) 147,058 (b) 14.7 (c) 36.3
References
- 1 E.F. Schumacher. Small Is Beautiful, 1st edition, 1973, republished by Hartley & Marks: London (1999).
- 2 A. Gore. An Inconvenient Truth, Bloomsbury Publishing: London (2006).
- 3 H. Scheer. A Solar Manifesto, James & James: London (2005).
- 4 J.J. Loferski. The first forty years: a brief history of the modern photovoltaic age. Progress in Photovoltaics: Research and Applications, 1, 67–78 (1993).
- 5 K. Zweibel, J. Mason and V. Fthenakis, A solar grand plan, Scientific American, 298(1), 64–73 (2008).
- 6 V. Fthenakis , J. Mason and K. Zweibel, The Technical, Geographical and Economic Feasibility for Solar Energy to Supply the Energy Needs of the United States, Energy Policy, 37, 387–399 (2009).
- 7 U.S. Department of Energy, SunShot Vision study (2012). https://energy.gov/sites/prod/files/2014/01/f7/47927.pdf (Accessed on September 18, 2017).