Chapter 2
Prior Price Levels and Newly Forming Intra-Day Levels
I've established that the framework of my intra-day method is based on countertrend reversal. To reiterate, this is about waiting on the sidelines for a price trend to hit either support or resistance levels. Whatever direction it moves in doesn't matter. Either way, you have a trade. If the price travels up and breaks resistance levels, then you'll have a short position to trade. If the price travels down and breaks support levels, then you'll have a long position to trade.
If you're reading about my system for the first time, you may be feeling puzzled right now. What I'm saying is most likely exactly the opposite of what you're accustomed to. Allow me to clarify.
My system is based on a principle that flies in the face of momentum/trend trading, which is the conventional way to trade. Instead of the usual predicting or guessing as to how far Wall Street will continue a price run, I patiently wait for that price run to hit overbought or oversold price levels, and that's where I make my money.
“What price levels?” you might ask. The answers are provided in this section. I refer to them as prior levels, which means the levels we establish before the market has opened that day.
Let's recap the basic elements of intra-day trading in my system:
- I only take 15 cents on intra-day setups.
- I max my tiers to three prior price levels, meaning 300 shares max.
- I enter the trade 50 cents past my intraday support/resistance.
- The only newly formed intra-day levels I trade are the highs/lows of the day.
- I never hold an intraday trade overnight.
I'll elaborate on the three prior price levels in a moment. First, here are some chart-reading pointers.
My intra-day trading method is based on price action. The one-minute candlestick chart offers the most transparency on price movements, making it my primary time frame for determining intra-day support and resistance levels. The only technical indicator I add to the chart is the volume bar. Each candlestick has a corresponding volume bar. I use these two essentials exclusively. All other indicators simply don't have any relevance, not in such short time frames.
Most indicators, such as Bollinger bands, Fibonacci lines, and MACD, and so on, are only used in investing, and in my opinion, they're useless even then.
Figure 2.1 is an example of a one-minute candlestick chart.

Figure 2.1 One-Minute Candlesticks
The Basics of One-Minute Candlestick Chart Reading
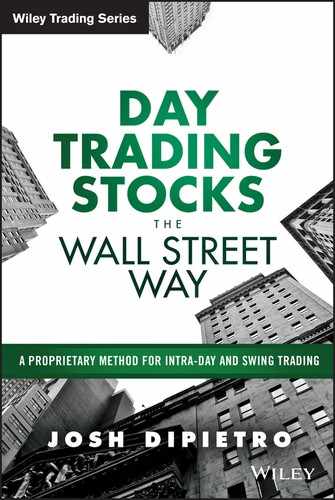
As shown in Figure 2.2:
- The wick of the candlestick shows both the high and low price in that time frame.
- The body of the candlestick can also show the high/low price.
- Example : The 12:38 candlestick has a high (#1) of 157.67 and a low (#2) of 157.54. Notice how in this case it's the wick that determines the H/L price.
- Example : The 12:40 candlestick has a high (#3) of 157.71 and a low (#4) of 157.57. Notice how the high price is part of the body, and the low is part of wick.
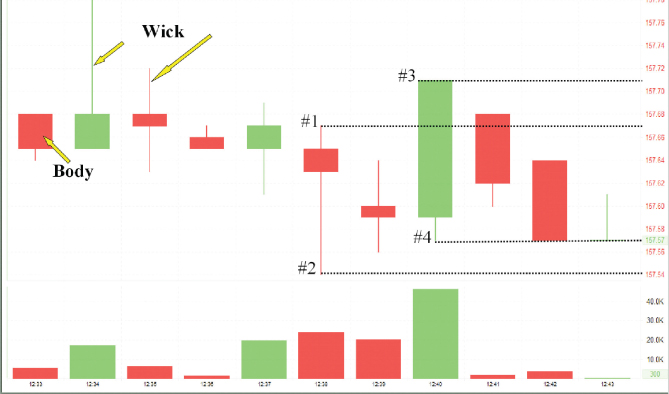
Figure 2.2 One-Minute Candlestick Chart
Please note: the color of a candlestick does not matter with my system. And the high or low price can be part of the wick and/or body. All that matters is that you know the high/low of each one-minute candlestick.
Here you will learn the basic structure of my intra-day setup procedure. It starts before the bell rings each morning with a gathering from three prior price ranges. I refer to those ranges as prior because they always exist before 9:30 a.m. EST.
Your pre-market trading session will always have a high and a low price, your previous day will always have a high and a low price, and on your daily charts you will always have several highs and lows. Each new trading session begins at 8:00 a.m. (pre-market) and then, at 9:30 a.m., the bell rings for the regular market trading hours.
When the 9:30 bell rings, you are guaranteed to always have three previous support levels and resistance levels from which to initially trade. As both support and resistance, those levels are very strong and can be traded every day on all your stocks. It's critical that you properly log them. Here's how.
Those three prior support/resistance levels come from these definite price levels:
- Pre-market high/low
- Previous day high/low
- Daily high/low
1. Pre-Market High/Low
Pre-market trading should be observed in real time. Most direct access platforms have this capability, and on most it starts at 6:00 a.m.
Most active orders start at 8:00 a.m., so I use 8:00 to begin logging price range. Our stocks priced over $100 are traded in pre-market. The volume will be much lower than regular hours, but regardless, the orders placed then are important and relevant. You'll have a lowest pre-market price and also a highest price.
Your job is to wait till the bell rings, and then determine exactly what the high/low pre-market levels are. You will not know for certain until 9:29:59 a.m. Typically, they're forming every second, right up to the opening bell. Once the bell rings at 9:30 a.m., the market has its first definable trading range of the day. The range is from 8:00 to 9:30 a.m. You have a high and a low there.
The pre-market range is your most current, which means the high and low prices during pre-market trading are your most relevant levels. At this point you can see how important it is to log your pre-market data. Here's how.
Your chart needs to be set to one-minute candles to make 6:00 a.m. viewable. You want to see back to 6:00 a.m. just in case price levels do hit. It's very rare that your high/low during pre-market trading will hit between 6:00 and 8:00 a.m., but you do need to be aware. If it's a heavy volume morning for your stock, then you must be on pre-market high alert. Other than that, you only use the 8:00–9:29 a.m. range.
Here's what to look for. The price levels will appear as dots on the screen. Use your crosshair(s) to determine what exactly are the price levels at each dot on the chart. The highest price filled during pre-market trading is your resistance level and the lowest price filled is your support level.
Figure 2.3 shows the entire pre-market trading range from 8:00 to 9:30 a.m. The resistance (high) is 157.13 and the support (low) is 156.10.
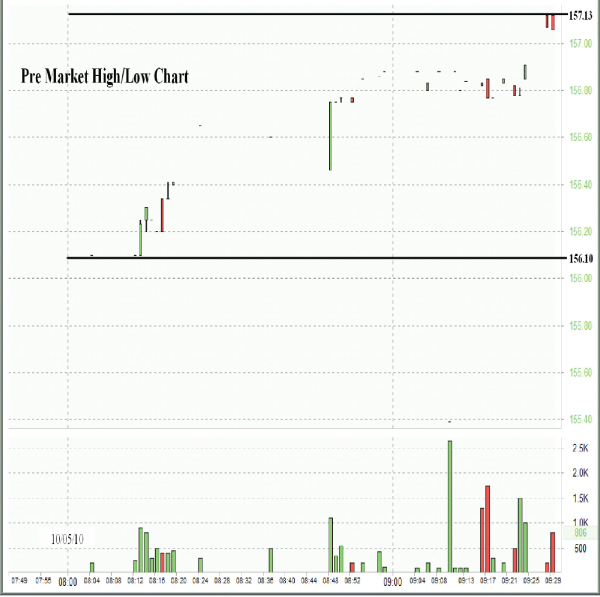
Figure 2.3 Pre-Market Trading Range
2. Previous Day High/Low
This is the easiest high/low to acquire. You simply take the high price and low price of the previous day's candlestick. Make sure that you're not including the pre-market and aftermarket prices. They must be the high and low prices between 9:30 a.m. and 4:00 p.m. (see Figure 2.4).

Figure 2.4 Previous Day High/Low Chart
I show you in later sections how to trade earnings. Only then do the aftermarket and pre-market high/low prices matter.
3. Daily High/Low (Resistance/Support)
The daily high/low levels are the most important levels of my system and the most important levels traded in high volume by Wall Street. As you will discover, those levels are the basis of my fusion of both intra-day and swing setups.
Besides their significance, the daily price levels are also the most complex to find and trade. Therefore, they take far more explaining than pre-market high/low levels and previous day high/low levels.
When you master the daily price levels, you're one step closer to trading the same levels that Wall Street recognizes. Again and again you're going to see how well the price movements pivot at or near those levels and with how much consistency. Only Wall Street can form them. As the small retail pro-traders, our job is to thoroughly know them. It's critical to update them every day.
You will find that those levels are not so hard to gather. Keeping them up to date is the challenge. This takes a big dose of due diligence every single morning before the bell rings. Here I will show you several techniques for gathering and displaying those price levels.
(Later, in the chapter on swing trading, I utilize the same daily levels. However, their function in swing trading is more complicated than in intra-day setups. I'm teaching you the intra-day setups first because the daily levels are easier to learn when you're only intra-day trading. Once you get to the swing trading, I add tougher scenarios and rules. For now we're just taking baby steps.)
I said that gathering the daily levels isn't hard, but it can be intricate. It does require focus and skill. Remember, this book is only the framework. I know I'm being redundant, but it can't be said enough: to learn this you need to be coached and hands-on.
I keep mentioning price levels. From this point on you will begin to understand just how much my system depends on those levels more than any other chart indicator. Wall Street day traders use price levels. They do not use the leading indicators that most nonprofessional trading platforms boast, such as MACD lines, Bollinger bands, R%, and so on.
I know that sounds obvious but a lot of my readers may have two or more chart indicators, and they depend a lot more on those darting squiggle lines than on the price levels themselves. This is true because most trading programs teach their trainees to do that. They know that the greenhorns relate to those lines with a false sense of security, thinking they need them to help them decide.
Figure 2.5 is a perfect example of way too much information. It confuses and makes real-time decisions much harder, especially the exacting of the right price levels for entering into a trade. This may impress a beginner, but it's actually a screenshot from one of my greenhorns who was trading with my system along with some junk that he learned at a two-hour seminar. He lost a lot of money before he dumped the junk and started to trust my system.

Figure 2.5 Too Much Information
For now, just remember this: the price levels on a daily chart are the most important indicator for price reversals that you'll ever use when trading equities. Figure 2.6 is a simple daily candlestick chart. At first glance it has no definable pattern or support/resistance price levels. Later I show you this chart again with the major price levels and no other indicator.

Figure 2.6 Daily Chart: LNKD
Right now you might ask me: “Why are daily price levels so important?” The stock market began with real price levels, and the stock market still uses real price levels for bid/ask. So why use anything else? When determining their entry/exit orders, most highly leveraged Wall Street trading firms only use black-box high-frequency software that combines price levels with volume. (Yes, volume is an indicator, the only other one that's worthwhile, but novices rarely use it properly. I have a hard time reading volume. I return to that later on.)
Wall Street uses daily price levels, not so-called leading indicators, because price levels are the most transparent real-time gauges for trades. You're going to find that most leading indicators lag, meaning they only represent what's happened but not what will happen next—not with any high degree of certainty. Three lines cross-secting and converging on a chart does not mean you buy or sell at that junction, so why clog up your screen with those bogus bells and whistles? I get that it looks cool, like fireworks going off, but you're setting yourself up for failure. Just use real price levels. That's all we use.
Finding and logging daily high/low price levels involves basic chart analysis. You set your chart settings to view daily candlesticks. When you read the rules that dictate daily levels, you may think they're very simplistic. That's because here I just give you the framework. Finding the daily levels is one thing. Learning how to trade them is something else entirely.
You set your chart to a candlestick pattern. You must be able to view back as far as 10-plus years. But you start with the most current, most recently formed daily levels. You log all the levels, even if they're $50-plus off the current price.
You have two basic price levels: your daily lows (supports) and your daily highs (resistance). To find them on the daily chart, you start with these procedures:
-
To find the daily lows, look at the most current day on the candlestick chart and start scanning to its left until you find the first candle that has at least four higher candlesticks to its left and right, meaning the price level has held for at least nine trading sessions.
Note: This will typically resemble a “V” shape.
-
To find the daily highs, look at the most current day on the candlestick chart and start scanning to its left until you find the first candle that has at least four lower candlesticks to its left and right, meaning the price level has held for at least nine trading sessions.
Note: This will typically resemble a “pyramid” shape.
Figure 2.7 is a basic illustration of a sample daily level with established highs and lows.
Figure 2.7 Daily Level with Highs and Lows
Note that each price level has at least four candlesticks on each side of the daily price level. This means the price held for at least nine days straight without breaking that level.
Once you start gathering the proper price levels, you'll find that there are several daily price levels that match this basic criterion. Here are some rules that will help you eliminate several weaker daily levels:
- Each daily level should be $1.00 or more than the other.
- If you have more than one daily price level within $1.00 of each other, then you choose the lowest/highest.
Figure 2.8 illustrates this process.
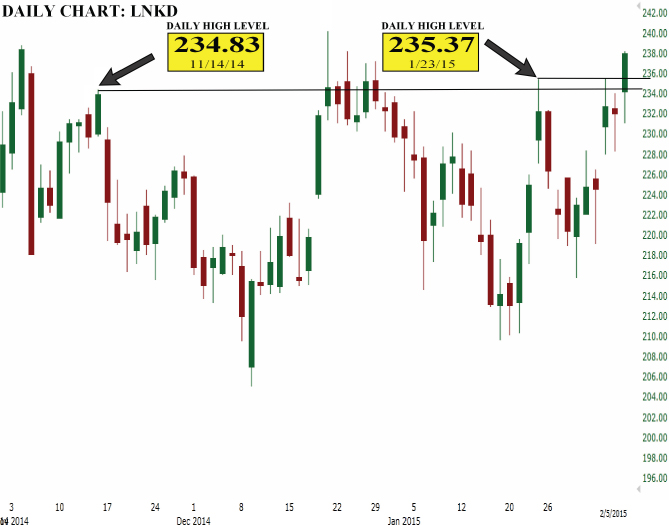
Figure 2.8 Daily Level Process
In this case you simply disregard the 234.83 daily price level and log the 235.37 instead. Note that at one point in time you would have been using the 234.83 price level, but once the 235.37 was a confirmed level, four candlesticks later, on 01/29, it trumped the previous 234.83 daily level. You will understand this better later. For now just get familiar with the chart and get used to looking at candlesticks (price levels).
Another rule is to disregard levels over one year (52 weeks). Unless:
- The price level was or is an all-time high/low.
- And/or it has over 30 days to its left and right.
- Or it's over 2 years. Then it must be more than $5.00 off other daily levels.
Figure 2.9 illustrates when daily levels are over a year but still relevant. And it also shows dates that drop off because they are too weak.
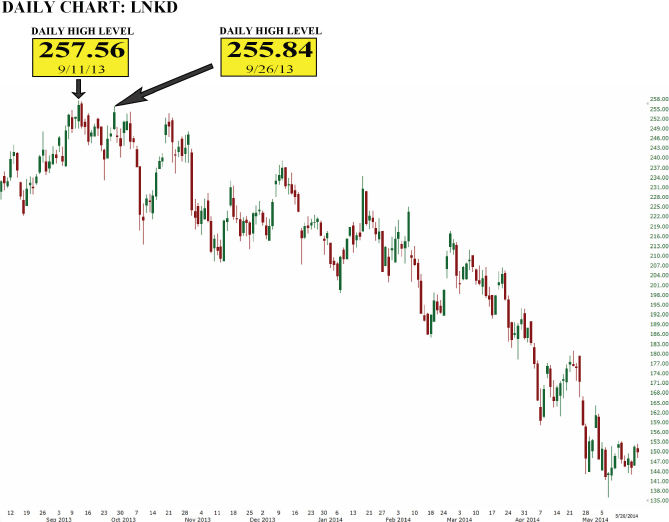
Figure 2.9 Daily Levels Over a Year
I'm writing this on February 19, 2015. In order for the price levels to be relevant today, the daily levels before February 29, 2014, would have to have at least 30 consecutive days on each side of the level holding below/above.
Note that the 257.56 daily price level on September 11, 2013, has at least 30 days holding consecutively on both sides. At that time it was an all-time high. Now look just to the right. You have the 255.84 daily price level on September 26, 2013. It's more than $1 off the 257.56 level but you can't use it anymore, because it doesn't hold for 30 days to the left.
The main reason for this critical rule is to insure that if your price level is old, then it had better be an extremely strong level if it's going to be relevant today. Levels that meet the criterion—over a year old and holding for more than 30 days—remain relevant in today's trading, especially when the current price is approaching them.
Of equal importance is the gap rule. Figure 2.10 shows how a gap of $10 or more overnight means you do not need to have the candle to the left higher/lower for confirmation on support/resistance.

Figure 2.10 Gap Rule
Chances are that when this happens, it's due to a major price run after an earnings release date. You will typically see this pattern every three months on the daily charts. The gap rule applies quite often.
Note that the high of the February 24, 2014, candlestick is 218.36, and dually note that the low of the February 25, 2014, candlestick is 228.45. The overnight gap is more than $10. In this case, the daily price level is the low of 228.45. And, the high of 218.36 would also be a daily high level.
The rules I just mapped out on gathering daily price levels are about 90 percent of what you need. You also need awareness of the remaining 10 percent, and that's where things can get tricky. I can't possibly span all the rules that apply to all the circumstances you're going to encounter—not because it can't be written down here, but because certain stocks and certain situations demand adjustments to the rules and procedures.
For instance, certain stocks do not need exactly 30 days holding. And with some stocks you need your levels at least $2 apart as opposed to the standard $1. These are gray areas that emerge from time to time, especially during earnings season, and that can be a time of turmoil and error if you don't know this system entirely.
Different rules for different stocks: this is why training on any particular stock takes weeks, if not months, to fully grasp on my system. In The Truth About Day Trading Stocks, I discuss the rhythm factor. To reiterate, each stock has its own unique rhythm. If you just apply the framework I sketch here to all stocks priced $100–$250, then you're not in sync with your stock. I elaborate this crucial point later.
This price-oriented day trading system can only be learned from practice and application in real-time. The wise thing to do is to get formal training on how to handle gray areas and other stumbling blocks.
Get Your Daily Price Levels Logged and Organized
Once you have your daily levels logged, you can begin to consider trading them. I say that you should only consider because you don't trade these levels simply because they're hitting. If you do that, I promise you will lose all your money. There is a process, and there are procedures to follow, and the system will tell you the exact price level you should enter at, if and only if you have it mastered. I will get to this shortly.
What to Do After You Have Your List of Daily High Price Levels and Daily Low Price Levels
I'll begin with a critical rule. To determine what daily levels to use for today's trading, only include figures within $10 of pre-market trading (the high and low price of pre-market). For example, if a stock is trading near $231 in pre-market trading hours, then pick only daily low/high levels that are approximately within $10 above or below $231. This does not mean that if the stock price runs for more than $10, you do not use higher/lower levels. This procedure pertains to what I refer to as my whiteboard logs.
What is a whiteboard log? It's a simple drawing board for logging price levels in huge writing with erasable markers. I learned to do this while trading near Wall Street on equity trading floors. Many of the pros were doing this at their trade stations. The simple reason why is to be able to see the important price levels at a quick glance and from far away if not sitting. I have several on my walls surrounding my trade station.
What's on the whiteboards? They each document the levels that pertain to that particular day's trading on each stock I'm trading. They always have the prior price levels. I list those every morning. Remember: they include the pre-market high/low, the previous day high/low, and all the relevant daily price levels that I acquired from the daily chart.
For now you just need to understand that we're simply logging price levels that we find on the charts each morning. Essentially, we're logging simple numbers. For now you need to understand that these numbers are critical, and so is where and how you should log them.
I prefer to log them in my online trading room that I offer trainees and actively subscribed day traders, and also on my own whiteboards. I highly recommend that you do the same. Go get a whiteboard from Staples. It's about $20 for a 30″ × 40″ whiteboard. Or for now, just write on an 8″ × 11″ sheet of paper. Either way, hang it up on the wall. You save an entire LCD screen by doing so. No need to use up a screen when you have a whiteboard.
The point is to get all your numbers in order, to have those numbers correct, and to be ready to trade when that bell rings. You're going to learn that you can't possibly start trading unless you know your price numbers. That's why I'm making such a big deal of showing you how to gather and log the prior price levels.
Figure 2.11 is a screenshot of my whiteboard. I have many different scribblings on different days. This is just one example. I use one for each stock that I actively trade each day. This example happens to be LNKD. I logged both my pre-market and previous day high/low levels, and then I decided which daily levels should be on the chart for this given day.

Figure 2.11 One of My Whiteboards
Note that the pre-market levels are trading right around 231.00 (the pre-market high was 231.45 and pre-market low was 229.00). Also note the daily levels at the bottom of the whiteboard. The right-bottom column shows the daily low price levels, which will be used as my supports. The left-bottom column shows the daily high price levels, which will be used as my resistance. I also use a log sheet for the prior price levels.
Notice the logged data in the first two columns in Figure 2.12. It corresponds with the data on the screenshot of the whiteboard on my wall. A whiteboard is important, but the log sheet is even more so. Keep one, and keep it filled in every day.
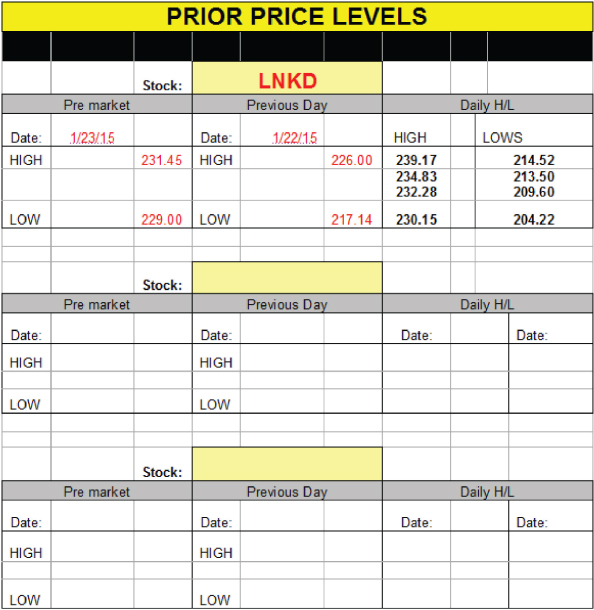
Figure 2.12 Prior Price Levels
Log Your Prior Price Levels on a Whiteboard Before the Opening Bell
At this point it doesn't matter whether the price level is the pre-market, previous day, or daily levels. What matters is having your prior price levels in numerical order. Have your support levels in one column and your resistance levels in another.
For the table shown in Figure 2.13 I simply transferred all the price levels from the LNKD stock example on the whiteboard and/or the log sheet, and then put them in descending order. The left column has the high (resistance) price levels, and the right column has all the low (support) price levels.

Figure 2.13 High (Resistance) and Low (Support) Price Levels
At this point I've shown you the basics of reading the daily chart and the one-minute chart, and how to gather all the prior price levels needed before the 9:30 a.m. bell at the New York Stock Exchange. In Chapter 3, I show you how to take these levels and trade them by using the 3-tier max system. For now you only need to absorb the process of gathering price levels.
Next I show you how to recognize the newly forming price levels that are created all day after the bell.
Remember this rule: you need a minimum of five consecutive one-minute candlesticks to confirm a sustainable intra-day support/resistance level. This is because in the first five minutes after the bell rings, nothing will form to trade, because it takes at least that long for an intra-day level to take shape. After the first five minutes, you may have a stock that may have created the first intra-day support/resistance of the day.
Of course, this does not mean you won't trade the prior price levels within the first five minutes. Your initial trade of the day will most likely be traded off one of those. But if none of them breaks on your whiteboard and you don't have a trade during that window, then the thing to do is focus on the newly forming support/resistance levels, which must take at least the first five minutes after the bell.
Five consecutive candlesticks means that once you have an intra-day price run, at some point that price-run has to bottom or top, intra-day. This will happen in one particular candlestick. For instance, if you're forming an intra-day support, then the support price level will be the lowest price level of the first candlestick. If you're forming an intra-day resistance, then the resistance price level will be the highest price level of the first candlestick.
When I mention the lowest/highest price, I'm referring to the price level that's forming an intra-day support/resistance. You do not want the second, third, or fourth candlesticks breaking the low point of the first candlestick; this is what I mean by consecutive candlesticks. Likewise, if the price level is forming an intra-day resistance, you do not want the second, third, or fourth candlesticks breaking the high point of the first candlestick.
Also, each candlestick after the first can hit the same price level of the first, but it can't break its price level. If the second, third, or fourth does break the first candlestick's price level, then you have to start the process all over.
This is not as hard as it sounds. I provide you with illustrations that explain what all of this means. But of course, the best way to learn is hands-on, not just by reading this framework.
You might ask: “Which should be the first candlestick?” The first will be one of several that have previously dropped or climbed to an intra-day low or high. Whether the stock is forming an intra-day support or resistance, the first candlestick must be higher than the previous one when forming intra-day resistance and the first candlestick must be lower than the previous one when forming intra-day support. In other words, you need only one candlestick to hold to the left.
To reiterate:
- When forming intra-day resistance, the first candlestick must be higher than the previous one (use the highest price in each) as shown in Figure 2.14.
- When forming intra-day support, the first candlestick must be lower than the previous one (use the lowest price in each) as shown in Figure 2.15.
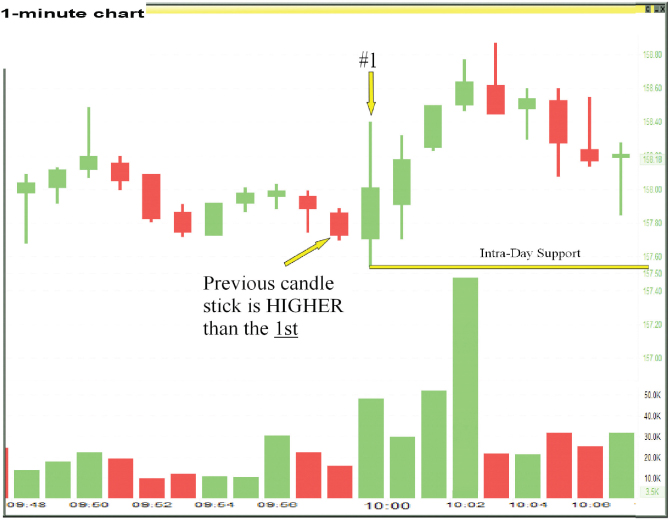
Figure 2.14 Previous Candlestick Higher than the Previous One
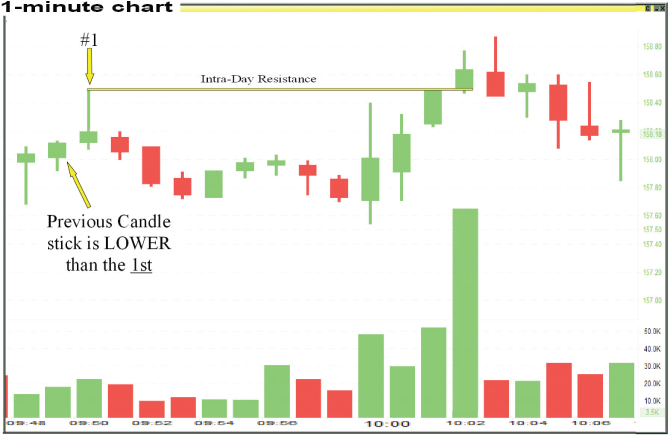
Figure 2.15 Previous Candlestick Lower than the Previous One
Now You Start the Five-Candlestick Counting Process
As I mentioned, once you've established your first candlestick, then you don't want the next candlestick to drop lower or climb higher than the first one at any time during its 60-second cycle. If the second candlestick does not drop/climb past the first, then you now have two consecutive candlesticks holding at the price level of the first (lowest price point for support, highest price point for resistance). In order to have a sustained newly formed intra-day support/resistance, the next two candlesticks (the third and the forth) cannot break the price point of the first. Again, if one does, you have to start the process all over again.
If all three candlesticks past the first candlestick don't break, then you need to focus on the fourth candlestick to the right of the first. The fifth candlestick cannot break the price level of the first. If you determine that the fifth candle has confirmed a newly formed intra-day support/resistance level, then you can prepare to place a trade off that price level. I elaborate this in Chapter 3.
How to Count Five Minimum Candlesticks (Chart Analysis)
In Figure 2.16 you have a newly formed intra-day resistance level at 157.76 at 9:36. This price level was never broken in the following four candlesticks. Therefore, once candle #5 never hits above 157.76 price level in candlestick #1, you had confirmation that the 157.76 price level (candlestick #1) was a new intra-day resistance level. Notice how it took eight minutes (or three candlesticks past the #5 candlestick) before it actually broke resistance.

Figure 2.16 Five Minimum Candlesticks
For now, you should simply focus on recognizing the five minimum candlesticks that it requires to form a new intra-day support/resistance level. Also note that the 157.76 intra-day resistance level is the current daily high.
In Figure 2.17 you have an example of a newly formed intra-day support level at 157.87 at 10:07. The #1 candlestick bottomed at 157.87. The following four never broke this price level. Therefore we have our five minimum consecutive candlesticks. Note as well that the first candle to the left of #1 is higher. You can perceive that as a total of at least 6 candlesticks hooding at or above the support level.
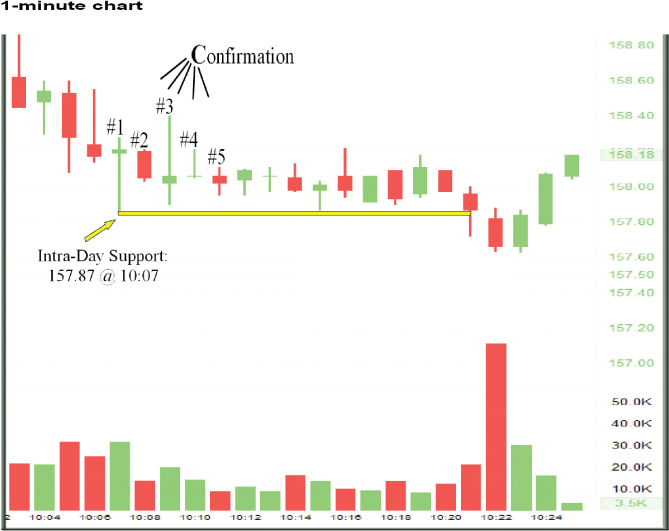
Figure 2.17 Newly Formed Intra-day Support Level
Notes, Reminders, Cautions, and Hints of the Lessons to Come
- In Chapter 3, I show that you may have 20 intra-day levels at any given point throughout the day. But for now, you will only be trading the intra-day highs and lows. I've shown how you need the five-candlestick rule to form an intra-day high/low. In Chapter 3, I explain in greater detail why this is, but for now I emphasize the main reason: those price levels are relatively the safest to trade and the easiest to decipher.
- There is no maximum or exact time frame for a trade setup to take place, other than the entire day from 9:30 to 4:00. Typically, a new intra-day setup will develop within 5 to 15 minutes after each trade you place. Sometimes it can take an hour before a new one comes along. Even if you confirm an intra-day price level, it may take several minutes for an entry price level to hit. Some days are more volatile than others. The thing to remember is: do not force trades.
- If the price is trending in one direction, this means that each candlestick keeps dropping/climbing past the previous one. Thus you do not have the required five minimum consecutive candlesticks that form a new intra-day sustained support/resistance, even though you may be approaching one of the prior price levels: pre-market, previous day, and daily high/low.