Chapter 4
The Mechanics of FASTKEY Order Execution
Your intra-day trades are for only 15 cents. In some cases, such trades form in milliseconds. Because of this, fastkey is essential.
You'll find that when you aren't using fastkey, your back-testing will show you that several of your setups are in the green, but you didn't profit. The reason is it happened so fast that you didn't place an exit order when you should have. This is what makes fastkey so crucial.
I know I sound like a broken record when I say that this topic is by far the hardest to teach on paper, and certainly impossible to master without weeks of hands-on practice. This is the single largest reason why new day traders lose on their intra-day trades. Not utilizing proper fastkey procedure will result in poor intra-day trading.
Using Your Keyboard Keys for Rapid Order Execution
Figure 4.1 is an illustration of a normal PC or laptop keyboard, and the option it has for placing trades. It makes order execution 10 times faster.
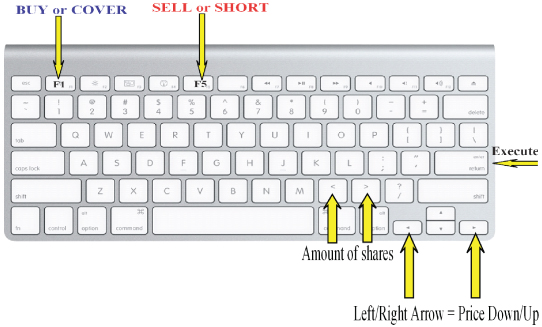
Figure 4.1 PC or Laptop Keyboard
Most broker platforms have this function, but very few are true direct access.
Placing Orders Directly from a Level 2 Quote Chart (Direct Access)
You can order directly from the Level 2 streaming quote chart. Having said that, I also want to make it clear that I can certainly tell you about fastkey, but I can't show you how to set it up, not here, not on paper, in a manual. You won't be able to practice it right until you're in my training program and you're working with my custom demo layout.
Trying to learn fastkey on paper without using the demo platform is like reading a flight manual and then trying to fly a real plane, without training first in a flight simulator. So, for now, let's just focus on the concept.
The following three charts in Figures 4.2 to 4.4 show snapshots of what your Level 2 quote charts should look like. They include buy/cover, sell/short, and limit orders.
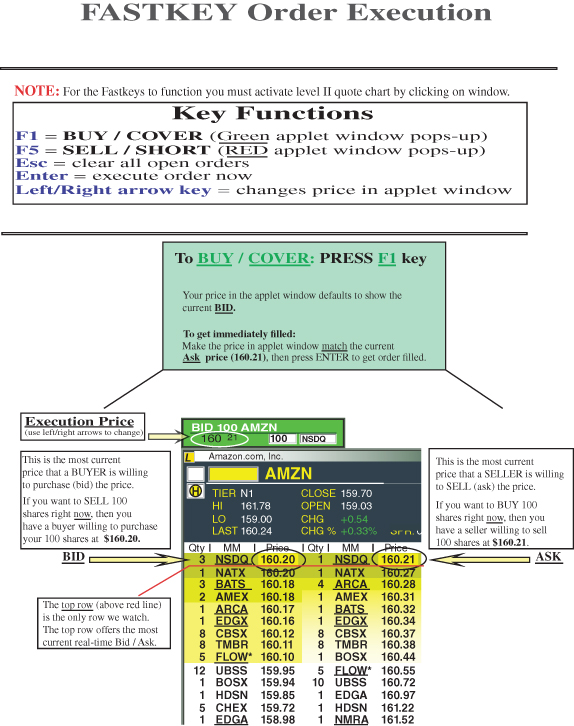
Figure 4.2 FASTKEY Order Execution #1

Figure 4.3 FASTKEY Order Execution #2

Figure 4.4 FASTKEY Order Execution #3
Note how the order box (the small applet window to the upper left) is capable of directly executing trades. The applet window is the small box that pops up when you press either F1 or F5. This box is green when you buy long or cover short and red when you sell or you short.
The applet window has a market maker box. In the diagram examples, the box has NSDQ as the market channel the current trade will be routed through. Don't worry about this box. You can keep it as NSDQ when demo trading and/or trading live. Either way, your orders will get filled when your price hits, in most cases.
There certainly are several variables that can make your trades very difficult to fill, even with the aid of fastkey. For instance, if you throw a 5,000-share order at the market, it's not going to fill right away, and it will most likely be a partial fill. This is one more reason why we don't trade with much more than 100 shares per entry. Even at my level of experience, I very rarely enter with more than 500 shares on any given price level.
Even if you have $5 million in buying power, and you want to and can place a 5,000-share order, it's not going to work.
“Why not?” you might ask. Because your own order will push the price higher/lower, making partial fills, and that is no good. If your orders are constantly partially filled, your consistency goes right out the window.
Notice the price level of AMZN. At the $160 level, the charts must be old, but that's okay, the concept never changes.
Executing Real-Time Trades (Manual Limit Orders)
My system of order entry is based on real-time limit orders, or manual limit orders, “manual” meaning you do it yourself; you don't have a system or program placing any trades for you. Whether you're buying or selling at a profit or a loss, your fastkey orders will all be in real time, and always placed manually.
After reading Chapter 3 you should know how to scrutinize one-minute candlestick intra-day charts and also your prior price levels, and you should know how to find the exact entry/exit price by adding or subtracting by 25 or 50 cents. “Wow! That sounds so easy,” you may be thinking. But I can assure you it's not. And that truth becomes even truer when you do this with more than one stock.
Easy? Yeah, right; assuming that you've been onboard this whole time and know your entry/exit prices perfectly, then all you need to do at this point is tap on the left/right arrow key right before you press Enter, execute your limit order in real time—and voila! You're done! Now you're gonna make some money.
I'm kidding. We have a long way to go.
You may wonder why we call it a “limit” order. If it's going to fill within seconds of placement, isn't that a market order?
That is a good question. Most traders are accustomed to placing limit orders rather than market orders. Typically, when you're swing trading and you place a standard limit order, the order price is more than 25 cents off the current market price, usually a dollar or more, and it could take hours or even days before it's hitting/filling. So most traders associate “limit order” with waiting for extended periods before entering/exiting a trade. Something that fills within seconds can't be a limit order, right?
Wrong. The previous fastkey diagram on limit orders represents the following scenario: the applet window (F1 to buy) reads $160.08. Notice that it's 12 cents below the current bid of $160.20. When I hit Enter the price will execute a buy order, making it a temporary limit order. The order for $160.08 will not fill until the current ask price of $160.21 comes down to $160.08.
“How long does this take?” you might ask. That's another good question. It depends. The closer you try to get your fill price to the current bid/ask, the quicker it will fill. In this case, the execution price to buy long was $160.08. That means the current trade had a support price level of 160.33 (25 cents above 160.08). I placed the order for 160.08 as soon as it broke the 160.33 level.
This is a great strategy because it gives you some time to get your order out there. Typically the price will not drop 25 cents in less than five seconds—and five seconds is an eternity when you need to get an order out fast. So when you're intra-day trading, you never keep an order open for more than one minute. With my system you're going to rapidly find that once your levels break and you choose a price level to enter/exit, your price will be a limit order for less than one minute.
Tapping your left/right arrow key is the mechanics of fastkey. For instance: if you were buying long, then you'd want to press Enter after pressing the left arrow key enough times to get the execution price in the applet window to be lower than the current bid price.
That sums up the fastkey portion of coaching. Again, all I can offer here on paper is the non-mechanical aspects. You truly will not understand how fastkey order execution works until you are applying it in real-time.
Scrutinizing Both Real-Time and End-of-Day Trades with Back-Testing
Back-testing is the glue of my system. This process helps to reinforce my entire trading methodology. If you're not back-testing properly, then you are not progressing.
When you're back-testing either demo or live real-time trades, you're reverse-engineering each previous roundtrip trade and reviewing and reconfirming each previous and newly forming intra-day support/resistance in real time.
You've most likely practiced back-testing of some form in the past. The difference is that now you have a clear system to refer to. Once you completely understand my trading methodology, you're ready to learn to do back-testing properly.
First, you need to have a platform that can scroll back in time on the one-minute candlestick chart. You need to be able to view the current day and previous day's candlesticks on a one-minute chart. Most platforms lack those functions. They can't scroll back or pan back on the one-minute candlestick chart and they don't allow you to see each one clearly. The platforms that do have those functions usually cost $100–$300 per month, such as TradeStation, ThinkorSwim, and Esignal.
Don't worry; I have a free option for you. Go to www.FreeStockCharts.com.
I urge you to register with this market data provider. Other than a vertical advertising banner on the right side of the chart, there are absolutely no strings. I jokingly tell my trainees to just grab some duct tape and cover it up. The software downloads in seconds and you will be impressed. Please be warned, however: the FreeStockCharts platform is for back-testing only. Do not attempt to use their charts for real-time trading and charting.
“Why not?” you might ask. You obviously need real-time charting for my system to work properly when you trade. When back-testing, however, at end-of-day trading, the data doesn't need to be in real-time; you just need it to have correct data. For instance, once a one-minute candlestick closes on FreeStockCharts, the high/low prices are logged as actual price levels (the correct closing high/low prices in each candlestick). But when you view the most current candlestick in real time, you don't receive direct access information up to the millisecond. For real-time data, you use your broker's charts.
Figure 4.5 is a screenshot of the FreeStockCharts platform. You will have to perform some basic setting changes to get your data to look like the chart.
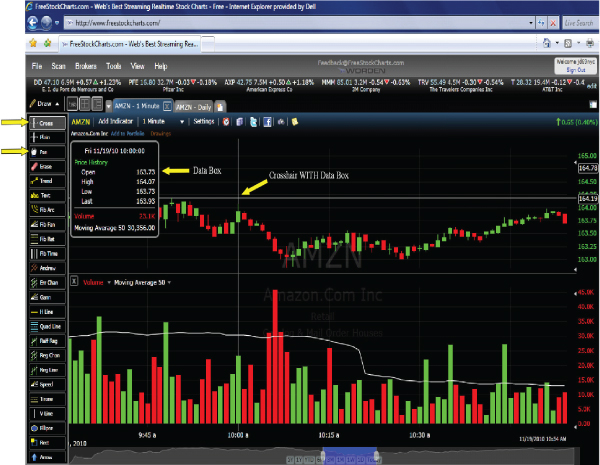
Figure 4.5 FreeStockCharts Platform
Take note that the arrows will be yellow. These are the only functions you will ever need to use on this platform. You will use the “cross” and “pan” tabs to the left. You will use your left mouse/click button to drag/pan the screen to the left or right.
Make sure your candlesticks are set to one minute and add another tab for your daily candlestick chart. The data box will give you the exact high/low price for each candlestick.
Here are two applications for back-testing.
-
To scrutinize your real-time (current) intra-day trading activity.
My system is based on knowing all the prior support/resistance (S/R) price levels, and particularly your newly forming intra-day S/R price levels. Therefore, real-time back-testing is a pivotal process to determine what price levels are correct to trade off of, either in the moment or in real time.
Basically, real-time back-testing is looking at your charts and scrutinizing the current day's trading. It helps you to recognize newly forming support/resistance levels throughout the current trading session.
When intra-day trading in real time on your broker's platform, you can back-test on their one-minute chart. This is because the candlesticks can fit on one screen, for one full day of trading activity. Accordingly, I always recommend to my trainees to buy at least one 27-inch or greater monitor. The one-minute candlesticks get smaller and smaller throughout the day, so having a larger and wider screen allows you to back-test by viewing with the naked eye—no need to pan or scroll back.
Once you get more advanced, you will find this is critical. You won't have time to be back-and-forth-back-and-forth when you're caught up in active trading. And I can almost guarantee that you'll miss previous intra-day S/R levels if you're not viewing the entire day on one screenshot.
Budget for a couple of 27-inch or greater LCD screens before you go live. I promise this will save you a lot of grief. If you currently have a split-screen setup, this will work as well, but you'll have to stretch the one-minute chart across two screens. This will create a thick border down the middle of your chart. That border can play tricks with your eyes. It's fine to keep your nice two-, four-, or six-way split setup with screens that are 17 inches, but you should add at least two 27-inch or greater screens and use them exclusively for the one-minute candlestick chart, because you can stretch the whole chart across this screen during pre-market trading and all day. You should always see the one-minute candlesticks clearly.
-
To scrutinize your end-of-day intra-day trading activity and to commit to it as if it were homework.
Here are the primary questions you should ask yourself:
- Did I have all my prior levels on the whiteboard?
- Was my original entry price the correct intra-day S/R level?
- Was I in rhythm with the volume bars at the time of the trade?
- Did I simply falter at the fastkey?
- Did I properly use the Golden Rules?
- Did I miss a tier in my three-tier setup?
- Did I place a static entry/exit price and walk away from trade?
- Did I hesitate on initial breakout and then chase trade?
- Was I impatient and frustrated at time of entry?
- Was I simultaneously in more than one trade?
- Can I view the entire trading session (one-minute candlesticks) on one screen?
- What obvious mistake(s) can I remember having made?
It's best to back-test your trades when they're still very fresh in your mind. When using FreeStockCharts, you can easily set the chart to one minute and then pan or scroll back to the time of your first trade entry on the day before and/or earlier that same day. You can either back-test at the end of the day, or you can back-test the next morning, meaning, if you placed intra-day trades on Thursday, and on Friday morning you're back-testing, you scroll back on the one-minute chart to Thursday.
When you use the Lightspeed demo in my training program, you'll be able to print out your orders. Your order window will log all the critical data you need for you to back-test properly. For instance, it has columns. The data you'll need for back-testing is very basic, such as stock symbol, order execution time, number of shares, price in/out, and position (long/short). Simply find your entry/exit points on the one-minute chart, and begin back-testing your trades according to my trading system.
The sole purpose of back-testing your previous (end-of-day) trades is to learn from your mistakes and reinforce your improvements. This goes without saying, but I say it anyway, because repetition always works, and reprogramming you is my job.
You've learned the entire framework of my intra-day trading system. You've learned it without knowing swing trading setups. I've taught you this way because it's hard enough to learn my intra-day system by itself. I've separated the two so you'll master the two before I show you the fusion of both.
I highly recommend that you go back to the beginning of this chapter and reread it before moving on to Part 3, in which I show you the swing trading framework. That way you'll know the rules for each type of trade so well that you won't confuse them and/or overlap them.