Chapter 8
Sample Fusion Trade Setups
In this chapter I show three classic fusion trade setups that cover the framework of my method. In the following part you'll view several advanced strategies that build upon what you learn here. Here you'll find two sample whiteboards, as charts. They are the standard for support or resistance fusion trading. I'll be using this whiteboard format from this point on.
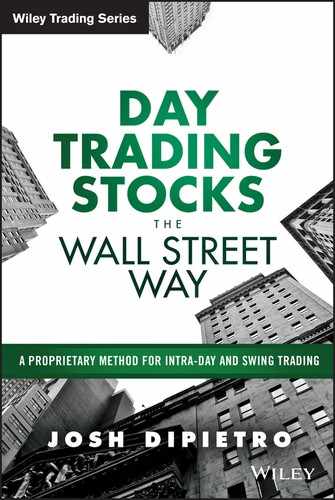
Notice that the whiteboard chart in Figure 8.1 includes the prior price levels shown in Figure 8.2: pre-market and previous day. Because you're now learning the full fusion system, the whiteboard will only include the daily levels that are currently swing levels. Also note that I only show the support or resistance levels. This is because on the morning of a possible fusion trade, your focus should be only on those levels.
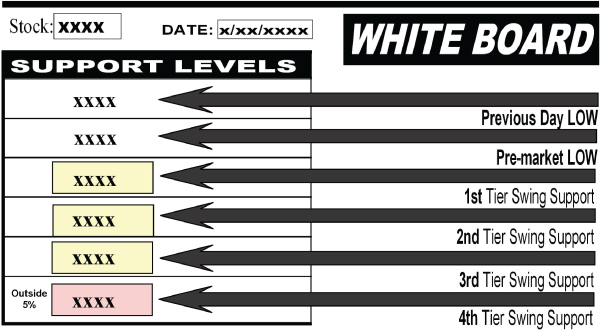
Figure 8.1 Sample Whiteboard Chart: Support Levels
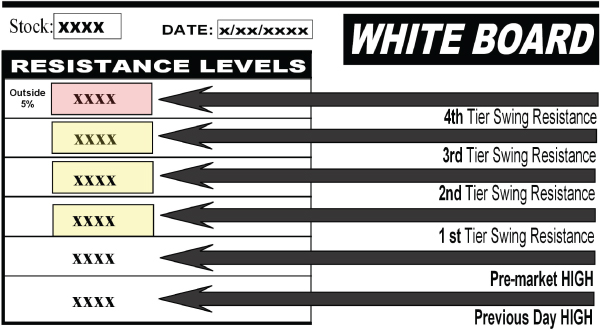
Figure 8.2 Sample Whiteboard Chart: Resistance Levels
Why is this? Think about it. If a swing level is hitting, it can only be one of those. You will never have both a swing support level and swing resistance level hitting on the same day. The only time this could ever happen would be on earnings release dates, and you would not be trading until after the release, which would typically be the next day.
Once you master this system you'll know before the market opens whether you're trading long or short on all your trades for any particular stock. If it's a swing long you're seeking to fusion trade, then you'll only be trading long positions that day, and your whiteboard will only show support levels. And if it's a swing short you're seeking to fusion trade, then you'll only be trading short positions that day, and your whiteboard will only show resistance levels.
Also note that you may have to switch the pre-market price level with the previous-day price level, depending on which is lower/higher. And as I show in the third example here, the pre-market levels take out the first tier swing level, so now you're trading off pre-market levels.
Sample Fusion Trade #1
I'm starting with the simplest setup and then progressing to more involved and advanced fusion trading scenarios. All were taken directly from my online trading room. Figure 8.3 illustrates the normal process of gathering the intra-day levels in the early morning during pre-market, and then the opening bell decision regarding which levels to trade. I use IBM in this first example of a first-tier swing trade setup. Figure 8.4 shows the swing entry setup.
Figure 8.3 Whiteboard Price Level on IBM (for 3/23/15 trading)
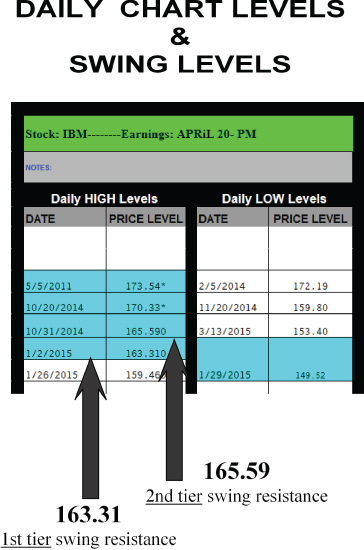
Figure 8.4 IBM One-Minute Chart
The first indicator I looked for was the pre-market H/L price. On March 23, 2015, pre-market was trading between 162.00 and 162.80. At that time I also had a first-tier swing resistance price level at 163.31. The current price was trading within $3 of the swing entry of 164.31 ($1 past 163.31). This information was all I needed to decide to fusion trade that stock that day.
(To enable you to more easily grasp this, I've only listed the resistance levels, because the price went up. If the price had gone down, I could not have traded it long—not until it came within $3 of the 149.42 first-tier swing price level, which you can see in Figure 8.5, right column.)
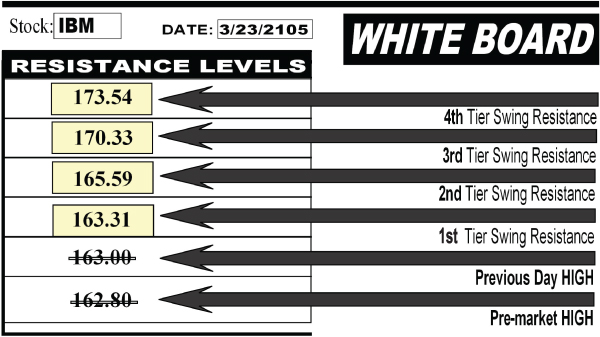
Figure 8.5 Daily Chart Levels and Swing Levels
Once the bell rang at 9:30, I had my pre-market high, which was 162.80. I also had my previous-day high of 163.00. In Figure 8.3 you'll notice that I had all my levels in numerical order. This particular setup was going to be fairly easy because I had no intra-day levels to trade leading into the first-tier swing entry (I knew all my intra-day levels and, as I've previously instructed you to do, I had them ready when the bell rang).
Accordingly, you can see that Figure 8.5 shows only the daily price levels, and it also shows which of the dailies were swing levels. You will be writing these levels on your own whiteboard each morning. Also, note in Figure 8.3 that I put a strikethrough line on both the pre-market and previous-day high price levels. Why? Remember the Golden Rule: I cannot have two levels within 50 cents of each other. So in this case I simply deleted those price levels from my whiteboard.
Now that I knew exactly what price level was next in line to trade, all I did was wait for it to hit. (The waiting is the hardest part.) I'd done all the homework and prepping. My price levels were correct and I had my plan. I just needed the 164.31 swing entry price level to trigger. Once it did, I entered the trade (Figure 8.4).
“How many shares do you trade?” you might ask. Forget it. Don't even go there. Just worry about yourself and what your own capital buying power allows, and your own experience with this system. Remember: the hardest part of all day trading is knowing how many shares to buy/short at any given price level. In this one example, I've made things clear and simple: I'd been waiting for the entry price of 164.31 to hit. When it did I placed my sell short order.
When you're first learning this system, you'll only trade 100 shares on each entry. In other words, in this example you would have shorted 100 shares at the 164.31 price level.
Also keep in mind that this is a first-tier entry. So realistically, as a beginner, you would be waiting for the second tier to hit before you'd enter. But the main lessons here are to know where your first-tier entry is, and when the trade cycles through. You need to keep track of when the price hits 164.31 and then retraces back a full $2.00 to 162.31. (Or it may profit $1.00+ at the close—recall the 50% profit rule.) Either way, if the swing tier profits and you should have exited, this means the first tier is over. You would have profited $200 with a 100-share block trade, or $100+ with the 50 percent profit rule.
You might not have entered at all, and that's fine, but you still would have needed to recognize exactly when the trade ended. You must always be on top of your price levels, and also when the first tier is done, and when the second tier becomes the first tier. In other words, once the 164.31 swing level retraced for a profit, the current second tier at 165.59 became the new first tier.
Are you a little bit lost at this point? I understand. It will take more examples and real-world application before this makes any sense. During my training program, this is certainly one of the tough parts. And you're just reading, not driving—just looking at the map.
Let's finish this trade and move on. I entered short at 9:41 on March 23, 2015. That was when the price initially hit 164.31. I immediately threw a cover/buy order for my $2 profit at 162.31. I waited all day, the price never hit, so then I held my swing overnight. Such moves are perfectly normal, especially for this particular stock. Compared to my other, more volatile stocks, like TSLA and LNKD, IBM is a slow mover.
Now look at Figure 8.6, a five-minute map of a three-day period. The next day, the price never hit my target of a $2 profit at 162.31. So I held for another night. Finally, on March 25, 2015, the price dropped early in the morning. My exit price hit and I exited with my $2 profit. The first-tier swing level of 164.31 was now over, and the new first tier was 165.59 (the previous second tier). The reason why 165.59 became the new swing level is because it never hit it, thus making it the next level to trade when/if the price went back up.

Figure 8.6 IBM Five-Minute Chart
Sample Fusion Trade #2
On March 27, 2015, I used TSLA, my most volatile stock. Depending on when you're reading this, you should be able to back-test the price levels used here on most charting platforms using the daily chart.
Because TSLA moves so fast, I always recommend that with that stock, you do not try a fusion trade off the first tier. That's especially true when the first tier is so close to the second tier—in this case it's exactly $3 off. A three-dollar gap may sound like a lot to you, but if you know TSLA, it's not much. For instance, note the huge gap between the second tier of 184.32 and the third tier of 177.22 in Figure 8.7. This means the first tier was really risky for starting a fusion trade. This is where most of my trainees struggle, or they flat-out break this rule by fusion trading off a first tier, and find themselves in deep water.

Figure 8.7 Daily Chart Levels and Swing Levels—TSLA
Also note that on this particular day the first tier swing of 187.32 actually missed, meaning it came within 25 cents of entry, and then pulled back for $2. So the first tier could not have been traded anyway. I finally started fusion trading off the second tier swing price level of 184.32.
I resolved the situation by using two intra-day newly formed levels (new lows of the day) as my fusion entries leading into my second tier swing entry. This setup would become two separate trades, all in one day. The first trade would be a $400 profit and the second trade off the actual swing level would be the standard swing trading $200 profit ($2 pullback on 100 shares). The end total would be a $600 profit on this one fusion trade setup.
Again, you will always start with 100 shares on each entry, so bear in mind that $600 is the minimum that could have been made on this setup. Eventually, when you master this system and have enough capital, you can enter more and make more.
In Figure 8.7, note the price levels I had to work with at the opening bell on 3/27/2015. I had my current swing supports, the second tier being 184.32.
Figure 8.8 is my whiteboard. It shows my price levels organized in numerical descending order. Notice that I crossed off the pre-market support because it was more than $3 off my second tier swing entry of 183.32, and the previous day high of 189.70 couldn't be traded because the market opened below this price level at 189.11. If I wanted to fusion trade into my swing, I would need to wait for newly formed intraday lows that were within $3 of my swing entry price. I'm boxing that up big and clear:
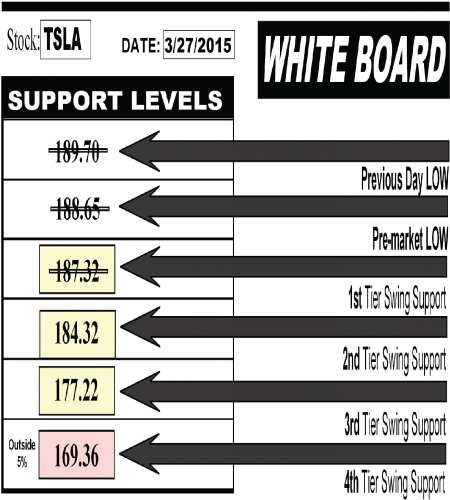
Figure 8.8 Whiteboard
In this case my second-tier swing price level was 184.32. My swing entry was $1 past that level, so it was 183.32. Therefore I was looking for newly formed intra-day levels that were within $3 of 183.32. This translates to any newly formed intra-day low price at or below 186.32.
On March 27, 2015, my first support formed within $3 of my swing entry price was the 185.70 intra-day low at 9:57 a.m., as indicated in Figure 8.9. So my first fusion entry would be 25 cents past that intra-day level. Once the price dropped to 185.45 at 10:17 a.m., I entered my first 100-share fusion trade.
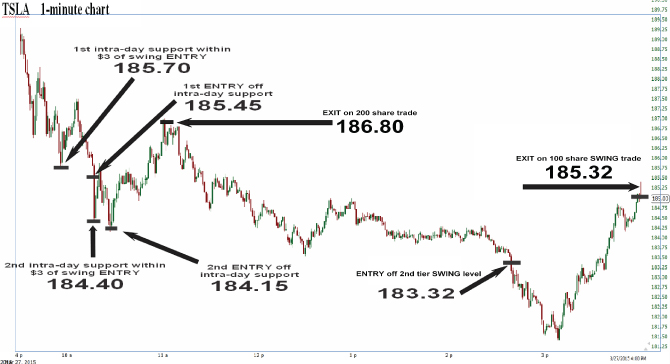
Figure 8.9 TSLA One-Minute Chart
At this point, you would have had two options. Once you entered at the 185.45 intra-day level, you could have simply recognized a 15-cent profit and then exited the trade. Then you could have waited on the sidelines until a new intra-day low formed and/or the actual swing entry hit. You know that when you're first learning this system, I want you to just take the 15 cents. But in this example I'm showing you what I do when I fusion trade, and what you will do in the future.
I waited for the full $2 profit on all entries (or I would close at 50% or more). In other words, after my first entry off the 185.45 price level I was hoping to exit at a $2 profit, so I needed 187.45 to hit, and—it didn't. So I went to plan B, which was to wait for a new low to trade and/or a swing entry to hit.
Not long after my first entry, a newly formed intra-day low was created at the 184.40 price level (the 10:17 candlestick in Figure 8.9). So I decided to make my second entry off this. Once it hit initially, I was going to enter at 184.15. This happened at 10:27.
Note that the entries are at least 50 cents apart (remember the Golden Rule). And in most cases I like my intra-day entries to be $1.00 apart, especially with a highly volatile stock like TSLA. This is a perfect example of how each stock needs to be traded slightly differently, according to its speed and volatility.
Now I had 200 shares off two intra-day levels. At that point my average price on my 200-share position was 184.80. I was looking for a $2 pullback on my current fusion 200-share setup, or I would enter my third trade off the swing at 183.32.
It turns out that the stock reversed for my $2 pullback on the first 200 shares, before it hit my swing. This is always a great trade! As soon as it hit 186.80 at 11:00 a.m., I took my $400 profit. After that, the price began to drop again toward my original swing level—that was still in play. So I waited for the second tier swing to hit next.
It took all day for the second-tier swing entry of 183.32 to hit. At 2:39 p.m. I entered my swing trade at the 183.32 price. At this point I was still looking for a $2 profit on my 100-share position, which had now become a swing. I needed the price to reverse to 185.32 for a full $2 profit. The price actually reversed just before the bell rang, during my final-hour rally to get my full $2.
Now look closely at Figure 8.9, particularly the huge drop after I entered my swing trade at 183.32, the time being 2:39 p.m. By 3:09 p.m., the price had dropped all the way down to 181.41. So the price dropped almost $200 in the red before it pulled back. Not only was this normal, but keep in mind that the third tier was 177.22. In other words, the price could have dropped all the way to 177.22 before reversing.
Welcome to swing trading! You need a thick skin to ride these trades out. If you can't handle this rollercoaster, you'll never become a pro-trader. Believe in your levels and have confidence, and on every single trade be prepared to be dipping deep in the red before the trade reverses back into the green. It's all about knowing your swing levels, and choosing the correct levels to begin fusion trading. Some stocks you can fusion trade off the first tier, and with others you need to wait for the second or third tier. This takes weeks of training to master. So again, don't assume that you can fusion trade off a first tier on all stocks.
Sample Fusion Trade #3: An Advanced Fusion Trade
In this fusion trade example I use FDX. We'll focus on the swing support level first-tier of 168.03. The first day the price dropped within $3 of the first tier swing was on March 24, 2015, but it took until the next day to hit the entry level of 167.03.
On the right-column side of Figure 8.10 I show the daily levels that highlight the current swing support levels.
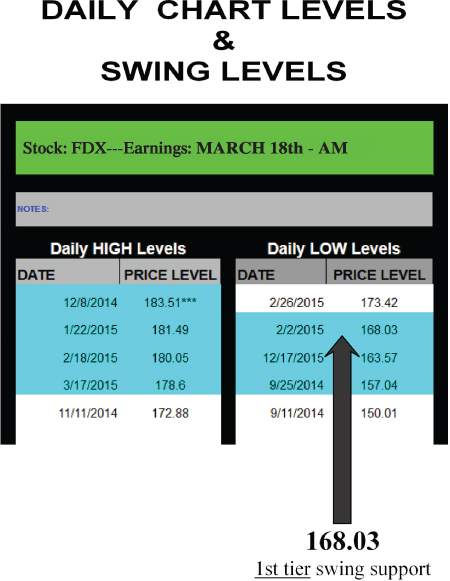
Figure 8.10 Daily Levels
In this example the swing entry price of 167.03 hit in pre-market trading. When this happens to you, you need to adjust your swing entry price to reflect the pre-market low price. Trying to trade off of pre-market for a swing entry is more advanced and requires more precaution, so I'll box it up for you:
I chose to trade the pre-market low before waiting for the second tier swing level to hit. Note that the opening price on this day was much higher than the pre-market low. This happens from time to time, and it only means that the stock had a lot of volatility in pre-market trading. The reason why I couldn't trade the previous day low of 169.16 was because the first-tier swing of 168.03 had already broken in pre-market. So your first entry should be off pre-market low in this case, or you would wait until second-tier swing support hits.
In Figure 8.11, I crossed off the previous-day level of 169.16. I also crossed off the 168.03 first-tier swing level, but that does not mean the first tier swing had cycled through. It was still valid, but I had to adjust my entry to be off the pre-market low. This is a perfect example of how intra-day levels can dictate your swing price entry.
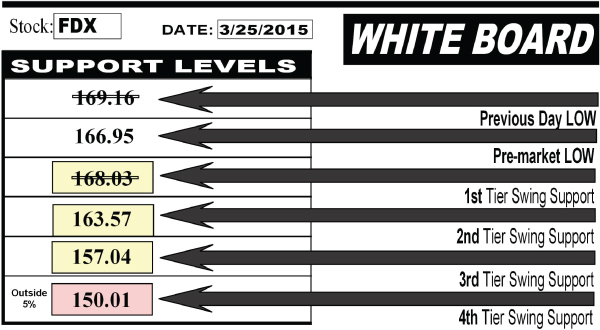
Figure 8.11 Whiteboard—FDX 3/25/15
My first swing entry had to be 50 cents past the pre-market low price of 166.95, making it 166.45. It didn't pull back on March 25, 2015, for my $2 profit, nor did it close above 50 percent of my profit. So I held overnight. This was fine because it was a swing trade.
Remember, I was trading the first-tier swing, but it hit in pre-market, so I simply adjusted my swing entry price to reflect the pre-market low, which was 50 cents past. So again, my first-tier swing entry price was now 166.45, and not 167.03 ($1 past the first-tier swing of 168.03).
The next day I was looking for the price to pull back to 168.45 for my $2 profit. If that were to happen, then the first-tier swing would be done, but the price did not go up. Instead it dropped even more. Now I was looking to fusion trade into the second tier support of 163.57.
In Figure 8.12 I logged the 3/26/2015 whiteboard price levels.
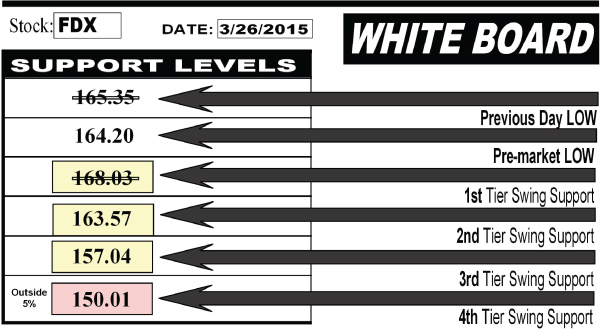
Figure 8.12 Whiteboard—FDX 3/26/15
The first factor I need to point out is that the stock price on March 26, 2015, opened at 164.28. So I immediately checked off my previous-day low of 165.35. My pre-market low was 164.20. Keep in mind that I was within $3 of my next swing entry, which was off the second-tier swing level of 163.57. Therefore I decided to fusion trade. I entered my second 100-share block trade 50 cents past the pre-market low of 164.20, making it 163.70. I now had 200 shares with the average of 165.08. I needed 167.08 to hit for my $2.00 profit.
Keep in mind that my second entry was a fusion trade off an intra-day level (pre-market low). I could not hold that level overnight. So I needed to sell 100 shares at the close, if I was in the green, or, if in the red, I would be forced to stop-loss on that 100-share intra-day portion of my swing trade. Either way, I was keeping my first 100-share swing entry of 166.45 until it profited $2.
On March 26, 2015, the price never hit the average of 167.08, but it did close at 165.49. That meant I could sell my intra-day fusion trade of 100 shares for a profit. I entered at 163.70, so at the close I recognized a $179 profit.
That was fusion trading at its best. I was able to make marginalized profits from an intra-day trade while in a swing position that had yet to make me money. In Chapter 9 of Part 5, I cover pivot trading, an advanced strategy. The fusion trade setup in Figure 8.13 is a prelude to what that's all about.

Figure 8.13 March 25, 2015, Original Swing Entry
Now that I was out of the intra-day trade, I was still holding my original 100-share swing trade from the 166.45 level. The next day, on March 27, 2015, a Friday, the price went totally sideways. That meant no fusion trades and no exit. I would have to wait until Monday, March 30, 2015, to make any new decisions. For now this was a hold over the weekend.
Again, this is totally normal. You have a plan and you're in control of your strategy. You can go and enjoy your weekend; you will profit next week.
The charts in Figures 8.13 and 8.14 show the actual intra-day trade setups for this entire fusion swing trade on FDX. The trade lasted several days. I used five-minute candlestick charts so that it is easier to see the entire day of trading activity in each chart.
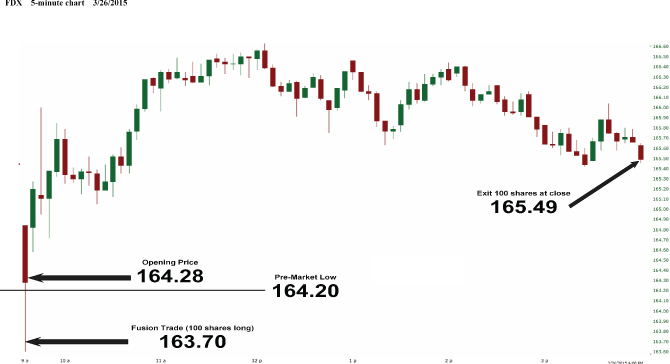
Figure 8.14 March 26, 2015, Fusion Trade Setup
Figure 8.13 reflects the original swing entry that took place on March 25, 2015.
Figure 8.14 reflects the fusion trade setup that took place on March 26, 2015. This fusion trade happened within seconds after the bell rang.
Also notice in Figure 8.14 that the high of the day hit roughly one full dollar higher than the closing price where I exited. It's easy to look at the chart in hindsight and ask why I didn't sell when it was at the 166.50 price level. If you were to ask me that, I would respond by asking you: How did you know that was going to be the high? You could not have possibly predicted that. What I can indeed predict is my own steadfast consistency. For instance, I was waiting for my $2 profit as always. Again, I needed the price to hit 167.08, and it never hit. So I kept holding till the close. That was my plan to begin with. Either way I profited. The key lesson here is that you need to stick to your plan—stick to the system. This just happened to be a very low-volatile day so the price never hit my $2 profit target. All I am concerned with is not holding my intra-day fusion position overnight.
So my plan was twofold: simply hold intra-day for my $2 profit, or wait till 3:39 p.m. and close out my intra-day 100-share portion of the 200-share swing trade with either a small loss on the 100-share fusion trade or a small profit on the 100-share fusion trade. I happened to profit the $179 on this particular day. And I held the swing 100-share original position overnight.
In Part 5 on advanced trading techniques I will show you what to do if the 100-share fusion trade was in the red at the close. For now, just understand that you are still in a swing with the original 100 shares and can intra-day fusion trade while holding that position.
Figure 8.15 reflects the non-activity trading session on March 27, 2015 (Friday). No trades were placed. I held the original swing trade position over the weekend (for you, that would be a 100-share position). The price does drop a bit, but I was waiting for the second-tier 163.57 to break. The second-tier swing entry of 162.57 never hit on this day, so no trade. And, no fusion trade could be made because the low of the day broke well past 2 p.m., and I didn't want to risk the stock not retracing that late in the day—again, no trade.
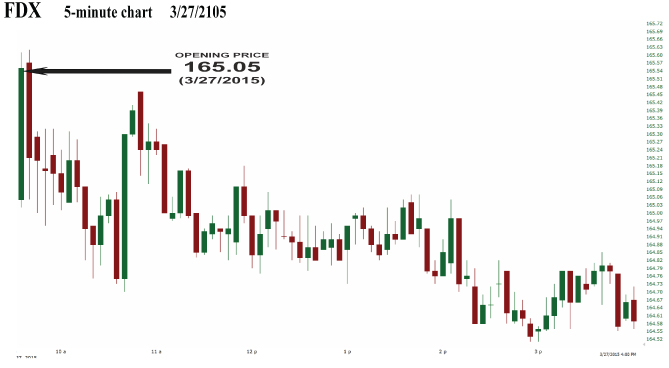
Figure 8.15 March 27, 2015, Non-Activity Trading Session
Figure 8.16 reflects the non-activity day on March 30, 2015 (Monday). I held the original 100-share swing position over the weekend. The price starts to head up, in my direction, right after the bells rings. Recall, I needed 168.45 to hit so I could exit the swing trade. Also, there was no fusion intra-day trade simply because the price was heading up all day and never broke the low of the day at 164.98.
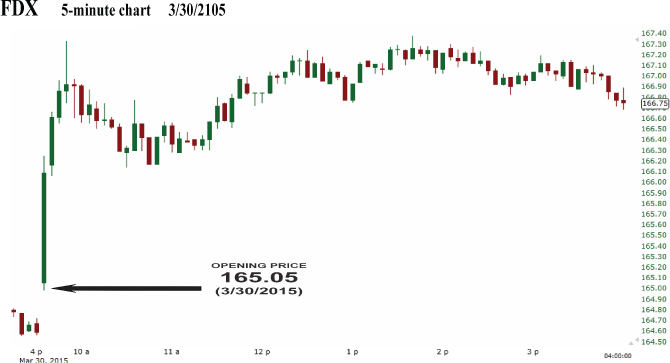
Figure 8.16 March 30, 2015, Non-Activity Day
If the price had reversed within the first two hours of trading, then I would have fusion traded the intra-day low of the day. It didn't, so no fusion trade. I held swing position overnight again.
Tuesday (March 31, 2015) was another sideways day. There were no opportunities to fusion trade. So I held again overnight.
This would be a good time to remind you that I am certainly trading other stocks while in this holding pattern on FDX. I am gathering all my whiteboard levels each morning on my other 8 to 10 stocks that are in my online trading room.
You as a beginner may only be trading this FDX trade exclusively, but that doesn't mean you can't be watching and paper trading other stocks for the experience while waiting on your profits from this current (FDX) swing trade.
Keep in mind, if you get hyper-focused on your single position, you will most likely get emotional and restless. Do not allow your emotions to force you to stray from this system. Furthermore, there are fusion trades to be made in this FDX swing-hold, as I just showed you. So remain vigilant! Get your whiteboard price levels each morning.
This particular setup has been five trading sessions since we entered original first-tier swing on March 25, 2015. Again, this is totally normal. Sometimes a swing will pull back within minutes, and sometimes it runs to the fourth tier and takes all day; in this case it's been uncommonly sideways in the market, so FDX is also trading relatively sideways, and therefore our swing exit is not hitting right away.
At this point I will be looking to exit anything over 50 percent of my profit. Or I will exit by reentering another fusion trade that gives me $1.00 on a 200-share average fusion trade. Recall, I have already recognized $179 on this overall trade setup with my previous fusion trade. We will see what happens the next trading session on Wednesday (April 1, 2015), or later.
Figure 8.17 reflects the setup that took place on April 2, 2015, when I exited the swing trade. This swing trade took six full trading sessions to conclude. I ended up taking $1 profit (50% of target).
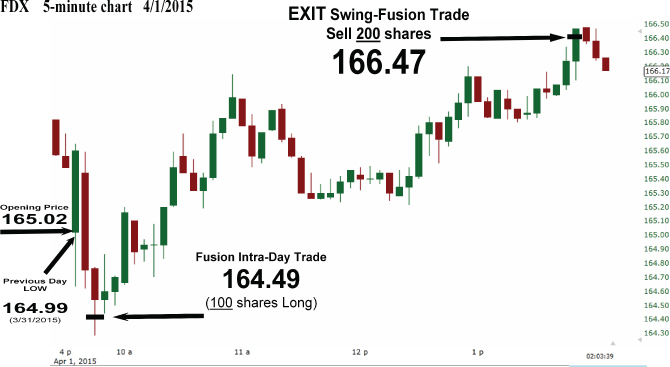
Figure 8.17 April 1, 2015, After Exiting Swing Trade
Why? As mentioned previously, because this trade was taking so long. I typically will take 50 percent of profit target if holding a first-tier swing trade for more than three days. But you must be aware that the first tier is not over. Recall, the first-tier swing was 168.03. So the standard entry was 167.03 (not my fusion entry). Therefore, the price need to pull back to at least 168.03 for the first tier to have cycled through.
I was able to exit on April 1, 2015, because I fusion traded it. Here was my fusion trade (noted in chart 2.3). The pre-market low was 165.45 and my previous-day low was 164.99 (on 3/31/2015). I eliminated the pre-market because it was within 50 cents of my previous-day low. So I made my first fusion intra-day entry off the 164.99 previous-day low price levels. I entered my fusion trade with 100 shares, 50 cents past, so my entry price was 164.49. So my average price on my original 100-share swing position and the current 100-share fusion position is 200 shares at 165.47 ([166.45 + 164.49] / 2).
I was only looking for $1.00 profit. The price hits 166.47 at 1:49 p.m. on April 1, 2015. I exited the trade with a net $200 profit.
Final Words on Fusion Trading
You will most likely only enter your intra-day fusion setups during the first two hours of the market due to high volatility. Therefore, it would be wise to not try to fusion trade after 2 p.m. After 2 p.m. you should simply wait for the actual swing entry to hit. If your next swing level doesn't hit, then no trades should be made after 2 p.m.
This 2 p.m. advice is not a rule that applies across the board, and I certainly do not follow this advice myself. This rule is meant for beginners to the system, because you are not in rhythm with your new stock.
To recap, the fusion of a trade is essentially used in two scenarios: when your swing entry hits in pre-market and you have to adjust your new swing entry price, and/or when the current price is within $3 of your next swing entry price—you then begin intra-day trading using the Golden Rules.
In Part 5 you can expect to see more fusion trades. In addition I will be showing more advanced strategies such as pivot trading and side line trading. But first you need to completely understand how fusion trading works.