
3
Industry Forces
When an industry with a reputation for difficult economics meets a manager with a reputation for excellence, it is usually the industry that keeps its reputation intact.
Warren Buffett
If your organisation was in the security and brokers industry between 1992 and 2006, it is likely that you would have sustained a healthy return over this period, as the average return on investment capital (ROIC) for the sector was 40.9%. However, had you been in catalogue and mail order houses your organisation may well have struggled to achieve much more than the average of 5.9% ROIC. This raises the question: why is it that some industries1 seem to be consistently more profitable than others?
The variation in industry returns (ROIC) for selected industries, between 1992 to 2006, is shown in Table 3.1. This variation can be explained by each industry’s characteristics; the dominant structure, the evolutionary phase and the underlying competitive and cooperative forces. For instance, in the soft drink industry, a duopoly of Coke and Pepsi allowed these two organisations to dominate all other competitors and have very significant power over customers. This industry was clearly more profitable than the poor old airline industry, which consistently failed to earn its 7–8% cost of capital year in and year out, largely because of fierce competition between companies that prevented them from generating significant profits.
Table 3.1 Annual average ROIC2 1992–2006 selected industry segments
| Industry segment | Average annual ROIC (%) |
| Security Brokers and Dealers | 40.9 |
| Soft Drink Manufacturers and Distributors | 37.6 |
| Packaged Software | 37.6 |
| US industry average | 14.9 |
| Hotels | 10.4 |
| Airlines | 5.9 |
| Catalogue and Mail Order Houses | 5.9 |
Source: Porter, 2008
Strategic Hell: Perfect Competition
For strategists, hell is a set of (industry) dynamics that combine to remove any options other than to do what everyone else is doing. This culminates in an organisation being forced to take the industry price (i.e. be a price taker) rather than having discretion to set a different price (i.e. be a price maker) through innovative products and services or through having proprietary ways of reducing costs. The epitome of such hell is perfect competition, illustrated in Figure 3.1.3
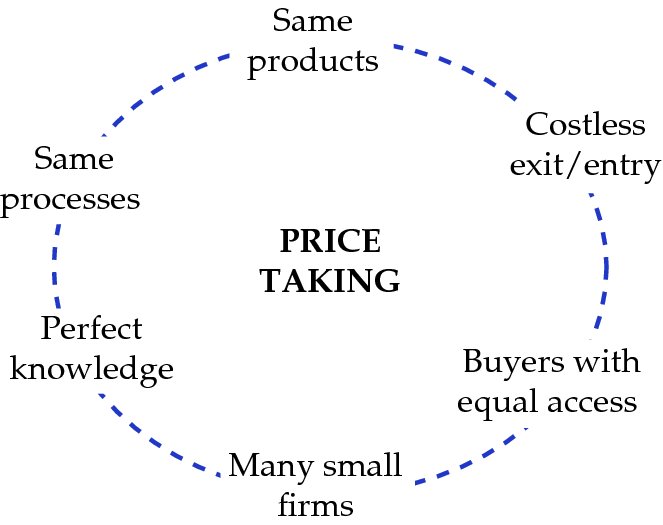
Figure 3.1 Perfect competition
In perfect competition, there are many sellers and hence no scope for coordination of market pricing. The organisations are too small to achieve any firm-specific advantages through economies of scale and, as they all use the same technology and production techniques, no cost advantages are available at the process level. They all sell products that, in the eyes of their buyers, are the same and those buyers can easily switch from one supplier to another. On both the demand and supply sides there is informational transparency and hence swift dissemination of any innovation in product or process.
In this environment organisations are forced to take the prevailing market price. If an organisation increases its prices above the market it sells nothing and there is little point in setting a lower price as it is already selling all it can at the market price. As such, average long-term profits trend towards being equal to the cost of capital wherein the organisation can earn just enough to compensate for the level of risk in the industry – what economists call normal profits. If profits move above this level, new organisations enter the industry to grab their share and, if profits fall, then some organisations will exit to pursue other opportunities and overall profitability returns to the normal level. Note that if high exit costs exist, as is the case in many capital-intensive industries, organisations will be trapped into staying in the industry even though they are making poor or negative returns as the cost of staying in is less than the cost of leaving.
To achieve returns greater than the cost of capital industry imperfections must exist. These imperfections (like those illustrated in Figure 3.2) are the opposite of the factors driving perfect markets and include product differentiation, entry barriers, switching costs and so on.
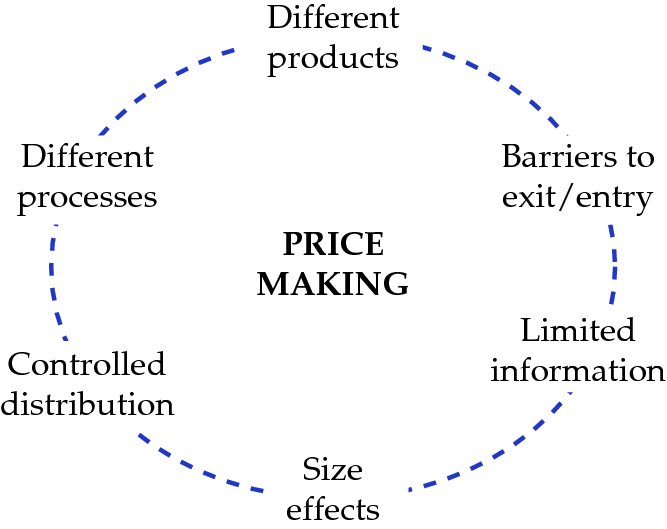
Figure 3.2 Imperfections
If a firm can develop and exploit such imperfections better than its rivals, then it will outperform the average of its industry returns and have competitive advantage. This advantage will be sustained as long as those imperfections, and the firm’s unique ability to exploit them, last. One view of strategy, then, is that it is the ongoing quest for returns greater than the cost of capital through the establishment and exploitation of firm-specific imperfections. While some industries are born nearly perfect, some become that way over time due to the underlying, evolutionary forces. It is to these industry-shaping forces that we now turn our attention.
The Industry Life Cycle
Industries are born, they grow, mature and in some cases eventually die. This has been captured in an Industry Life Cycle model (ILC)4 that describes this evolutionary pattern as Introduction, Growth, Maturity and Decline (see Figure 3.3). At each stage of this cycle each industry has its own critical success factors (CSFs) that all organisations must address in order to be successful. Those win-the-game (WTG) attributes that give a competitive edge initially become a standard in-the-game (ITG) requirement as competitors imitate and improve on the original offering or capability. Japanese manufactures stole a march on their international rivals in the 1980s with the quality and reliability of their products, but these features are standard for durable consumer goods like cars, washing machines and televisions in the 21st century.
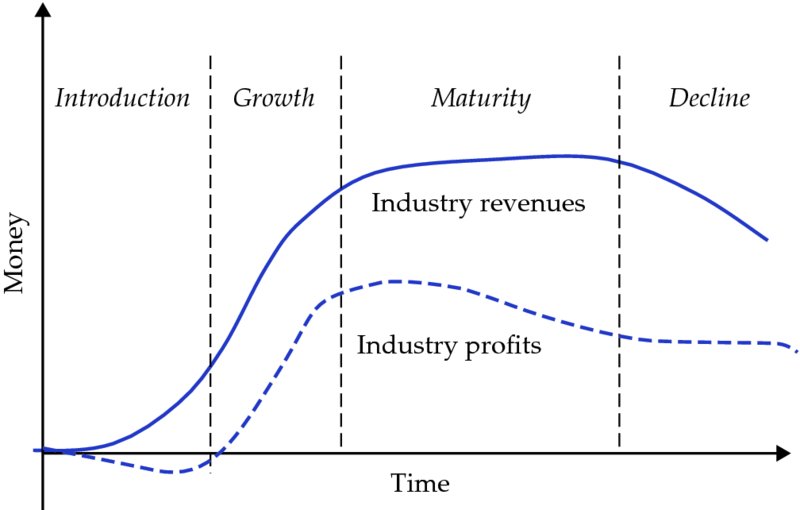
Figure 3.3 The industry life cycle (ILC)
The phase of the ILC that an organisation is in will have implications for profitability and cash flow. In the early, introductory or innovative phases of the industry life cycle (ILC) (Figure 3.3), profitability and cash flow are often sacrificed to gain a foothold for the future. The growth phase is when the industry will achieve significant and fast-growing profits. These will continue into the maturity phase but over time will come under pressure as the sources of competitive advantage are competed away. In the decline phase, it is increasingly difficult to make profits but not impossible through careful cost reduction.
The ILC is useful to organisations as it gives a general indication of the different strategies that they might follow to be successful at different stages (Figure 3.4):
- Introduction: At the early stage of industry development the features, benefits and functions of the product are the CSFs. Most product industries go from birth to death rapidly as the new product fails to generate sufficient customers. Those that do find sufficient acceptance grow rapidly once a critical mass of consumers develops.
- Growth: As the industry grows there tends to be a convergence to a dominant set of product features. These become standard ITG requirements as, for example, all TV, mobile phones, personal computers, financial products etc. offer the same set of features and benefits. The industry growth rate can be steep and its duration can vary significantly with some products failing to catch on and others being passing fads such as plastic shoes, e.g. Crocs. Others may have extended growth phases due to industry-wide upgrades and enhancements. The foundations of ongoing success rest on superior marketing (distribution channels, brand, reputation) and operating processes (production, logistics, service).
- Maturity: As growth slows, consumers have become more knowledgeable, and processes as well as products have become common across all players. Product/process development continues and products around the common standards proliferate as companies seek to cover all the bases and gain an edge where they can. However, any improvements disseminate rapidly throughout the industry and parity is soon restored as competitors emulate and imitate the innovators.5 Increasingly it is superior marketing and distribution that separates the successful from the average. Cost reduction, to counteract increased price competition, is now an essential ITG factor for long-term survivors. Most industries in the industrialised world are mature with growth rates at about the same level as GDP. Accelerating sales in less-developed countries becomes the prime source of real industry growth. Hence industry consolidation through merger and acquisition, a fanatical focus on brand and marketing and relentless cost-cutting, become essential to ensure profitability. Industries can be de-matured and grow to new levels through innovation – for example, the low-cost airlines have markedly increased the number of people flying in Europe and America, or sometimes through a macro-environmental change – hence war is not good unless you are part of the armaments industry and a publicised increase in sexually transmitted diseases boosts the sales of condoms.
- Decline: In this phase, the skills of the financial undertaker come to the fore. Consolidation of now-cheap organisations and, hence, management of overcapacity, minimal investment and a controlled milking of the product to its final demise or niche existence are the basis of success. Whether the declining industry is profitable – such as cigars or quality fountain pens – or not – such as prepared baby foods – depends on how well surplus capacity is adjusted and also the extent to which resilient niches of price insensitive demand remain among the general decline.6 The problem for organisations in the decline phase is that growth can only come at the expense of other competitors – a “negative sum game”.
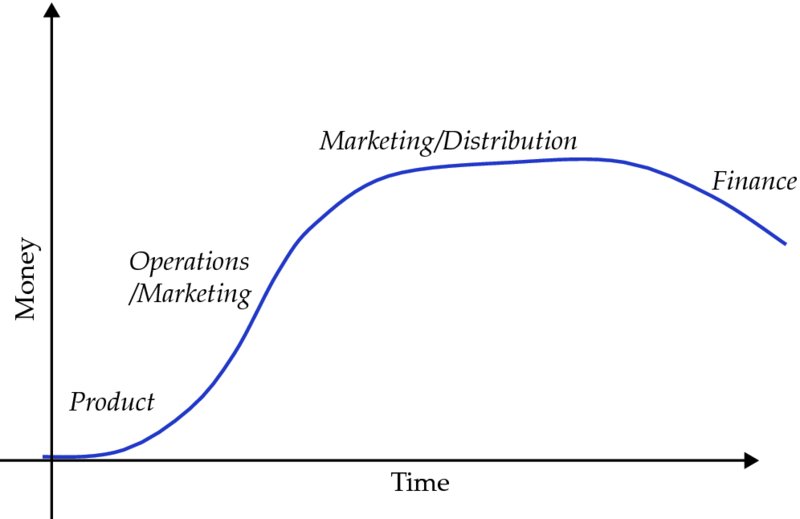
Figure 3.4 Generic critical success factors across the industry life cycle
The industry life cycle is a description of the past and not a predictor of the future and there is no straitjacket forcing specific dynamics to emerge at each stage. For example, industries can be de-matured by innovation or new thinking as the airline industry was de-matured in terms of passenger growth by the development of the low-cost operator. Or macro-environmental forces can shift to see a product or service become popular again (e.g. the rise of AIDS led to the rejuvenation of the condom industry). Or a determined mover and shaker can reignite an industry (e.g. Mat Hoffman in BMX, as described in live case 3–5; or Stelios Haji-Ioannou in European Airlines, as in the live case on easyGroup in Chapter 7). Such shifts can result in a “dolphin tail” effect where the downward curve on the right of Figure 3.3 can be rejuvenated back up again. Indeed, organisations’ sensitivity to flagging industry sales during the maturity phase may prompt innovation in order to rejuvenate the sector, so that there is a sequence of dolphin curves perpetuating the high growth rates of the growth phase in the organisational life cycle. Figure 3.5 shows how Apple has constantly rejuvenated industries with its new innovations.
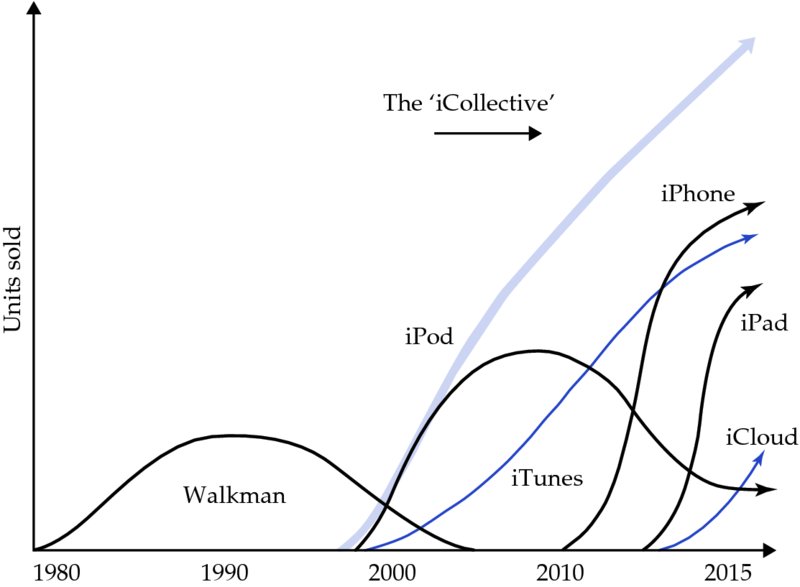
Figure 3.5 Dolphin curves for Apple “industries” )
(Source: Cummings and Angwin, 2015
Industry Structure
Mature industries are characterised by an overall structure that dictates to a large extent the nature and scope of the competitive advantages or imperfections theoretically available for companies to exploit. Economists have suggested four generic structures, each of which carries different implications for the organisations comprising the industry:
- Perfect competition has been discussed above and by definition there are no sources of competitive advantage. One of the most important strategic implications in such markets is that organisations are forced to take the market price. Regardless of other factors, commodity producers – e.g. steel, wheat, oil – take the market price whether that price is high, low or medium and so at the product level these are examples of perfect competition.
- Monopolistic competition exists where most of the other conditions of perfect competition hold sway other than the fact that each seller offers a slightly differentiated product, i.e. each seller has a monopoly in its own products. Sellers can charge different prices as individual price differences are not noticed by the many other sellers who, because they have differentiated products and hence relatively loyal customers, do not respond. Restaurants, doctors and hairdressers are all examples of such structures. In such industries, organisations do not have carte blanche pricing discretion but can price to what their market (segment) will bear.
- Oligopoly occurs when significant demand side economies of size are available to bigger companies and where there are many opportunities to differentiate. The industry coalesces to a few organisations that become big enough to leverage the cost reduction and have differentiation options. Pharmaceutical, soap powder, supermarket and aircraft industries are examples. It is in such industries that pricing is truly “strategic” in that the potential response of the other players is a critical input to the pricing decision.7
- Monopolies are organisations that have no, or at least very limited, competition for their products and hence can raise or lower prices without taking into account the responses of other organisations. Market-based monopolies, as contrasted with government legislated ones, can form where there are substantial economies of size and limited options for differentiation. The cost of getting big enough to compete with the entrenched incumbent is too high for potential rivals. So-called natural monopolies are industries where economies of size are large and where the minimum efficient size (MES8) is greater than 50% of the market. MES indicates the minimum level of output that is necessary to capture the lowest level of costs. If the MES is 50% or more, the first one to get to 50% market share gains such a cost advantage that others cannot catch up, and hence the first one moves on toward the other 50%.9 Power and water utilities and railways are examples of such monopolies in most countries.
Industry Forces
Driving the final industry structure as it evolves are the underlying industry forces. Figure 3.6 is likely the most famous strategy diagram ever published. It is Michael Porter’s encapsulation of decades of industrial organisation economics research and theorising into a framework that captures the fundamental ideas for non-economist managers. Three broad dynamics, power, entry and rivalry, interact to contribute to the potential profitability (attractiveness). These dynamics all influence the degree to which organisations have control over pricing, particularly in terms of being able to increase prices to lift margins or even just to compensate for increased costs.
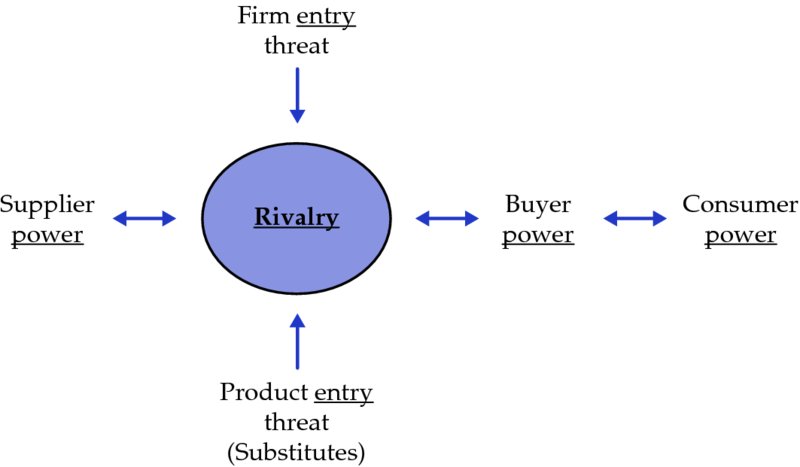
Figure 3.6 The Five Forces of Industry structure
(Source: adapted from Michael E. Porter (1985), Competitive Advantage (New York: Free Press, p. 6))
Power: the horizontal axis
Despite pious talk of partnerships, the buyer supplier relationships are power-based struggles focused on capturing as much long-term value for the organisation as possible while giving enough to the buyer or supplier firms to keep them connected to the organisation. There are many characteristics that interact to determine which party is the more powerful. These include relative size, switching costs and whether either party is able to backward/forward integrate.
The balance of power varies over time. For example, in the relatively recent past the major brand name suppliers such as Coca-Cola, Unilever and Procter & Gamble held pricing power over their supermarket customers. They were bigger, i.e. were more concentrated than their customers, and had more pull-through power with the brand-sensitive end consumer. Now, with the growing credibility of the supermarkets’ own label products and the increasing consolidation of the worldwide supermarket industry, the power has shifted. The pain that a Wal-Mart might feel from not stocking Coca-Cola is now potentially less than the pain that Coke would feel from being delisted.
Power is related to the degree of switching costs that is incurred in changing from one supplier or product to another. High switching costs promote lock-in wherein having made the initial choice, the customer has made an investment that now becomes costly to undo. Switching from one brand of toothpaste to another is a costless choice that can be made in the face of an opportunistic discount offer. However, switching from one MBA programme to another once you have taken the initial courses is more difficult. The search behaviour of customers and the marketing ploys of companies reflect this. Customers take far longer to evaluate high switching cost goods before making purchase commitments and companies design low-cost entry but high-cost exit pathways to lock customers into their phone contracts and house mortgages.
Power is one thing, but the inclination to use that power is quite another. This inclination is referred to as price sensitivity and indicates that customers are more sensitive to changes in prices of some products or services than of others. The factors that contribute to price sensitivity are mainly components of the extent to which a price rise from one firm takes value away from the other. Rich buyers who can easily pass on cost increases to their own customers tend to be relatively insensitive to price increases, particularly for a product/service that, while a low part of their overall costs, is important to their own product/service in terms of function or quality. However, buyers who are struggling to make money and/or whose own customers will not accept price rises, tend to be much more sensitive to the impact of a price increase. This is particularly so for purchased inputs that constitute a relatively large proportion of the buyer’s total costs and are not critical to the quality or performance of the final product.
Entry/substitution: the vertical axis
The vertical axis covers two areas: the entry of other organisations trying to get some of the industry value for themselves and the potential substitution by other products offering similar benefits. These both act to keep a cap on industry pricing.
If an industry is very profitable and earns well above its average cost of capital, then other organisations will be tempted to enter. The likelihood of them doing so will be affected by the nature of entry barriers to the industry. These can be various in nature but may include industry-specific regulations, political influences, socio-cultural differences, the need for high levels of capital investment and/or sustained commitment over time, lack of key resources and capabilities and distribution control. Some of these issues are relevant to the Carrefour case (see Live Case 3-2). Therefore, a firm’s willingness to attempt an entry will be lessened if:
- New entry will reduce prices and hence profitability. This can be due to such factors as increased capacity or the aggressive responses of incumbents. There are many point-to-point travel connections in the airline industry that are profitable to the one airline that operates the connection, but would be loss-making for both if another airline entered that route.
- The existing players have large advantages in such things as brand, locked-in distribution or scale-based low costs that are very expensive for a new player to match, i.e. there are high entry costs. Coke and Pepsi are protected from entry into their lucrative duopoly by over a century of brand investment.
- There are very high exit barriers, e.g. very costly asset-specific investments which must be written off on leaving the industry. A semi-conductor fabrication plant costs billions of dollars to build but has no application for anything else if you decide to leave the industry.
Industries are defined in terms of products that are close substitutes for each other and so the boundary between what is regarded as a competitor product and a substitute product is blurred. Substitutes have positive cross-elasticities of demand: as the price of product A is increased, the demand for substitute product B increases. Competitive products demonstrate very direct and swift cross-elasticities whereas more distant substitutes show longer-term relationships. Hence if a cinema chain puts up the prices of its tickets it will quickly lose customers to cinema chains that have lower prices.
However, if cinema tickets in general increase in price, the demand for substitute forms of entertainment, such as bowling, football and live theatre may increase but at a slower rate. Despite this slower rate, the price of these substitutes still acts as a cap on cinema ticket prices even if rivalry does not exist between cinema chains. The main driver of the growth of the plastics industry was value-adding substitution. It replaced various packaging materials such as paper, cardboard, glass, metal and structural materials such as timber and steel. Nowadays in many packing and structural applications, plastic is a competitor product for other materials more than a substitute, and vice versa.
Rivalry
This middle force of the five, which is also engaged in both the horizontal power play and the vertical entry play, captures the impact of the ongoing direct competition between industry participants. The more that the industry reassembles perfect competition the fiercer the price competition and the more unattractive or unprofitable it becomes. Rivalry then is affected by industry growth rate, so that stages of the industry life cycle are variously a positive sum, zero sum or negative sum game. Rivalry is also driven by managers’ personalities and different local and international cultures, with different goals and different ways of dealing with competition. Some managers will be tenacious to the last, preferring an ongoing knock-down-drag-out fight, while others favour a more genteel way of doing business. Hence, while pharmaceutical oligopolies engage in marketing wars, French hypermarkets engage in price wars and the attractive returns of some are gained at the expense of others.
Industries are not necessarily homogeneous with respect to rivalry. In some cases, there are clear demarcations between sets of competitors adopting similar strategies aimed at similar customer segments. These sets of competitors are known as strategic groups.
Strategic groups
Even though organisations in the same industry may produce products and services that have similar basic characteristics, they are not direct competitors in the minds of CEOs and customers. For instance, Rolex and Swatch both produce time telling products with the same basic functionality, but would not be confused by their customer groups. Similarly, with cars, customers for Ferraris are not the same as those purchasing a Tata Nano – and those companies will be organised in quite different ways. Therefore, within an industry there can be different groups of organisations that compete with each other within the group but not so much with other competitors in other groups. These different strategic groups will consist of organisations that will have different emphases on competitive strategies and the key resources and capabilities necessary to win. For instance, in the pharmaceutical industry there are wide variations in the amount spent on Research and Development (R&D), marketing and logistics, depending upon whether the organisations are focusing on developing the next “blockbuster” drug or whether they are aggressively reducing the costs of manufacturing and distributing generic medicines.
In order to ascertain whether an industry has strategic groups, and their specific characteristics, key variables critical to that industry should be determined. The value of the strategic group analysis is greatest when variables are identified that are specific to that industry, rather than generic ones – in other words those that keep a CEO in that industry awake at night. For instance, in the hotel industry, room occupancy might be one such variable rather than simply price and cost. A check is also to ask whether that variable makes sense in another industry, i.e. room occupancy doesn’t really have meaning in the pharmaceutical industry. Having selected a range of variables, two should be selected that are “orthogonal” to each other, i.e. not correlated. These can then form the axes of a strategic group analysis and the coordinates of companies in the industry can then be plotted (see Figure 3.7). It is worth noting that this analysis can provide insights in general terms (such as impressions of the variables being used) as well as in strict quantified terms where everything is measured.
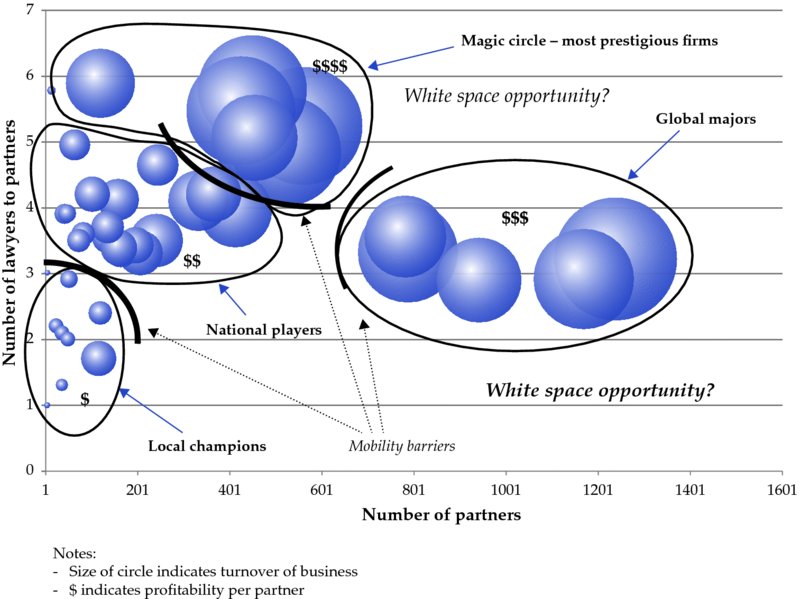
Figure 3.7 Strategic group analysis
Once the companies are plotted, lines can be drawn around those that are close to each other – free-hand irregular shapes are far more useful here than beautifully drawn circles. These are strategic groups in the industry and should be labelled in evocative ways to encourage deeper thinking about the groups than just the axes of the chart would indicate on their own. It is always worthwhile repeating the exercise to see if the groups remain with different variables. This way the robustness of the groups can be determined. When the groups are identified there is a further check to make. If the groups line up on either diagonal axis, then the axes are correlated and the value of the analysis is diminished.
The power of strategic group analysis is that it allows useful interrogation of the graphic that is produced. Financial data can be added to the figure of organisations’ profitability in order to identify industry profit pools and areas where little profit is being made. It is then instructive to think about whether companies in one strategic group (a low profit area) might move to a high profit area. This will prompt discussion about whether there are “mobility barriers” (a concept that resonates with barriers to entry in the Five Forces analysis) to prevent new entrants (these are shown as solid curves in Figure 3.7). These might be technical, brand, reputation or financial barriers, for instance, that impede the movement of organisations between groups. Over time mobility barriers may be eroded or overcome and they may even be developed. Equally there may be barriers to exit that are preventing low profit organisations from leaving their area. This may help explain profit pools in an industry and whether they are durable or ephemeral.
The analysis is also useful in identifying “white spaces” – areas where there are currently no competitors. It may well be that new innovative possibilities have been identified and should be considered as new strategic opportunities (assuming that any mobility barriers can be overcome). Of course, there may also be good reason why these white spaces exist as they may be combinations that customers do not value and will never value. They simply provide ideas, or hypotheses, that may be tested further through market research.
Cooperative Forces
The overriding goal of organisational strategy is to create value for the firm’s stakeholders. With this in mind, we can see that, while competition over your share of the value pie might be an inevitable consequence of being in business, there is also much to be gained by cooperation with other organisations in increasing the overall size of that value pie. Figure 3.8 captures this idea by explicitly identifying the role of complementors.10
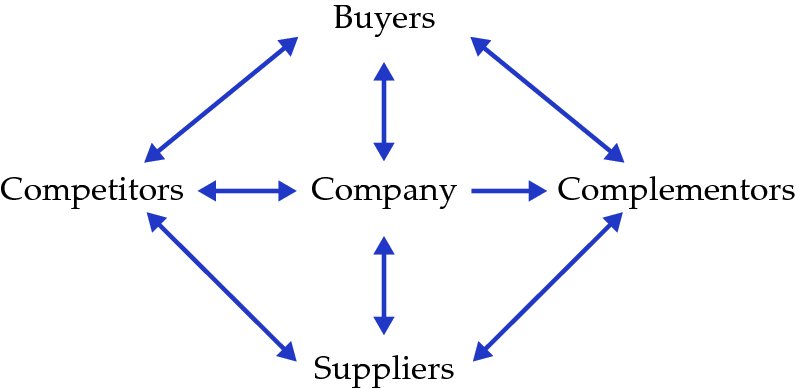
Figure 3.8 The value net
(Source: Adam Brandenburger and Barry Nalebuff (1996), Co-opetition (New York: Currency Doubleday))
Complementors
Complementors are companies from which customers buy, or to which suppliers sell, products that are complementary to the organisation’s products. A complementary product is one that makes customers more willing to buy it or suppliers more willing to supply it. Hence, manufacturers of games consoles and designers of games are in a complementary relationship in that increased success of PlayStation, for example, is of value to the designer of PlayStation games. Similarly, Microsoft would cooperate readily with a games designer who promised a “killer” Xbox game.
Complementary products have negative cross-elasticities of demand: as the price of Product A increases the demand for its complement, Product B, decreases. A recent example of this was the impact that sharply rising gasoline prices had on the demand for the complementary products of cars in the USA. As gasoline prices rose the demand for gas-guzzling SUVs declined to be replaced by demand for cheaper, more fuel-efficient, vehicles. For car companies like Toyota, which made the same profit margin from one SUV that they made from 10 small cars, the impact of complements was significant.
Functional necessities, such as games and consoles, CD/DVDs and players, pens and paper, etc., are obvious examples of complementary products/relationships. But so too is the relationship between roads and cars, yet initially the major car companies in the USA had to build seedling roads to encourage public pressure on government to develop highways – a lack of roads would have discouraged many from buying a car.11 The Michelin restaurant guide, by encouraging gastronomically inclined car owners to drive to distant restaurants, also encouraged tyre wear and purchase – hence restaurants become complementors of tyre companies.
Competitors can also be complementors by increasing the market size for the product. Hence, although the low-cost airlines in the Western world have certainly caused major problems for the full-service flag carriers, they have also generated a significant increase in the number of people who are flying. In the long term this may prove to be very valuable to the major airlines once they have reduced their operating costs in line with the low-price industry in which they now operate.
Co-opetition
The competitive and cooperative tensions in a complementary relationship are captured by the term co-opetition, first used by Brandenburger and Nalebuff. As well as helping to increase the size of the value pie through complementarity, organisations become increasingly able to compete to grab more of it if they:
- Become substantially bigger than their complementor(s)
- Have a greater influence on pull-through of customers
- Have more credible threats of integration into their complementor’s functions than their complementor is able to muster
- Have customers who find it costlier to switch from the firm’s product than from the complementor’s offering.
For example, in the complementary relationship between PC manufacturers and software developers, Microsoft’s share of the bundled value of hardware and operating system has not diminished as prices of PCs have tumbled over the past two decades. A quick run through of the above factors will help to explain this.
Heightened awareness of complementors has been a factor in mergers between content and channel providers such as Sony with Columbia Pictures and AOL with Time Warner. In these examples, the complementarity was seemingly obvious but subsequent value was not, e.g. Sony wrote off 3.2 billion dollars at the end of its complement-driven acquisition and the AOL Time Warner deal has gone down as one of the worst in history.
We started this chapter by asking why it was that some industries are more profitable for companies and investors than others. As discussed in the sections above, some of the reasons for this lie in the interacting forces of the industry and the different stages of its evolution. While some industries have product–process–buyer interrelationships that lend themselves to multiple opportunities for advantage over other organisations, others have dynamics that constrain the ability of the organisation to outpace its rivals. The strategic hells of near perfect competition, augmented by overcapacity in some capital-intensive industries, can be contrasted with the strategic heavens of differentiated oligopolies or brute monopoly power.
Industry forces are demonstrably important, as are the other environmental forces covered in the discussion of the macro-environment in Chapter 2 and the description of the role of key stakeholders in Chapter 1. However, environmental considerations are neither the sole, nor necessarily the most important, determinants of the individual organisation’s strategic fate. Some organisations consistently outperform their industry rivals as well as other firms in more attractive industries. Levers of successful strategy are in the hands of the managers, and it is to these levers that we turn our attention in the next part of the book, which deals with strategic, resources-based, business model and corporate strategy advantages to strategy development.
Industry Forces Key Learnings Mind-Map
Having read and reviewed this chapter, outline what you believe to be the key learnings from the chapter and the relationships between these on the note pages below.

3-1 Sportsbrand: Winners and Losers12

In the 1960s, a change took place in the sporting apparel and footwear markets. Until then, by far the most important consumer had been the amateur or professional athlete who wore the shorts, tops, tracksuits, specialist shoes and other paraphernalia necessary for his/her particular sport. Of this group, the largest segment comprised the millions of amateur sports enthusiasts throughout the world. Direct promotions to these consumers and promotion via endorsement by top athletes made a performance-enhancing proposition, i.e. “wear our kit and be a winner”. Then, in the “swinging sixties”, pop groups like “The Rolling Stones” began to wear “trainers” (i.e. running shoes) as a counter-cultural symbol of youthful rebellion; and so Reebok, Nike, Adidas, etc. became fashion as well as sports brands.
The wholesale global sportswear industry is worth more than $60bn per year and nearly $150bn at retail. The top two brand companies, Nike and Adidas/Reebok, share 40% of the branded market (29% of the total). While these firms retain the core competitive functions of marketing and design, manufacturing is outsourced to the lowest cost sources in a long global supply chain (Figure 3.9), e.g. market leader, Nike13 (20% of the branded market) has over 700 suppliers worldwide.
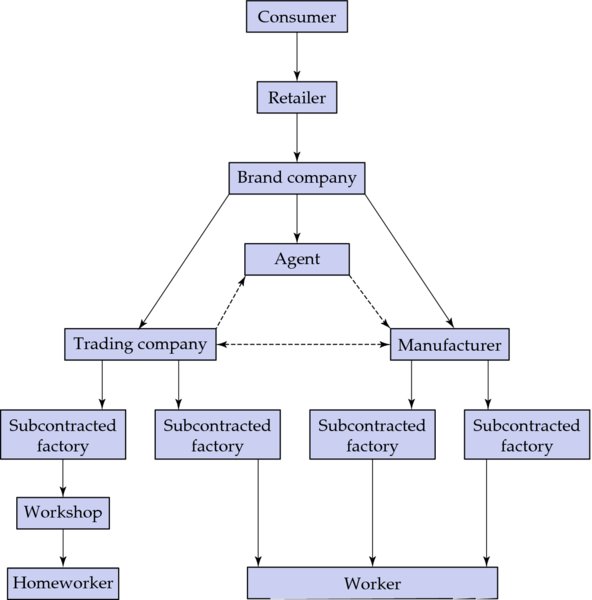
Figure 3.9 The sports apparel supply chain
The targeted sportswear consumer, particularly the teenage and young adult segment, is fashion sensitive and relatively price insensitive. Wearing what is “in” is more important than wearing what you have until it is worn out. High-profile sports teams are aware of this dynamic and regularly change the design of their (branded) playing shirts (their “strip”) to profit from loyal fans who “must have” the latest shirt with the name and number of their favourite player added at extra cost. Sporting teams, however, pale into retailing insignificance compared with giant consumer distributors like US-based Wal-Mart or France’s Carrefour. While 80% of athletic footwear sales and 75% of sportswear are sold under brands, retailers understand that even fashion conscious, price-insensitive customers will, if given the choice, pay the lower of two prices for their chosen branded item. So being able to offer that lower price is a key competitive weapon. As they thrust and parry with price reductions the retailers constantly put pressure on their suppliers for compensating cost reductions to ensure that retail margins are maintained.
While retailers set the consumer price, the brand company infuses the product with its “value”. Creating image-based value means that marketing is the major cost as both saturation media coverage and celebrity endorsements are expensive. In making over $1bn profit in 2004, Nike expensed nearly as much on marketing. Yet, while nothing is spared on value-creation in design and marketing, things are entirely different at the production end. Here the watchwords are “efficiency” and “cost reduction”. These watchwords are passwords for the agents, trading companies and manufacturers seeking access to “manufacture and supply” orders.
Some of these intermediaries themselves are large multinationals but, like the myriad of smaller companies and the even smaller subcontractors that supply them, are dependent for their corporate lives on winning the orders of Reebok, Adidas, etc. As well as pressures on product cost, this level of the supply chain must manage complex forecasting, inventory and logistics algorithms as retailers respond to variable consumer demand by giving shorter lead times for more frequent but smaller orders. Hence these suppliers bear most of the risk and costs of inventory management as well as the challenge of continuous cost reduction.
Flexible low-cost manufacture in a labour-intensive product demands flexible, low-cost workers. Hence the supply chain ends in countries like China, Cambodia or Indonesia, the comparative advantage of which lies in an abundant supply of low-cost (i.e. poor) workers. On 1 April 2010, the official minimum wage for full-time workers in Shanghai, one of China’s most dynamic and modern cities, rose by RMB 160 to RMB 1,120 ($164) per month with the wages of hourly paid workers moving from RMB 8 to 9 ($1.31) per hour. On Nike’s official website the price of shoes ranged from a low of $45 for a sandal to $110 for the top of the range, customisable pair of runners.
 Some suggestions
Price is the final manifestation of the ongoing power struggle for value between suppliers and buyers throughout the supply chain. In the “supply chain”, i.e. the horizontal dimension of the Five Forces diagram as it is represented in the text, it is price sensitivity that determines how keenly price gains and reductions will be sought and relative bargaining power that determines which “partner” bears more of the ensuing cost. “Winners and losers” should perhaps more accurately be denoted as “winning and losing” at the downstream (i.e. more toward the consumer) end of this industry because there tends to be an ebb and flow of who is “on top” as the big guys (large manufacturers, brand companies and retailers) arm wrestle each other. But, like all power hierarchies, the less power you have the more dependent you are on the largesse of others and the final upstream “supplier”, i.e. the worker, captures value consistent with his/her low power.14
Consumers – winners
The individual consumer is powerless to change the price of the retailer, no matter how price sensitive he or she might be. Even if many consumers are price sensitive they lack power because they cannot effectively coordinate with other like-minded consumers to act together to threaten to shift their custom if price reductions are not forthcoming. However, transparent pricing (transparent through advertising and word-of-mouth) effectively acts as a coordinating mechanism and forces retailers to deal with consumers as if they were a coordinated group rather than a bunch of separate individuals. While a consumer lacks power, the consumer is powerful in the context of retailer price rivalry. Big retailers know that if one of them decides to price a particular pair of Nike trainers at $42.50 against a prevailing price of $50.00 then the consumer will tend to take this offer and hence it must be matched.
Retailers – winners
The retail industry is increasingly concentrated and hence has enormous power as the major distribution outlet (and point-of-sale promoter) for the brand companies. Given the consumer “traffic” through Wal-Mart in the USA, for example, it would be a brave marketing manager who would risk being de-listed by this giant retailer. The retailer is price sensitive to the extent it cannot pass on price increases to the consumer but the force that most deters retail price increases is rivalry between the retailers themselves. Hence retailers are always seeking “exclusive product” arrangements with major brand suppliers (although such arrangements flirt with illegality in several countries). Despite their power, the retailers cannot push the brand companies too far. They are dependent on the heavily promoted brands to generate traffic through their stores and so it would be an equally brave Wal-Mart buyer that chose to de-list Nike, for example. Nike spends a lot of money creating brand loyalty and these brand-loyal Nike buyers would buy the “swoosh” and perhaps other products at the same time, at a Wal-Mart rival. Not stocking the major brands would result in lower sales for Wal-Mart even if it also hurt the brand.
Brand companies – winners
The reciprocal power relationship between the retailers and the brand companies has been mentioned above. Unlike their retailers these firms do not want to compete with each other on price. They are all in need of high margins (supported by high price) to support the marketing/promotion that goes into creating their value proposition, which in turn drives the high price that consumers are prepared to pay. This is a battle of marketing where barriers to entry (need for a brand and guaranteed distribution) are high and substitutes few. Hence with relatively price-insensitive final consumers and equality of power with retailers there is no need for price wars and the inevitable erosion of profits that results. However, the other side of the margin equation is cost and here the brand companies are ruthless.
Trading companies, manufacturers, agents – win some; lose some
This sector is less concentrated than its buyers, cannot vertically integrate and lacks unique assets or capabilities. Barriers to entry are low in that there are many trading companies/agents with the necessary skills/infrastructure that can enter the industry and develop contacts or already have the necessary connections. Even large manufacturers that supply multiple brands can be by-passed by an agent/trading company willing to coordinate subcontractors. These firms are under constant pressure for cost reduction, quality improvement and increased inventory efficiency with the (implicit) threat from the buyer that “if you can’t do it I’ll find someone who can”. As these intermediaries get bigger they are paradoxically under more pressure, as the loss of a big order can result in ongoing losses and potential bankruptcy. Most are locked in to their customers but the converse does not apply.
Subcontracted companies – win some; lose more
By now you can see the picture. At this level power is limited. These are the last structured parts of the system. The financial penalties imposed for late deliveries or poor quality often end up here, passed down from “above”, as do the consequences of delay and obsolescence should the retailer not want the stock after all. And if these organisations don’t want the business, new entrants from around the globe of underdeveloped countries as well as a myriad of rivals in their own backyard are queuing up to fill the gap. With no power to make a price these companies exert the only power they have to make a profit, on their controllable “costs” – labour.
The workers – losers
These “suppliers” face numerous competitors (replacement workers) in their own neighbourhood and numerous potential entrants in other countries. They tend to have a relatively low skill base, to act as individuals rather than collectively and to have no alternative “customers” to whom they can tender. While the price (wages) might be low and constantly subject to being lowered (through non-payment of holiday pay, increased piece work rates etc.), the options that exist tend to be at the level of “take the ‘price’ reduction (and be hungry) or leave it (and starve)”.
As the title of the case suggests, power is money in the supply chain, and where you find power you find money, and where you find no power …
![]()
3-2 Carrefour: The Price of Entry
As the takeover battle for Safeway PLC, Britain’s third largest supermarket chain, was being waged in 2003, there was widespread speculation that the French superstore giant, Carrefour, might enter the fray. For them the question was whether the UK supermarket industry was sufficiently attractive to enter.
The UK supermarket industry as a whole was worth some £100bn a year. The main activity of these supermarkets was food and drink retail, although most had also added petrol stations to their outlets and had also begun to branch into clothing retail with significant success. The primary activity, however, remained food and drink retail and UK consumers bought 80% of their food, 75% of fresh vegetables and fruit, 65% of fish and meat and 50% of milk from the five largest supermarkets. These supermarkets, in order of market share in 2003, were: Tesco (25.8%), Sainsbury’s (17.4%), Asda (15.9%), Safeway (10.0%) and Wm. Morrison (5.9%). Pre-tax profits for these companies mirrored their size, with Tesco generating £1.4bn, Sainsbury’s £0.57bn, Safeway £0.36bn and Morrisons £0.24bn. Asda’s figures are not known because it had been acquired in 1999 by the world’s largest grocer, Wal-Mart of the USA. Despite this profitability, the overall growth rate for the industry had slowed in recent years to 2.9%, which was equal to the growth of the economy as a whole.
The main suppliers to the industry were farmers and fast-moving consumer goods (FMCG) companies. Located around the world and supplying thousands of products, the number of farmers involved was huge. Colossal improvements in transportation in terms of both lower costs and refrigeration had opened massive sourcing opportunities for the supermarkets. With increasing levels of competition, farmers attempted to work together through cooperatives to improve their negotiating position vis-à-vis the supermarkets. However, unless the product was particularly valued by the supermarkets, these organisations had little effect on the terms of trade achieved by the farmers. The FMCG companies, however, such as Kelloggs and Heinz, operated on much larger scales than the farmers, but still faced a challenge in finding opportunities for large volume sales in the UK. While their brands protected their margins, the supermarkets had been investing in their own brands with mixed results. Some FMCG companies were willing to supply stores’ own brands alongside their own, despite some cannibalisation of their products, whereas others, such as Kelloggs, refused to manufacture anything other than their own branded product. At the time of writing, a very large merger was announced between Procter & Gamble and Gillette – two large FMCG companies.
The main customers of the supermarkets are ordinary people in the UK. Everyone is within around 15 minutes’ driving time from at least one supermarket. Many people use the supermarkets for large volumes of shopping and may go once a week or less frequently, but spend well over £100 each time. Most supermarkets operate a reward scheme so that consumers gain points on their store card relative to the amount spent. This can be redeemed against later in-store or petrol purchases. Most regard the supermarkets as an efficient way to buy a wide range of foods and essential household products. In an increasingly time-poor society, this efficiency is attractive to many shoppers. However, there are also good café facilities for those with more time to spend, such as older people or those with children. The supermarkets have also launched home shopping, where customers set up their order preferences on the internet and are then able to order whatever they want for a specific delivery time. Although it is time consuming to set up the initial order, home shopping is proving increasingly popular. Despite the heavy use of supermarkets, both in-store and home delivery, supermarket shopping is not really much of a topic for conversation among shoppers and it is fairly rare for them to compare these sorts of shopping experiences.
The prime competition for supermarkets is the corner shop, which has fared very badly in recent years. However, trade magazines suggest that the local shop is fighting back by focusing on more specialty products. Delicatessens, wine shops, butchers and cafés are all beginning to flourish again as consumers enjoy taking time choosing among high-quality produce. Another source of competition is from farmers’ markets. Mindful of the huge profit margin that supermarkets are making on products sourced from the UK, English farmers are setting up their own farm shops and also attending farmers’ markets where they can sell fresh produce at prices significantly below those of the supermarket. Interestingly, Sainsbury’s recently announced the opening of its own farmers’ market shop in central London, to much disapproval from consumer groups.
For Carrefour, the UK supermarket industry would be a significantly different environment than in France. There are strict planning regulations for the building of large out-of-town supermarkets, and very few stores of the appropriate size are now allowed anywhere. The best sites are also taken. Carrefour does not have a reputation in the UK and it was mindful that the French are not always well regarded in the UK. Carrefour was also aware of the frustrating tactics that the UK supermarkets used in their attempts to prevent discount operators Aldi, Netto and Lidl from setting up their own operations. Through lobbying Parliament, these low-cost retailers had to operate initially as clubs, requiring a membership fee from new customers. With all of these factors to consider, Carrefour needed to decide whether to try to enter the UK supermarket industry and whether a bid for Safeway was an appropriate step to take.

3-3 Dell: High-Tech Hell

Many of the technology giants of Silicon Valley are under threat. The rise of low-cost computing caught out Sun Systems, HP and IBM. Technology standardisation and overcapacity acted together to drive prices down. The standardisation of information technology, exemplified by the emergence of low-cost computers running the open source Linux operating system on mass-produced hardware, is a problem for big technology companies with huge R&D spend and massively expensive sales forces.
There is also massive change in the software industry, with open source software programs produced by worldwide communities of volunteers bringing low-cost alternatives to branded products. There are also cheaper ways to produce and distribute software, from web-based delivery to techniques for building applications from reusable software “components”.
The choice for the technology giants is whether they should strive to produce high-technology products that command high profit margins or compete on lower priced products from a lower cost base. Initially, the most competitive player in this market was Dell, with sales of $50bn and a growth rate of nearly 20% per year up until 2006. It had little R&D to support, and it sells direct to consumers rather than distributors. Its overheads were less than 10% of sales compared with 18% at HP and 47% at Sun.
What are the giants to do? IBM is seeking an optimal business mix. Seeking to sell its personal computer business to Lenovo of China was a further move in redefining Big Blue, who could see bigger margins in related areas, such as information systems and consultancy services. HP and Sun have abandoned parts of their high-tech business to compete more directly with Dell, but this has put their earnings under pressure and their market share has fallen. Standardisation and commoditisation are leaching profits out of the businesses. The problem of standardisation is that it makes it harder for companies to differentiate their products and demand premium prices. It also makes it easier for customers to shop around and frees them from “lock-in”.
Overcapacity gave customers the power to influence manufacturers into giving them interchangeable products. IBM, HP and Sun responded by offering cheaper and more flexible products. By purchasing Compaq, HP hoped to take the lead in low-cost servers, even though this cannibalised their existing business in corporate computers. Although HP did see its sales rise strongly, its profits and revenue failed to follow. Part of the reason is that HP has been selling this new low-price technology using its traditional expensive sales techniques. Although there were efforts by Ms. Fiorina, HP’s CEO at the time, to adjust salespeople’s compensation, this was widely perceived as too little, too late.
By 2009, this strategic hell had even caught up with former star player Dell. Increased commoditisation and the rise of savvy Eastern players like Lenovo and Acer meant that customers found it hard to differentiate Dell’s products from those offered by Acer, for example. Cloud computing meant that bigger storage drives (one of Dell’s big selling points) became less of a concern, and there was a shift toward notebooks as the primary use of a computer for many was increasingly as a communication device. Furthermore, Dell was struggling to grow in new markets such as India and China, where an unwillingness to purchase online using credit cards and the lack of reliable parcel delivery networks made Dell’s traditional business model difficult to roll out. Founder and former CEO Michael Dell felt compelled to return to the helm of the company, but he and every other commentator agreed that keeping Dell out of the strategic hell that was engulfing the established players in this industry was not going to be easy.

3-4 Ranbaxy: Ranbaxy’s Rise, Big Pharma’s Demise?

This is how it used to work: “Big Pharma” companies came from developed Western countries, with names that people (in the West at least) knew and trusted: GlaxoSmithKlein, Merck, Shering Plough, Pfizer, Novartis, AstraZeneca. They employed the best scientists and patent lawyers. They paid low prices for ingredients from suppliers in developing countries like India. And they dominated the world pharmaceutical markets with their global brands and respected salesforces. These companies controlled the industry terrain. But now they don’t. The rise of Ranbaxy shows how the terrain has changed and gives some clues as to why.
Ranbaxy Laboratories Limited was founded in 1961. It began, like many Indian pharmaceutical companies, as a producer of ingredients. But, unlike most, it saw that the future was about moving up the value chain from supplying to competing with drug manufacturers, and it understood the value of overseas expansion. It started a research programme, directing its scientists to perfect reverse engineering techniques that could drive the production of “generic drugs” (drugs with the same composition as branded drugs that have come off patent). From such moves emerged a strategy that current CEO, 34-year-old Malvinder Mohan Singh, describes as “low-cost, high-tech”.
Ranbaxy established its first overseas subsidiary in Nigeria through a joint venture in 1977 with the express aim of exploiting its “process advantage by supplying cheap drugs to the unmet demand in a developing country” and in 1984 it expanded operations to Malaysia.
Ranbaxy entered the USA in 1995 by acquiring an FDA-approved manufacturer and in 1996 it started a joint venture with another US-based firm. In 1998, Ranbaxy established a 100% subsidiary in the USA and started marketing products under its brand name.
Within just four years of starting its US operations, Ranbaxy had achieved $100m in US sales. The firm also began expanding its production facilities in Europe by setting up a subsidiary in the UK (1994) and establishing a manufacturing plant in Ireland (1995), providing a base for Ranbaxy’s forays into other European markets.
Ranbaxy has since pursued an aggressive acquisition strategy to drive further internationalisation. In 2004, the company acquired the fifth largest generics company in France. In 2006, Ranbaxy acquired two generic companies: Terapia in Romania, where Singh’s winning of the deal surprised many (he under-bid his rivals on price but sealed the deal with his impassioned presentation of the “better fit” between Ranbaxy and the Romania company); and Ethimed in Belgium; before buying the large unbranded generic product portfolio of Allen SPA in Italy.
Ranbaxy’s internationalisation has resulted in a mix of revenues from emerging and developed markets far more balanced than the traditional Big Pharma companies. Which is handy, given that predictions are that pharmaceuticals sales growth will increasingly come from the “Emerging 7” (China, Brazil, India, South Korea, Mexico, Turkey and Russia) and the “Rest of the World” rather than the traditional markets of the USA, the EU and Japan.
For the future, Ranbaxy is gearing up its legal and R&D skills to move further along the value chain. In order to protect its competitive advantage, Ranbaxy is now applying for innovative process patents worldwide. Singh claims that the experience gained here is helping to develop the regulatory skills needed to obtain approval for its products under the “Abbreviated New Drug Applications” (ANDAs) scheme in the USA. And, on the R&D front, Singh is clear that “our bread and butter is going to come from generics. Beyond 2012, I want to see Ranbaxy emerge as a strong hybrid player with substantial revenue flow from proprietary drugs.”
In 40 years Ranbaxy had grown into India’s largest pharmaceutical company. It produces what it calls “a wide range of quality, affordable generic medicines, trusted by healthcare professionals and patients across geographies”. It has a presence in 23 of the top 25 pharmaceutical markets of the world, manufacturing facilities in eight countries and customers in over 125 countries, a 12,000-strong multicultural workforce comprising 50 nationalities, a pool of over 1,200 scientists and has recently signed collaborative research programmes with GSK and Merck. In 2009, the company recorded global sales of $1,519m.
Then came a move that shocked many in the Indian business world. Ranbaxy was sold to traditional Japanese pharma company Daiichi Sankyo in June 2009. To some astonishment Daiichi valued Ranbaxy at 20 times its EBIDTA and four times its total sales and paid $4.6bn for a controlling stake. But the Japanese may still have got good value. It has bought a sound business with potential to grow and good access to growing developing markets, at a time when the Japanese Government is looking to deregulate its own drugs market in an attempt to create competition and cut its own costs. The percentage of generic to branded drugs is about one third of the ratio in the USA and the UK.
Meanwhile, while Ranbaxy was growing in strength and influence, how was the industry environment opening up to provide them with opportunities for expansion?
Nils Pratley, financial correspondent from The Guardian, calls the 1990s the “glory years” for Big Pharma. In the period 1993–2003 the industry averaged a 14% return on investment in the US. During the same period, US Treasury Bonds paid 4.3%, the Hotel industry 5% and the Mining and Oil sectors 9%. How did pharmaceuticals offer such good margins and good returns?
- After so many years in competition together, the Big Pharma companies had carved out their niches and they respected (to some extent at least) each other’s territories. Competitive conduct was fairly “gentlemanly”.
- For many years the buyers of drugs – governments and insurance companies – had respected the authority of the Big Pharma companies. When Big Pharma put prices up, these customers tended to pay up, and to pass the burden on to taxpayers and insurance premiums.
- End users (i.e. patients) had high switching costs if they wanted to find alternatives. Complementary medicines or generics were generally not funded or covered by buyers, nor were they encouraged.
- This reduced the number of viable substitutes that could compete with conventional medicines.
- Patent laws and government regulations (again, partly out of respect to Big Pharma company advocates), and the value that end-users placed on the advice of established medical professionals and the branded drugs they had always prescribed, created very high entry barriers in the way of potential new competitors.
- The basic commodities that went into drugs could be bought quite cheaply from suppliers in developing countries whose own governments were often not well organised economically and desperate for foreign currency. Buyers and end-users paid little attention to the integrity or ethics that might be associated with a pharmaceutical supply chain.
But think about how these things have changed over the past decade.
By 2010, margins were getting tighter and tighter for the traditional Big Pharma companies. The good news was that decades of healthy margins had left most with some cash reserves: but what should they do with that cash to fight back? Some alternatives were already emerging when this case was written:
- Develop further legal expertise to re-establish legal barriers to entry, through tactics such as “patent clusters” (filing lots of new patents closely related to the patents that apply to nearly off-patent drugs, to confuse or intimidate potential copycats) or using out-of-court settlements to delay when generic manufacturers can effectively enter new markets.
- Achieve economies of scale through mergers and acquisitions.
- Partner in, or develop their own, generic manufacturing expertise.
- Reinvigorate their risk-taking in R&D (which their bureaucratic cultures may have stymied in the past).
- Acquire, or partner with, small innovative start-ups as a way of tapping into new potential breakthroughs.

3-5 BMX: From “Joe Kid” to ESPN

Look at any strategy textbook for a view of how an industry should evolve and the most likely image is the smooth incline and fall of the Industry Life Cycle (ILC). It begins with profile growing and revenue and profits coming on stream in the “Introduction” phase, climbing steeply during “Growth”, levelling off during “Maturity” and dropping away in “Decline” (see Figure 3.3). But often real life doesn’t run so smoothly. In reality, the macro-environment and various individual “movers and shakers” can insert speed bumps, dips and unexpected climbs.
For example, sales of condoms dipped to nothing in the 1980s until the AIDs virus changed things, while social changes such as an emphasis on enjoying youthful activities or memories for longer have created what we might call a “nostalgia cycle” – whereby old products make a comeback as retro versions of their former selves: vinyl record albums and the sports shoe and car industries are some of the more visible examples of this. At the same time, key individuals can play a large role in what actually happens to an industry: think of Barack Obama and US auto manufacturers.
While the basic phases of the ILC play a role, the shape of most industries’ evolution may actually appear more like a BMX, or Bicycle Moto-Cross, track. An interesting example of this kind of undulating reality is provided in the recent documentary film Joe Kid on a Stingray, which charts the history of BMX. The film tells the story of the birth and rebirth of that sport and its associated industry.
BMX probably began in 1963, when Schwinn produced a smaller, lighter bike called the Stingray, which enabled young kids to race and do tricks like their motocross heroes. Kids with bikes started to come out of their homes in the burgeoning suburbs of the western United States and look for tracks to race on.
A teenage entrepreneur called Scott Breithaupt started a series of BMX races in Long Beach, California, at around the same time as Palms Park in Santa Monica began to offer races and small amounts of prize money. Breithaupt and others began to form teams and then the teams started to go on the road. In an enthusiastic but ramshackle fashion, these teams headed west in their school summer holidays in old buses, with little money for food, and put on small exhibitions in cities and towns to the east.
Touring teams attracted a lot of interest from curious youths and, in turn, bicycle manufacturers as sponsors. New companies like Mongoose sought to work with the riders to develop stronger, better bikes that, in turn, led to better racing.
After a number of good years and growing professionalism, by the late 1970s interest began to wane. Until one BMX rider with unusually good control of his bike, Scott Haro, started noticing that people wanted to watch the funny little hops, jumps and other tricks that he was perfecting. By 1980, Breithaupt’s brand of BMX had bottomed out, but Haro’s “Freestyle” was on the rise.
One of the most important changes was that Freestyle tapped into changes in the American suburban environment. Freestyle teams toured shopping malls, giving displays in car parks dressed like “new wave” or glam rockers; a far cry from the dirty brushed shirts of the original BMXers on their edge-of-town dirt tracks. This attracted a new range of sponsors ready to endorse Haro and other teams. The new style, and new sponsors, also fuelled further developments in bike technology with new products, such as shock-absorbing springs, foot pegs and lighter frames.
At the time, Breithaupt thought they were a bunch of posers and weirdos, but, in the grand scheme of things and with the benefit of hindsight, he admits that Haro and the Freestyle movement were good for the sport – they gave it a new lease of life.
By 1988, Freestyle was in decline. But it morphed into two further evolved forms: Half-Pipe, which took advantage of the facilities provided by skateboard parks and ramps, and Street, which was about riding and doing tricks in an urban environment. These movements were relatively short-lived, however, and by 1992, sales of BMX-type bikes hit their lowest point since the 1960s. Most said that the sport was dying, if not already dead.
But Mat Hoffman wasn’t going to let it happen. As he says in the film: “Everyone was saying it was dying, that was hard to take, it’s not like they were just saying that your sport was dying, this was and is my life and I was like ‘I’m not dead!’ This is my life and soul, all my love went into this. How can they say that? Even if it killed me I was going to show the world what my sport could be about.”
And it nearly did. Hoffman, seeing the writing on the wall for Half-Pipe, left Team Haro to form his own team and began touring under the label “Bicycle Stunt Series”. He and the community who joined him back on the tour circuit broke many bones pushing the jumps, twists and flips from earlier styles to new extremes (the danger played well with a new group of teenagers and the musical styles of the mid-1990s).
Hoffman is no Obama, but his efforts, and the efforts of those who gathered round him, rejuvenated the industry and led to ESPN looking to promote the sport on television. In 1995, the first ever ESPN-sponsored X-Games was held, and over the next few years the X-Games Tour became established as a multimillion dollar series of worldwide events.
Looking back, the riders from different eras show respect for each other, the industry as a whole and the series of chapters within it that they had shaped. Even the down slopes played a role, explained rider Kenan Harkin: “During the down times … the riders got better, the technology got better, so that when it eventually got put on TV it wasn’t just guys hopping on their tires … there was something great to watch.”
The X-Games are now over a decade old, so what’s next? “Where will it go?” laughs Harkin. “They’ve been asking that since the 70s. The technology gets better, the riders get better, the imagination never stops, so the sky is the limit.”
According to rider Steve Swope, the answer to “What’s next?” is “It’s up to the next generation. It’s up to them to get it done.”
Writing your own “industry forces” case
Refer to the section “Using Strategy Pathfinder for Assessments and Exams” at the end of the book (see p. 385). Under “the Mini Case” and “the Briefing Note”, guidance is given about how you can create your own case. You may already have an interest in a particular industry and its organisations that you would like to understand in more depth – and this is a good vehicle for that purpose. There are also a large number of websites that talk about industries that you might want to find out more about. For instance:
- Websites for national newspapers
- Industry association websites
- Business journals.
![]()

Notes
- 1. We follow Michael Porter (1980) in defining an industry as “the group of firms producing products that are close substitutes for each other” (p. 5). There can be several markets (i.e. groups of customers with similar needs) in an industry and so, for example, the automotive industry has markets for sports cars, sports utility vehicles, saloon cars, trucks and so on.
- 2. ROIC expresses Earnings before Interest and Tax (EBIT) as a percentage of Average Invested Capital (i.e. total capital minus cash and current liabilities). It is a measure of the return on the capital that is invested in the business as a means of creating value (and hence the subtraction of cash assets and current liabilities which are basically interest-free loans from suppliers) and correlates significantly with share price over an extended time. The Weighted Average Cost of Capital (WACC) measures how much the overall investment in the company is costing and so ROIC-WACC gives a measure of how much shareholder value is being created or destroyed over any period.
- 3. Perfectly competitive industries, like “rational” people, are not found in their theoretically pure form in the real world. However, many markets exist where the final outcome of perfect competition, i.e. a lack of discretion in pricing, is evident, e.g. oil, wheat, coffee. A common mistake is the one of confusing commodity products where the market is perfectly competitive, with the commodity producing industry wherein large players with large unused capacity face high exit costs. The theoretical perfectly competitive industry earns normal returns, i.e. returns equal to the cost of capital. Sustained losses in capital-intensive industries such as the airline industry, much of the time, are an indicator of non-perfect competition. Empirical research indicates that if an industry is characterised by any two of (1) over-capacity, (2) many sellers and (3) undifferentiated products then prices tend to be forced down towards marginal cost and returns below the cost of capital. Besanko et al. (2009) make this point in the context of discussions on perfect competition, and the discussion in the chapter borrows heavily from their insights.
- 4. Much of the discussion of the life cycle is standard. Robert Grant in Contemporary Strategic Analysis (2016) offers a detailed treatment.
- 5. Information and communication technology has made imitation faster and more efficient across all domains of human endeavour. Hence comedians find their jokes have a very short life as original material, as they whizz around the internet in nanoseconds and young sports hopefuls can record and imitate the new tricks of the champions in the comfort of their lounge. It is no surprise to the thinking strategist that efficiency/cost focused methodologies such as Business Process Engineering (BPR) and Activity Based Management (ABM) have significant impacts on managers in mature industries. Similarly, it is no surprise that doom-mongering journal articles railing against the perils of such imitation-as-strategy also appear in regular cycles. Unfortunately, impassioned exhortations to “dare to be different!” or “invent the future!” or “innovate or die!” have as much credibility in many mature industries as the directive to “leap to the top of a large building in a single bound” has for most mature adults – no matter how many exclamation marks are used. Make no mistake, one adult may be able to leap to the top but, in the main, those that keep trying to do so lose out to those who use the elevator, just like everyone else. If someone does eventually leap to the top, his/her leaping methodology is quickly (and cheaply) copied and everybody goes a-leaping.
- 6. Kathryn Harrigan (1980 and with Michael Porter in 1983) has written on decline.
- 7. Oligopolies are industry structures where the dynamics of game theory most often emerge and, in particular, that part of game theory that deals with zero sum games or, as they are more popularly known, the Prisoners' Dilemma. For example, although no one company in the industry might want to reduce prices (as buyers demand) or increase industry capacity, the fear that the others will drop prices (and gain the business) or increase capacity (and hence reduce costs) drives all players to reduce prices and/or increase capacity due to the fear of being left out. After the decision, all competitors make less money because of the price reduction or, in the case of the capacity decision, because the industry is now plagued with chronic over-capacity and the associated increase in costs. Dixit et al. (2009) offer a comprehensive treatment of this complex area.
- 8. Traditionally MES has meant Minimum Efficient Scale with the strategic emphasis being on scale-based cost reductions (i.e. increasing supply side returns to scale). We use “size” for two reasons. (1) There are other size-based cost dynamics such as scope and experience effects where the former is a version of scale but the latter is driven by cumulative volume (i.e. past “size”) rather than current production capacity (scale/scope). (2) On the demand side, size is important in those industries that demonstrate network effects, i.e. where the value of the product to the customer is a positive function of the number of other users (increasing demand side returns). Hence in the traditional areas of telephones and in the current industry of web-based auction companies (e.g. eBay) or social networking industries involving such companies as Facebook or Twitter, the value of the product is a positive function of the number of others currently in the “network” and/or the potential customer's expectations of the number of future users. As with many other areas of strategy, the potential for network gains has tended to be spectacularly hyped by some. Liebowitz (2002) counters the more extreme claims.
- 9. Note that size per se does not automatically engender monopoly power; it is the degree of contestability of the market/industry that underpins pricing discretion. If impediments to entry and exit (low exit costs contestability) are low then some “monopolists” are forced to maintain prices at a level that would prevail under competition as the ever-present risk of entry prevents the large firm from engaging in predatory monopoly pricing. This is an argument that some have used in support of Microsoft during that firm's frequent battles with industry regulators in Europe and the US. Microsoft argues (among other things) that the nature of the software industry is such that costs of entry and exit are low (the start-up of now-monsters such as Google supports this view) and innovation such a constant threat to Microsoft's positional power that the firm is forced to continue to innovate and to keep its prices low – neither of which is consistent with monopoly power. Netscape might be forgiven for being somewhat credulous.
- 10. Brandenburger and Nalebuff (1996: 17).
- 11. Ibid.
- 12. Source: adapted from the report “Fair Play at the Olympics” by Oxfam GB, available at www.fairolympics.org. See also www.cleanclothes.org.
- 13. See Nike in Chapter 2 Macro Shocks.
- 14. In the sports apparel and footwear industry the power is concentrated downstream but in others it can be upstream (concentrated) raw material suppliers that have the most power.