
6
Sage (Salvia macrosiphon) Seed Gum
Seyed M.A. Razavi Ali Alghooneh and Fataneh Behrouzian
Food Hydrocolloids Research Center, Department of Food Science and Technology, Ferdowsi University of Mashhad, PO Box 91775‐1163, Mashhad, Iran
6.1 Introduction
Sage (Salvia macrosiphon) is an endemic plant belonging to the genus Salvia (Figure 6.1a). The genus Salvia (Labiatae) contains more than 700 species, of which about 200 are found in Iran and distributed worldwide. S. macrosiphon Boiss is a perennial, herbaceous, strongly aromatic, lemon‐scented, and pale yellowish green plant [1]. There is evidence that plants belonging to this genus are pharmacologically active, and they have been used in traditional medicine as a diuretic agent, tonic, anti‐rheumatoid agent and to relieve chronic pain, antimicrobial agent, carminative agent, and for flavor as spices since antiquity all around the world [2]. Javidnia et al. [3] investigated the composition of the essential oil of S. macrosiphon and characterized 64 components, representing 93.3% of the oil, the main constituents being linalool (26.3%), hexyl hexanoate (9.6%), hexyl isovalerate (9.3%), hexyl‐2‐methyl‐butanoate (8.9%), sclareol (7.2%), and hexyl octanoate (6.1%). The aerial parts of S. macrosiphon contain flavonoids of salvigenin, eupatorin, and 13‐epi‐manoyl oxide [4]. Furthermore, Gohari et al. [5] isolated four flavonoids plus a steroid compound from ethyl acetate and methanol extracts of the aerial parts of this plant.
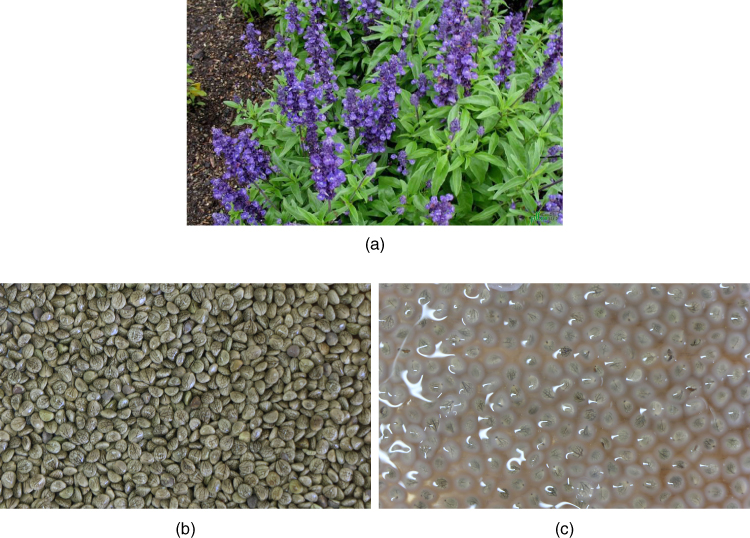
Figure 6.1 A pictorial view of (a) Salvia macrosiphon plant, (b) sage seeds, and (c) the seeds soaked in water.
Some physical and mechanical properties of sage seeds were measured by a computer vision system and/or experimental methods including the projected area, sphericity, roundness, surface area, unit mass, 1000 grain mass, volume, true density, bulk density, porosity, static coefficient of friction, filling and emptying angles of repose, terminal velocity, rupture force, hardness, and absorbed energy [6].
Wild sage seed (S. macrosiphon) readily swells in water to give mucilage [6] (Figure 6.1b,c). The sage seed gum (SSG) conformation was elaborated in aqueous solution [7]. SSG dispersion exhibits a higher extent of departure from the Cox–Merz rule, yield stress values, amplitude dependence of the storage modulus at the start of the nonlinear viscoelastic range ( n‐LVE ), relaxation modulus, relaxation time (obtained from the mechanical spectra), material stiffness parameter [8], zero‐shear viscosity, shear‐thinning behavior [9], time scale of junction zones, and a lower order of relaxation function than guar gum (GG) [8]. In addition, SSG shows higher temperature tolerance of many rheological parameters in amplitude sweep (storage modulus, loss modulus, loss tangent, yield stress at the limit of the LVE range, flow point stress, with the corresponding modulus, slope of the storage modulus and loss tangent at the start of n‐LVE), higher storage modulus, loss modulus, complex modulus, extent of elastic component temperature dependency, the slope of double logarithmic complex viscosity‐ frequency plots at different temperatures of 10–90 °C (1% w/w, f = 1 Hz), complex viscosity (1 Hz, 50 °C) [10], the time dependence of the yield stress at small and large deformations [11], and departure value from the Cox–Merz rule, and lower complex compliance (1 Pa−1, 0.01–10 Hz) than xanthan gum (XG) [12].
Such positive effects make SSG excellent stabilizing, thickening, emulsifying, fat replacing, and binding agents in food, cosmetics, and pharmaceutical systems. Herein, we review the rheological properties of SSG and their relationship with its functional properties.
6.2 Salvia macrosiphon Seed Mucilage
People generally use plant extracts for the treatment of various diseases and for minimizing the effects of the chemotherapeutic agent. Amirghofran et al. [13] investigated S. macrosiphon extract for a possible anti‐cancer effect. The extract showed a strong inhibitory effect on Raji lymphoma tumor cell line (IC50 = 77 ± 1 µg ml−1). The effect of S. macrosiphon aerial part extract on morphine dependence was investigated in mice. The methanolic extract of S. macrosiphon can suppress the morphine withdrawal syndrome [14]. The seeds consist of 9.97%–12% mucilage, depending on their origin and extraction procedure, which comprise uronic acid containing polysaccharides [15,16]. The average molecular weight of associated carbohydrate polymer chains ranges from 4 × 10⁵ to 1.5 × 10⁶ Da [ 7,17].
6.2.1 Mucilage Extraction Optimization
The extraction of galactomannans from seed involves milling, extraction with cold and hot water, and precipitation with an alcohol. By means of the water extraction procedure, the flow behavior index, consistency coefficient, and apparent viscosity (46.16 s−1) under different extraction conditions of temperature, that is (25–80 °C), water‐to‐seed ratio (25:1 to 85:1), and pH (3–9), range from 0.317 to 0.374, 4.455 to 9.435 Pa sn, and 373 to 694 Pa s, respectively. The extraction conditions were optimized by the response surface method (RSM). Optimum conditions for the water extraction procedure of crude hydrocolloid from sage seed, using the quadratic model for maximizing the responses of the yield, apparent viscosity, and emulsion stability index, are a temperature of 25 °C, a water‐to‐seed ratio of 51:1, and a pH of 5.5. At these conditions, the yield, apparent viscosity (122 s−1), and emulsion stability of SSG (1% w/w and 25 °C) are 10.1%, 312 mPa s, and 403 min, respectively. At these ranges of treatments, the highest value of yield is 12.2%, obtained at the highest temperature (80 °C), a water‐to‐seed ratio of 55:1, and a pH of 6.00 [15]. In addition, water extraction following the alcoholic precipitation (ethanol 96%: hydrocolloid of 3:1 % v/v ratio) of SSG at the water‐to‐seed ratio of 30:1 w/v% and different hydration times (15, 30, 60, and 120 min) and temperatures (25 and 65 °C) show the optimum hydration time at 30 min and temperature of 25 °C for the maximum extraction yield of 12% [16]. The kinetics of SSG water extraction is represented by the first‐order mass transfer model. The extraction process is spontaneous, irreversible, and endothermic. The enthalpy change (ΔH), entropy change (ΔS), and Gibbs free energy change (ΔG) values are 0.52–14.99 kJ mol−1, 6.3–52.2 J mol−1 K−1, and 0.14–2.44 kJ mol−1, respectively. A mathematical model of mass transport fits the experimental data. The volumetric mass transfer coefficient values are in the range 4.7–16.9 (h−1) [18]. Investigating the effect of different drying methods in the SSG extraction procedure, that is, oven drying (40–80 °C), freeze drying (−40 °C), and vacuum oven drying (100 mbar, 50 °C) on the color of SSG shows that different drying methods cause various degradation of color parameters. The rise in temperature has a negative effect on the color (high color change) and brightness (low brightness) of gum solution. In comparison with the other drying procedures, the freeze‐drying process results in the best color quality and the highest viscosity for SSG [19].
6.2.2 Physicochemical Properties
The chemical compositions of SSG under optimal extraction conditions were determined by Bostan et al. [15]. In addition, the physicochemical properties of two SSG species (SSG1 and SSG2), were broadly investigated and shown in Table Table 6.1 [7]. Total sugar determined via the DuBois method is in the range 69.96%–71.05%. SSG contains 28.2%–32.2% total uronic acid, reflecting the polyelectrolyte nature of gum. Monosaccharide analysis by high‐performance anion exchange chromatography (HPAEC) demonstrates the presence of mannose (M) and galactose (G) as the main monosaccharide components of both SSG1 and SSG2 (Table Table 6.1), which means galactomannan is the primary polysaccharide in the SSG (M + G > 93%). The M/G ratio of the SSG samples is in the range 1.78–1.93, which is fairly close to that for GG (1.43–2.0) [7].
Table 6.1 Chemical composition of sage seed gum.
Source: Adapted from Razavi et al. [7] with permission from Elsevier.
| Composition (%) b | SSG1 | SSG2 | Minerals | Minerals | SSG1 | SSG2 |
| Moisture | 14.40 ± 0.00 a | 8.08 ± 0.16 | Macro‐elements | Sodium | 0.192 ± 0.032 | 0.122 ± 0.010 |
| Ash | 9.33 ± 0.12 | 9.07 ± 0.63 | Potassium | 2.968 ± 0.095 | 2.699 ± 0.049 | |
| Protein | 2.58 ± 0.01 | 1.59 ± 0.08 | Calcium | 0.962 ± 0.033 | 0.908 ± 0.036 | |
| Carbohydrate | 69.96 ± 0.80 | 71.05 ± 2.52 | Magnesium | 0.873 ± 0.023 | 0.778 ± 0.022 | |
| Phosphorus | 0.030 ± 0.006 | 0.026 ± 0.000 | ||||
| Monosaccharides | Iron | 0.022 ± 0.006 | 0.034 ± 0.000 | |||
| Rhamnose | 1.57 ± 0.64 | 0.77 ± 0.03 | Sulfur | 0.130 ± 0.006 | 0.059 ± 0.000 | |
| Arabinose | 1.48 ± 0.81 | 1.34 ± 0.61 | Micro‐elements | Cadmium | <MDL c | <MDL c |
| Galactose (G) | 33.76 ± 0.32 | 32.55 ± 0.06 | Chromium | 0.0002 ± 0.0000 | 0.0003 ± 0.0000 | |
| Glucose | 3.02 ± 0.33 | 2.55 ± 0.02 | Cobalt | <MDL c | <MDL c | |
| Mannose (M) | 60.19 ± 1.44 | 62.80 ± 0.62 | Lead | 0.0002 ± 0.0000 | 0.0001 ± 0.0000 | |
| Galactomannan (M + G/total) | 93.95 | 95.35 | Manganese | 0.0035 ± 0.0000 | 0.0034 ± 0.0000 | |
| Man./Gal. | 1.78 ± 0.06 | 1.93 ± 0.02 | Molybdenum | <MDL c | <MDL c | |
| Nickel (Ni) | 0.0001 ± 0.0000 | 0.0003 ± 0.0000 | ||||
| Total uronic acids | 32.2 ± 1.6 | 28.2 ± 1.9 | Zinc (Zn) | 0.0082 ± 0.0000 | 0.0024 ± 0.0000 | |
| Copper (Cu) | 0.0022 ± 0.0000 | 0.0014 ± 0.0000 |
a Data are means of duplicate ± standard deviation.
b All measurements are on a dry weight basis except for moisture.
c MDL: Method detection limits.
The O–H stretching vibrations between 3500 and 3000 cm−1 in the FT‐IR spectrum of SSG indicate several features, including free hydroxyl groups' stretching bands, and confirm the presence of carboxyl groups [7]. The values of the hydrodynamic radius (R h ) and the ratio of the radius of gyration to the hydrodynamic radius (R g /R h ) from HPSEC (high‐performance size exclusion chromatography) of SSG samples are in the range 37.63–39.74 nm and 1.34–1.49, respectively, indicating a relative compact conformation for SSG polysaccharides. The α exponent of the Mark–Houwink–Sakurada equation is in the range 0.925 and 0.976, which indicates that SSG1 and SSG2 adopt a rigid rod conformation in aqueous solution. Comparing these results with the α exponent of XG indicates that the macromolecular component in SSG has more chain stiffness compared with that in XG. The low value of the polydispersity index (PDI) indicates the low amount of small molecules in sage seed polysaccharides [7]. SSG is able to reduce the surface tension of water in the concentration range 0.01%–0.25%, but at higher concentrations than 0.25%, SSG enhances this parameter [7]. At 1% w/w concentration, SSG shows the highest emulsion capacity and emulsion stability and the lowest concentration to initiate gelation (1.7%) among Lepidium sativum, Lepidium perfoliatum, and Alyssum homolocarpum gums, which is attributed to its high protein content (2.84%). With the increase of SSG concentration from 0.05% to 0.1%, foaming capacity and foaming stability reduce from 227% to 137% and 36% to 30%, respectively [20].
6.3 Rheological Properties
6.3.1 Dilute Solution Properties
SSG is evaluated for intrinsic viscosity by various models, that is, Huggins, Kraemer, Higiro, and Tanglertpaibul–Rao. Tanglertpaibul–Rao and Higiro equations are the best ones for intrinsic viscosity determination of SSG. The second virial coefficient of SSG in deionized water at 25 °C is on average 7.58 × 10⁻⁴ mol ml g−2, indicating that deionized water is a good solvent for SSG [17].
6.3.1.1 Influence of Salts
The Higiro equation is the best model for intrinsic viscosity determination of SSG in salty solution (sodium and calcium chlorides) at different concentrations (0, 0.5, 20, and 50 mM). An increase in the NaCl and CaCl2 concentrations from 0 to 0.5 mM induce an increase in the intrinsic viscosity, but further salt addition from 0.5 to 50 mM decreases it. The divalent cations have a greater reduction effect on the intrinsic viscosity than the monovalent ones [17]. In a study by Yousefi et al. [21], dilute solution properties of SSG were investigated as a function of salt type (NaCl, KCl, MgCl2, and CaCl2) and salt concentration (10, 50, 100, and 200 mM). There was no significant difference between the intrinsic values obtained in NaCl and KCl as well as in MgCl2 and CaCl2 solutions (p > 0.05), but the difference between each pair consisting of a monovalent and a divalent solution was significant (p < 0.05). Similar to Razavi et al. [17], they reported Higiro to be the best model and confirmed the greater impact of divalent over monovalent cations on the intrinsic viscosity of SSG. For all the used co‐solutes, the shape was found to be roughly ellipsoidal, indicated by the shape factors in the range 2.30–3.52 [21].
6.3.1.2 Influence of Temperature
Razavi et al. [ 12,22] and Yousefi et al. [21] introduced Tanglertpaibul–Rao, Higiro, and Huggins equations as the best models for determination of SSG's intrinsic viscosity at 20–40 °C, 25–65 °C, and 10–90 °C, respectively. With an increase in temperature, the values of the intrinsic viscosity [η] and voluminosity ( ν s ) of SSG decrease, indicating that the coil dimension of SSG and/or the solvent power of deionized water decreases [ 12, 21, 22]. The Huggins constant (k H ) at 10 °C in deionized water is 0.37, which suggests that deionized water is a good solvent at this temperature. However, when the temperature is increased, k H clearly increases, indicating a worsening effect on the solvent quality and/or the occurrence of molecular associations at elevated temperatures. The slopes of master curves (the plot of log (η sp ) against log C[η]) for SSG at 10 to 90 °C are in the range 1.26–1.79. This parameter provides an indication of the conformation of polysaccharides and suggests that as the temperature increases, the molecular conformation of SSG shifts to a more random coil‐like conformation. The chain flexibility parameter (E a /R) value of SSG is 3428 (K), which is higher than the value of 2300 (K) reported for chitosan [22]. The shape function (ν) of SSG at 10–90 °C is lower than 2.5, confirming that the SSG coil has an oblate or prolate shape [ 21, 22].
6.3.2 Viscoelastic Properties
6.3.2.1 Oscillatory Properties
6.3.2.1.1 Amplitude Sweep
The strain sweep test in oscillatory shear mode and in the range 0.01% to 250% at 20 °C, and a constant frequency of 1 Hz represents two different regions as the strain increases: (1) a linear viscoelastic region, where the storage (G′) and loss (G′′) moduli are almost constant, and (2) a nonlinear region, where G′ and G′′ start to decrease [8]. In the LVE region, G′ LVE is greater than G″ LVE . The critical strain (γ c ) and τ f (the stress at the crossover point) of SSG are higher than those for XG [10] and GG (Table Table 6.2) [8]. This result suggests that the time scale of interaction in SSG chains is longer than those in GG and XG. τ y (the nonlinear region immediately begins after this stress) is lower for SSG than for XG. The loss tangent (tan (δ) LVE ) of SSG is <1, and its slope at the start of the n‐LVE range (tan (δ) s(n‐LVE)) for SSG is steeper than for XG. SSG shows a higher amplitude dependence of G′ at the start of the n‐LVE range (G′ s(n‐LVE)) than for the XG and GG dispersions (Table Table 6.2) [10].
Table 6.2 Structural strength (G′ LVE ), loss modulus (G″ LVE ), loss tangent (Tan(δ) LVE ), limiting value of strain (γ c ) in the linear viscoelastic region (LVE), yield stress at the limit of the LVE range ( τ y ), flow point stress ( τ f ), slope of G′ (G′ s(n‐ LVE)), and tan(δ) (tan(δ) s(n‐ LVE)) at the start of the n‐LVE region, for SSG, XG, and GG, as determined by amplitude sweep tests.
| Parameters | SSG a | XG a | GG b |
| G′ LVE (Pa) | 34.64 ± 2.22 | 14.98 ± 2.54 | 8.05 ± 1.05 |
| G″ LVE (Pa) | 5.82 ± 0.26 | 5.40 ± 1.08 | 6.55 ± 0.17 |
| Tan(δ)LVE | 0.17 ± 0.01 | 0.32 ± 0.01 | 0.81 ± 0.05 |
| γ c (%) | 0.04 ± 0.00 | 0.30 ± 0.06 | 35.82 ± 2.77 |
| τ y (Pa) | 1.38 ± 0.21 | 4.58 ± 0.16 | — |
| τ f (Pa) | 8.18 ± 0.80 | 10.23 ± 0.82 | 1509.83 ± 20.18 |
| G′ s(n‐LVE) | 23.98 ± 0.64 | 10.63 ± 2.51 | 0.01 ± 0.00 |
| Tan(δ) s(n‐ LVE) | 0.63 ± 0.07 | 0.58 ± 0.06 | — |
a Source: Adapted from Behrouzian et al. [10] with permission from Wiley (30 °C, f = 0.16 Hz).
b Source: Adapted from Razavi et al. [8] with permission from Elsevier (25 °C, f = 1 Hz).
6.3.2.1.2 Frequency Sweep
Frequency sweep measurements within the LVE range account for a greater G′ value than G″ over the entire frequency range 0.01–10 Hz for SSG, with a lower frequency dependence of G′ than GG at 20 °C [8] and XG at 30 °C [10], indicating the strongest associated network in SSG. SSG does not demonstrate the crossover frequency in the studied frequency range [8]. Rheological data demonstrate the power‐law angular frequency (rad s−1) dependence of the viscoelastic functions (G′ and G″) as follows [ 8, 10]:
where k′ (Pa sn) and k′′ (Pa sn) are the intercepts, n′ and n′′ are the slopes of frequency dependence of G′ and G″, respectively, and ω is the angular frequency (rad s−1).
In the high‐frequency range (1–10 Hz), the frequency dependence of G′ is lower than G″, while at 0.01–0.1 and 0.1–1 Hz, the reverse behavior occurs (n″ < n ′ ) [12], indicating that SSG behaves like true gels, especially at high frequency, when translational movements are more restricted. The n″ of SSG is almost equal to GG and slightly higher than that of XG under the same conditions [ 8, 10]. Furthermore, with increasing frequency, the difference between G′ and G″, the β parameter, increases, and this parameter is higher for SSG than for XG at all frequency ranges (0.01–0.1, 0.1–1, and 1–10 Hz) [12].
The complex viscosity of SSG decreases linearly with increasing frequency on a double logarithmic scale with a slope of −0.84 [8]. tan (δ) for SSG is <1, confirming solid‐like behavior, and is lower than for XG [12]. For SSG solution, the loss tangent increases with angular frequency, which can be explained by the enhanced contribution of the viscous component at the higher frequency with respect to the elastic one [ 8, 12].
Relaxation time: Razavi et al. [8] found that the Maxwell models (Eqs. (6.3) and (6.4)) with three elements was the most appropriate mechanical model for the relaxation behavior simulation of SSG at 20 °C; while Behrouzian et al. [10] stated that the Maxwell model with two elements could be better in the range 10–90 °C.

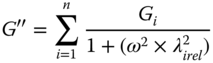
where the subscripts refer to different mechanical elements in the system.
The values of the relaxation moduli (G i ) and relaxation times (λ i ) are higher for SSG than for GG at 20 °C [8] and for XG at 30 °C [10]. The higher λ i of SSG reflects the fact that the mean lifetime of the SSG junction zones is higher than those formed by GG and XG entanglements, which could be associated with the formation of intermolecular aggregates, facilitated by the rigid conformation of SSG [ 8, 10].
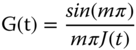
Stiffness parameter: Using the Friedrich and Heymann [23] equations with some simplifications, G * (Pa) is defined as follows:
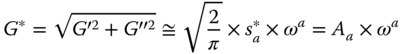
where A a is the material stiffness (Pa rad−α sα), and α is the order of the relaxation function, respectively. The magnitude of A a for SSG is higher than that for GG [8] and XG [12]. The α parameter is able to identify the network extension. The α value is higher for SSG than for GG [8] and XG [12], which indicates that SSG exhibits the highest shear‐thinning behavior.
6.3.2.1.3 Influence of Concentration
The SSG solution exhibits higher dependence on the stress amplitude at lower concentrations (concentration range from 0.5% to 2% (w/w), shear stress range from 0.01 to 150 Pa, 1 Hz and 20 °C), and therefore lower stress values must be achieved to ensure linear viscoelastic properties. The frequency sweep test results (20 °C, strain amplitude of 1.0%) show typical weak gel behavior at 0.5%–2% concentrations. Both G′ and G″ increase dramatically with increasing the SSG concentration, reflecting the stronger gel structure at higher concentration. The concentration dependence of G′ and G″ can be represented by the following power‐law relationships [24]:
The power‐law exponent values of approximately 2 are in good agreement with that reported for the one‐component thermoreversible gel [25]. The loss tangent is not affected by an increase in gum concentration, whereas the complex viscosity increases [24].
6.3.2.1.4 Influence of Temperature
6.3.2.1.4.1 Isothermal Kinetics Properties
As the temperature increases from 10 to 90 °C, G′ LVE and G″ LVE of SSG increase; on the other hand, these parameters reduce for XG [10]. So, it can be concluded that heating strengthens the structure of SSG, whereas it weakens the structure of XG. The temperature dependences of G′ LVE and G″ LVE for SSG (73.17 and 27.03 kJ mol−1, respectively) and XG (243.62 and 167.80 kJ mol−1, respectively) show the lower temperature sensitivity of these parameters for SSG [10]. At a low temperature, XG exhibits stronger gel strength at the starting point of weakening (higher τ y ) than SSG, whereas at a higher temperature, the trend is reversed. At 10–90 °C, the magnitudes of G′ s(n‐LVE) for XG are less than those of SSG, and they decrease with temperature increase for SSG, which reveals that SSG has a more fragile structure than XG and shows a faster breakdown of the structure and/or agglomerates with strain at the start of the n‐LVE region. XG shows a higher temperature sensitivity for G′ s(n‐LVE) (E a = 328.18 kJ mol−1) than for SSG (E a = 86.56 kJ mol−1) [10]. τ f (considered to be a good indicator of the yield stress) for SSG decreases as the temperature increases up to 70 °C, but afterward sharply increases to the highest value of 16.93 Pa at 90 °C, showing less tendency to flow at 90 °C. As the temperature increases from 10 to 90 °C, the values of γ c , the complex modulus (G * LVE ), stress that causes the limiting strain (τ L ), fracture stress (τ Fr ), fracture strain (γ Fr ), reversible extensibility ahead of crack (γ Fr − γ L ), and G f (G′ value at flow point (G′ = G″)) increase with temperature from 10 to 90 °C, whereas tan (δ) LVE decreases [22]. The comparison of τ F and τ Fr with τ L results shows that microscopic rupture produces more temperature dependence than macroscopic fracture in SSG dispersions [22].
The magnitude of the slopes (n′ and n″), intercepts (k′ and k″), and R 2 (determination coefficient) of the power law's storage and loss moduli (Eqs. (6.1) and (6.2)) at various temperatures, from a double logarithmic plot of G′ and G″ versus ω, were determined. In the frequency range 0.01–10 Hz, this gum displays the slopes n′ = 0.09–0.29 and n″ = 0.12–0.37 at 10–50 °C [26]. With an increase in temperature up to 50 °C, n′ decreases and afterward (up to 90 °C) slightly increases [10]. The highest and lowest n″ values for SSG are found at 10 and 90 °C, respectively. The magnitude of k′ is much higher than k″ at any temperature (10–90 °C) [ 10, 26], confirming the gel‐like behavior of SSG, while tan δ is within the range 0.11–0.51 [10]. The G′ value (at 1 Hz), the subtraction average of G′ from G″, the Δ parameter, and the slope of the complex viscosity (η * s ) versus frequency increase with increasing temperature for SSG dispersions. The highest η * s value of −0.85 at 90 °C indicates stronger shear‐thinning behavior at higher temperatures [ 10, 22, 26]. For any frequency measured (0.0628, 0.628, 6.28, and 62.8 rad s−1), E a (η *) > E a (η′), which shows the elastic component has a lower temperature tolerance than the viscous component. Also, with increasing frequency, both the activation energies of η * and η′ decrease [10].
The possibility of crossover points (f *) outside the experimental frequency range (0.01–10 Hz) was investigated in the range 10–90 °C using the asymptote of two lines from the end of G′ and G″ versus the frequency curves, in which these lines intersected only at 10 and 50 °C at 34.44 and 75.25 Hz, respectively [22]. The Cole–Davidson model is another method to extract a value for f *. As the temperature increases from 10 to 90 °C, the f * with this approach decreases. These results indicate that at high temperature, the SSG chains with higher average molecular weight dissolve in the dispersion. With an increase in temperature, the storage modulus at the crossover point (G c ) decreases, which indicates that the molar mass distribution increases [11].
The relaxation modulus (G i ) and relaxation time (λ i ) of SSG increase as the temperature increases from 10 to 90 °C [10]. On the other hand, Razavi et al. [11] reported that SSG shows the same relaxation time trend with the temperature at short and long time scales, and λ i decreases with temperature (10–90 °C) [11]. With an increase in temperature, the magnitudes of A a increase, indicating an increase in the molecular binding with temperature; on the other hand, α decreases [22].
The effects of three different temperature sweep modes (TSs) on 1% SSG dispersion rheological behavior were elaborated, including temperature gradient sweep (TGS, Figure 6.2a), temperature profile sweep (TPS, Figure 6.2b), and temperature table sweep (TTS, Figure 6.2c) in the range 10–90 °C (0.16 Hz and LVE range 0.01%). In all these TSs, the G * of SSG increases as the temperature increases, especially in the range 70–90 °C, while with an increase in the thermal process rate, the extent of G * increment decreases [ 11, 22]. Likewise, during the cooling stage, G * increases with a decrease in temperature in three different TSs. The percentage changes in the complex modulus per degree Celsius obtained from TTS, at both heating and cooling stages, are far less than twice the other TSs, indicating the lower capacity of TTS to change the G * of SSG due to its higher heating rate [11]. During both thermal stages, E a decreases as the TS rate increases. Besides, the E a of SSG during cooling is enormously higher than that at the heating stage at the same TS rate [22]. The extent of the temperature dependences at the heating stage (G *(90 °C)/G *(10 °C)) of GTS and PTS are 3.85 and 5.18, respectively, while during cooling, this parameter has values of 4.49 and 3.85, respectively. The thermal hysteresis percentages from GTS and PTS are 82.42 and 86.64, respectively [11]. The temperature at which G * changes dramatically (T C ) shows a good correlation with the midpoint glass‐transition temperature. The T C of SSG is higher than that of XG at both heating and cooling stages. Using TGS for SSG, T C values at heating and cooling stages are 67.10 °C and 84.23 °C, respectively [11]. At each holding stage in TPS, there is a time in which G * changes dramatically. With an increase in the TS rate, the time of T C (t(T C )) increases and decreases during holding at 90 and 10 °C, respectively [22].
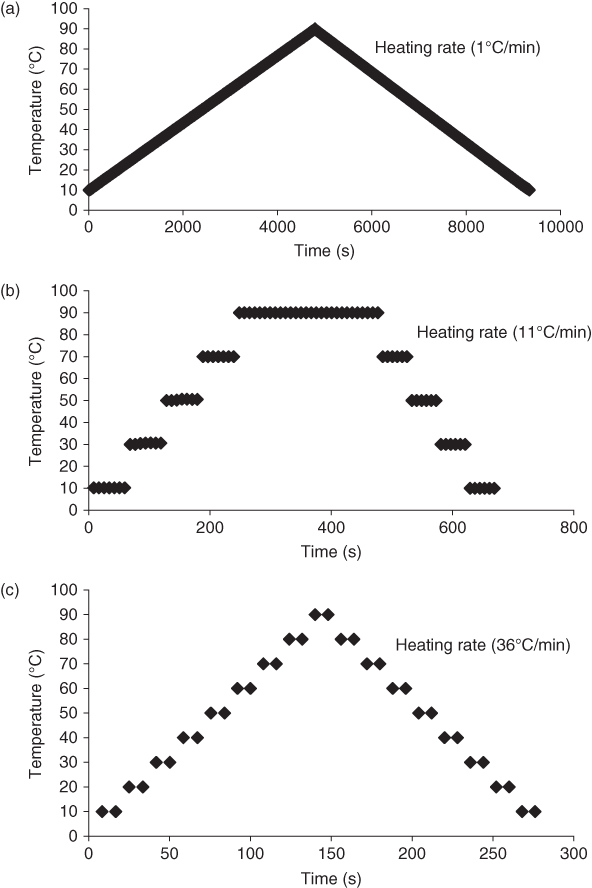
Figure 6.2 Visual representation of three temperature sweeps used in this study: (a) temperature gradient sweep, (b) temperature profile sweep, and (c) temperature table sweep.
Source: Adapted from Razavi et al. [11] with permission from Elsevier.
6.3.2.1.4.2 Non‐Isothermal Kinetics Properties
Non‐isothermal kinetic analysis based on the complex modulus (G*) from dynamic temperature sweep (DTS) data was characterized as follows:
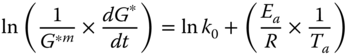
where m is the reaction rate order, t (s) is time, k 0 is the Arrhenius pre‐exponential or frequency factor, E a is the activation energy (kJ mol−1), R is the universal gas constant (kJ mol−1 K−1), and T a is the absolute temperature (K).
At heating stages of all TSs and during cooling stages in TGS and TPS, E a values of SSG are higher than for XG. As SSG is more structured than XG, it is more sensitive to temperature [11]. The m parameter of SSG is 2 in TGS and TPS and 1 in TTS at both heating and cooling stages. This parameter indicates the dependence between the rate of structure development or degradation and structure in the material [11]. The m value in TGS decreases as the TS rates increase, which indicates the lower capability of TGS mode at high TS rate in the conformational transformation of SSG [22].
The time–temperature superposition principle (TTSp) was tested for G′ and G″ in the oscillatory frequency sweep test (0.0628–62.8 rad s−1) in the temperature range 10–90 °C (reference temperature 50 °C). Results show that the TTSp could not be applied for superposition of G′ and G″ (ω) for XG, while it was applied successfully for SSG dynamic shear test data. Good superposition of TTSp suggests that SSG is thermorheologically simple [11]. The relaxation time (a
T
) value of SSG almost decreases with increase in temperature from 5.82 at 10 °C to 0.15 at 90 °C [ 11, 22]. The Arrhenius equation better describes the temperature dependence of the shift factors than Williams, Landel, and Ferry (WLF) with an E
a
of 102.029 (kJ mol−1). TTSp helps obtain rheological information on SSG for a wider frequency range of 0.0002–356 Hz [11] and shear rate range of (0.0015–1746 s−1) than those were accessible by the normal instrumental methods of measurement at 0.01–10 Hz and 0.01–300 s−1, respectively [11]. Razavi et al. [22] stated that over the frequency range 0.01–10 Hz at temperatures 10–90 °C, TTS could not be applied for superposition of G
*(ω), whereas it was applied successfully for the steady shear flow data (η(![]() )) [22].
)) [22].
6.3.2.2 Creep Properties
6.3.2.2.1 Effect of Concentration
Razavi et al. [24] performed creep and recovery tests at a constant shear stress (1 Pa) and temperature (20 °C). The four‐component Burger model (Eq. (6.9)) and the empirical model (Eq. (6.10)) adequately describe the creep (J C ) and recovery compliance (J R ) data, respectively.

where J 0C is the instantaneous elastic compliance (Pa−1) of the Maxwell spring, J 1C is the elastic compliance (Pa−1) of the Kelvin–Voigt unit, λ ret is the retardation time (s) of the Kelvin–Voigt component, and η 0 is the Newtonian viscosity (Pa s) of the Maxwell dashpot. C is the parameter that defines the recovery speed of the system. J ∞ and J 1R are the recovery compliances of the Maxwell dashpot and Kelvin–Voigt element, respectively. When t → 0, J R is equal to J ∞ + J 1R , which corresponds to the maximum deformation of the dashpots in the Burger model. For t → ∞, J R is equal to J ∞, as it corresponds to the irreversible sliding of the Maxwell dashpot.
Because of solidity, the creep and recovery compliances of SSG decrease with increase in concentration from 0.5% to 2%. At concentrations higher than 1.25%, the SSG gels almost recover to their original state. Small permanent deformation after removal of stress confirms the elastic gel structure. J 0C , J 1C , J 0R , J 1R , and B parameters decrease with concentration, whereas the Newtonian viscosity of the free dashpot (η 0), J ∞ , and C parameters increase considerably. The retardation time (λ ret ) is not affected by concentration, except for a 50% decrease with increasing concentration from 0.5% to 0.75%. These results show greater recovery, elasticity, and speed of recovery of SSG network at higher concentrations [24]. The contribution of the compliances of Eqs. (6.9) and (6.10) at the maximum deformation to which the system is subjected was evaluated [24]. The percentage deformation of each element of the system was calculated as follows:

where J element is the corresponding compliance: J 0C , J 1C , J 0R , J 1R , and J ∞ .
J max decreases greatly with concentration; however, J 0C *, J 1C *, and J 2C * parameters are only slightly affected by the concentration. At any gum concentration (0.5%–2%), J 1C * is greater than J 0C * and J 2C *. The final percentage recovery values (R, %) range from 34.03 for 0.5% SSG to 77.71% for 2% SSG, indicating the viscoelastic behavior of SSG [24].
6.3.2.2.2 Influence of Temperature
The four‐element Burger model (Eq. (6.9)) and the empirical model (Eq. (6.12)) successfully fit the compliance curves for the creep and recovery phases of SSG at various temperatures (10, 30, and 50 °C), respectively (R2 ≥ 0.89 and RMSE ≤0.04).
From 10 to 30 °C and 30 to 50 °C, the J max of SSG decreases more than for XG, by 1.94 and 3.22 percent per degree Celsius (%/°C), respectively, which shows that SSG is more resistant to deformation than XG. The lowest J max value at 50 °C indicates the strengthening effect of temperature on the SSG structure. With an increase in temperature, the J 0C *, J 0R *, C, and %R (final percentage recovery) of SSG increase; however, J 1C , λ ret , J 2 c *, and J ∞ * show the opposite behavior. The J 2C * of SSG is lower than for XG at 10–50 °C. At 50 °C, the SSG sample recovers about 86% of its initial structure within the linear viscoelastic region. This means that approximately 14% of the links irreversibly break during the creep test. η 0 is the greatest temperature‐sensitive rheological parameter of SSG among other creep/recovery parameters.
The creep/recovery results show the decrease in viscoelastic behavior for SSG and XG (less J 1C * and J 1R *), the higher solid‐like behavior of SSG (lower J 0C * and J 0R *), and the higher liquid‐like behavior of XG (higher J 2C * and J ∞ ) with an increase in temperature. Temperature enhances the lifetime of junction zones in SSG dispersions; on the other hand, it results in a less stable structure with lower lifetime of junction zones in XG [26].
6.3.3 Steady Shear Properties
6.3.3.1 Flow Behavior
SSG dispersions (0.1%–2% w/w) exhibit strong shear‐thinning behavior, which is even more pronounced than in commercial hydrocolloids like XG, GG, and locust bean gum (LBG), characterized by the flow behavior index value <0.53 [ 7, 16]. The viscosity reduction in the range of 0.01–316 s−1 for GG and SSG are 58.678 and 832.732 times, respectively [8]. The power‐law, Bingham, Herschel–Bulkley, Vocadlo, and Sisko models were used to fit the experimental data, although the Herschel–Bulkley model (H–B) is the best model to describe the steady shear flow behavior of SSG. The Moore model (Eq. (6.13)) satisfactorily describes the high shear‐thinning behavior of SSG1 and SSG2 (0.5–2% w/w) over the shear rates range of 0.01 to 300 s−1 (R2 > 0.86) [ 7, 9, 19].
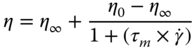
where τ m is the Moore relaxation time (s), η 0 is the limiting zero‐shear viscosity (Pa s), and η ∞ is the limiting infinite shear viscosity (Pa s). The limiting Newtonian viscosity at the low shear rate of SSG from the Moore model (150.51 Pa s) is much higher than that of GG (8.26 Pa s) [8], whereas the reciprocal time constant (1/τ) of SSG (0.071) is lower than that of GG (1.877). These results suggest that the time scale of interaction in SSG chains must be long in comparison with those in GG, which consequently increases the time required for new entanglements to replace those disrupted by an externally imposed deformation. The apparent viscosity of SSG is greater than that of hydrocolloids such as GG, LBG, Tara gum, fenugreek gum, and konjac gum at the same shear rate and concentration, which indicates that SSG is a very good stabilizer in food formulations [7].
6.3.3.1.1 Influence of Concentration
The power‐law, exponential, and polynomial models are successful in describing the concentration dependence (0.5%–2% w/w) of the apparent viscosity (100 s−1); however, the power‐law model, with the lowest mean relative deviation value, is the best model [9]. Increase in SSG concentration leads to a large increase in the yield stress, consistency coefficient, and shear‐thinning characteristics [ 7, 9]. The limiting Newtonian viscosity at zero shear rate (η 0) and infinite shear rate (η ∞ ) of the Moore model increase greatly with the SSG concentration. A large dependence of η 0 and η ∞ on the SSG concentration (0.5%–2%), is shown by the exponents, 2.195 and 1.675, respectively, of the power‐law dependence on concentration, which is expected for entangled solutions in good solvents. The relaxation time of the Moore model increases with SSG concentration with a power‐law trend (i.e., τ m = 12.03C 1.15, R2 = 0.884), indicating an increase in the chains' entanglement density [7].
6.3.3.1.2 Influence of Temperature
There is no definite trend in the flow behavior index and consistency coefficient values as the temperature increases from 20 to 50 °C. As the concentration increases from 0.5 to 2%, at a shear rate of 100 s−1, the activation energy (E a ) from the Arrhenius‐type model increases in the range 3.95–16.38 kJ mol−1 [9].
6.3.3.1.3 Influence of pH
The pH of the solution (3–9) has a significant impact on the rheological properties of SSG, which are described by the power‐law model (0.1%–0.5% w/v and 25 °C). The minimum and maximum consistency coefficients occur at pHs of 3 and 9, respectively, whereas the maximum and minimum values of the flow behavior index occur at pHs 3 and 9, respectively. These effects are attributed to the presence of carboxylic groups on the biopolymer backbone [16].
6.3.3.1.4 Influence of Salts
NaCl (0.5%–3%), CaCl2 (0.5%–3%), and Na2HPO4 (0.2%–0.6%) salts have significant effects on the rheological properties of SSG (0.1%–0.5% and 25 °C). At the same salt concentration of 0.5%, Na2HPO4 shows the greatest and NaCl demonstrates the lowest impact. The consistency coefficient and flow behavior index of SSG dispersions increase with the inclusion of different NaCl, Na2HPO4, and CaCl2 concentrations, while the viscosity levels decrease in the shear rate range 1.92–229.4 s−1 [16].
6.3.4 Thixotropy
6.3.4.1 Hysteresis Loop
Evaluating the time dependency of 1% SSG dispersion in the temperature range 10–90 °C shows that the hysteresis area increases with heating, although it does not show any significant differences between 30, 50, and 70 °C. The magnitudes of the Herschel–Bulkley model parameters (k HB , n HB and τ 0HB ) in forward and backward curves are shown in Table 6.3. The k HB1 and τ 0HB1 parameters are higher, and the n HB1 parameter is lower at the forward stages than those at the backward curves at all temperatures [22].
Table 6.3 The effect of temperature on various thixotropic parameters obtained from three different time dependency measurements, that is, Herschel–Bulkley model parameters ((forward curve (consistency coefficient (k HB1), flow behavior index (n HB1), and yield stress (τ 0HB1)) and backward curve (consistency coefficient (k HB2), flow behavior index (n HB2), and yield stress (τ 0HB2))), the extent of thixotropy (η 0 /η ∞ ), breakdown rate constant (h), breakdown reaction order (g), instantaneous recovered stress ( τ 0 ), stress value at equilibrium plateau ( τ ∞ ), recovery rate parameter (α r ), and the recovery reaction order (p).
Source: Adapted from Razavi et al. [22] with permission from Taylor & Francis.
| Method | T (°C) |
k
HB1
(Pa sn) |
n
HB1
(−) |
τ
0HB1
(Pa) |
RMSE |
k
HB 2
(Pa sn) |
n
HB 2
(−) |
τ
0HB2
(Pa) |
RMSE |
Hysteresis
(%) |
| Hysteresis loop test | 10 | 12.84a ± 0.67 | 10.50d ± 0.02 | 22.84ab ± 0.38 | 0.04 | 12.14a ± 0.17 | 10.52d ± 0.03 | 10.54a ± 0.17 | 0.07 | 2.27a ± 0.24 |
| 30 | 24.08abc ± 0.32 | 10.43c ± 0.03 | 23.33a ± 0.65 | 0.05 | 13.40c ± 0.17 | 10.46b ± 0.02 | 10.63a ± 0.21 | 0.10 | 4.21c ± 0.23 | |
| 50 | 13.76ab ± 0.69 | 10.44c ± 0.03 | 23.13 a ± 0.63 | 0.05 | 12.62b ± 0.15 | 10.48 b ± 0.02 | 10.60 a ± 0.25 | 0.02 | 3.83c ± 0.29 | |
| 70 | 24.25bc ± 0.80 | 10.34b ± 0.03 | 22.88ab ± 0.79 | 0.03 | 12.19a ± 0.14 | 20.47b ± 0.01 | 11.72b ± 0.10 | 0.03 | 4.73c ± 0.85 | |
| 90 | 25.24d ± 0.70 | 10.26 a ± 0.03 | 24.50c ± 0.96 | 0.02 | 12.53ab ± 0.27 | 20.37 a ± 0.01 | 11.95 b ± 0.05 | 0.01 | 8.83d ± 0.39 | |
| η 0 /η ∞ | h | g | RMSE | |||||||
| Single shear stress decay | 10 | 1.30 a ± 0.07 | 0.02 a ± 0.01 | 2.04 a ± 0.07 | 0.01 | — | — | — | — | — |
| 30 | 2.12c ± 0.07 | 0.14 a ± 0.03 | 2.10 a ± 0.01 | 0.05 | — | — | — | — | — | |
| 50 | 1.78 b ± 0.05 | 0.08a ± 0.01 | 2.11 a ± 0.02 | 0.07 | — | — | — | — | — | |
| 70 | 3.08d ± 0.14 | 0.85c ± 0.06 | 2.07 a ± 0.03 | 0.06 | — | — | — | — | — | |
| 90 | 5.18e ± 0.45 | 1.79d ± 0.27 | 2.12 a ± 0.03 | 0.03 | — | — | — | — | — | |
| R r | τ 0 (Pa) | τ ∞ (Pa) | α r | p | RMSE | |||||
| In‐shear structural recovery measurements | 10 | 38.66 a ± 0.83 | 1.23 a ± 0.02 | 2.09 a ± 0.01 | 0.02 a ± 0.00 | 1.17 a ± 0.03 | 0.03 | — | — | — |
| 30 | 41.53 b ± 0.60 | 1.40 b ± 0.01 | 2.31c ± 0.02 | 0.04 b ± 0.00 | 1.20 a ± 0.02 | 0.03 | — | — | — | |
| 50 | 40.51 b ± 0.70 | 1.38 b ± 0.02 | 2.21 b ± 0.02 | 0.03 a ± 0.00 | 1.18 a ± 0.04 | 0.04 | — | — | — | |
| 70 | 48.18c ± 1.42 | 1.46c ± 0.01 | 2.44d ± 0.04 | 0.05c ± 0.00 | 1.46 b ± 0.04 | 0.08 | — | — | — | |
| 90 | 52.49d ± 0.70 | 1.77d ± 0.05 | 2.74e ± 0.01 | 0.08d ± 0.00 | 1.89c ± 0.04 | 0.02 | — | — | — |
a Means followed by the same letters in the same column are not significantly different (P > 0.05).
1–2The means of k HB1 with k HB 2 and n HB1 with n HB2 followed by the same numbers in the same row are not significantly different (P > 0.05).
6.3.4.2 Single Shear Decay
In the Razavi et al. [22] study, a 1% w/w SSG sample was sheared at 50 s−1 (10 to 90 °C) to achieve a steady‐state stress condition; then a structural kinetic model (Eq. (6.14)) was applied to describe the time‐dependent behavior as follows:
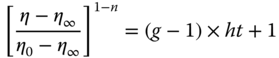
h (the breakdown rate constant) and η 0 /η ∞ (a relative measure of the extent of thixotropy) increase with temperature from 10 to 90 °C. On the other hand, the g value (the breakdown reaction order) does not show any significant differences between SSG samples at different temperatures (Table 6.3) [22]. Razavi et al. [26] converted the experimental creep compliance data to stress relaxation using Eq. (6.16) and then applied the structural kinetic model (Eq. (6.14)) to describe the time‐dependent relaxation modulus of SSG at 10–50 °C.
This model satisfactorily fits the transient relaxation modulus data as indicated by the relatively high coefficient of determination (R2) and low root‐mean‐square error (RMSE) values. The breakdown reaction order and the degrees of thixotropy of SSG at 30 and 50 °C are higher than those of XG (Table 6.3). With the increase in temperature from 10 to 30 °C and from 30 to 50 °C, the breakdown reaction order value of SSG increases by 5.40 and 0.66%/°C, respectively. Furthermore, the temperature sensitivity of this parameter for SSG is higher than for XG. The ratio of the initial to the steady‐state relaxation modulus, which can be considered as a relative measure of the amount of structural breakdown, shows the opposite behavior of the breakdown rate constant with respect to temperature. The initial relaxation modulus of SSG is temperature independent, while the steady‐state relaxation modulus significantly increases with increasing the temperature from 10 to 50 °C, confirming greater elasticity at the higher temperature [26].
6.3.4.3 In‐Shear Structural Recovery
A three‐step in‐shear structural recovery test was performed on 0.5% to 2.0% SSG at 20 °C as follows: (1) a constant shear rate of 1 s−1 for 120 s (with pre‐shear at 1 s−1 for 30 s), (2) a constant shear rate of 300 s−1 for 60 s, and (iii) a constant shear rate of 1 s−1 for 180 s. The concentration has no specific effect on the in‐shear recovery properties of SSG gels. The gel structure greatly recovers after applying the shear. The structural recovery of SSG samples is around 57.63%, indicating rapid rearrangement of the structure after a high‐shear step. Increasing the concentration from 0.5% to 1.0%, 1.5%, and 2.0% results in an increase of the apparent viscosity of step 1 by 162%, 298%, and 639%, respectively, which means that the viscosity reduction caused by thixotropic behavior from steps 1–3 is small [24].
Alghooneh et al. [12] performed an in‐shear structural recovery test on 1% w/w SSG at 30 °C. They reported the extent of recovery (R, %) (the percentage ratio of the average apparent viscosity in step 3 to the average apparent viscosity in step 1) and the parameters of the exponential model (Eq. (6.16)) as follows:
where τ 0(Pa) indicates the instantaneous recovered structure, k 1 (1 s−1) represents the rate of recovery, and τ ∞ (Pa) shows the structural stability of the recovered material. This equation can cope with build‐up in step‐up tests. The recovery parameter (R, %) of SSG (57.26) is lower than that of XG (83.25%) [12]. The value of the instantaneous τ 0, k 1 , and the τ ∞ of SSG are 2.42, 0.07, and 3.72 Pa, respectively [12].
A three‐step shear flow test was performed by Razavi et al. [22]. The recovery parameter (R, %) of 1% SSG increases with increase in temperature, which confirms that the time scale of the microstructure changes with flow increases as the temperature increases. An exponential model with four parameters (Eq. (6.17)) satisfactorily describes the shear stress ( τ ) data of step 3 versus time (t) (RMSE = 0.02–0.08).
where p and α r are the order of the structure recovery reaction and the recovery rate constant, respectively. All the parameters of this model, that is, τ 0, α r, τ ∞ , and p, increase with the increase in temperature (Table 6.3), which shows that as the temperature increases, a structure with higher elastic component and strength and greater thixotropy is produced after restructuring [22].
6.3.4.4 Extent of Time Dependence in Small Deformation
The time effect in small deformation (k′ (Pa sn)) could be obtained by the power‐law model (Eq. (6.1)). The k′ of SSG (47.55–50.49 Pa sn) is clearly higher than that of XG (16.87–17.65 Pa sn). There is an excellent negative correlation between k′ and the recovery parameter from the in‐shear structural recovery test (R 2 = 0.90). These results indicate that, in contrast to the time scale of the change in the microstructure with flow, the time scale of the response of the microstructure to deformation in small amplitude oscillatory shear (SAOS) for SSG is higher than for XG, which confirms the different shear‐thinning behaviors of SSG and XG in SAOS and steady shear tests [12].
In another study by Razavi et al. [11], the Weltman model (Eq. (6.18)) was applied to describe the time‐dependent complex modulus properties of SSG dispersions (1% w/w) during heating and cooling stages at 10, 30, 50, and 70 °C and the holding stage at 90 °C using the TPS test.
where A (Pa) and B (Pa) are the initial complex modulus and the extent of thixotropy, respectively. The Weltman coefficient of thixotropic breakdown (B) of SSG increases as the temperature increases. In addition, during cooling periods, with a decrease in temperature, the time dependence of SSG increases. SSG shows no difference between the activation energy of time dependence (E a B) at heating and cooling stages, indicating the identical sensitivity of the structure to the temperature at these stages [11].
6.3.5 Yield Stress
The estimated yield stresses of 0.5%–2% SSG dispersions obtained by viscoplastic rheological models (Heinz, Casson, Herschel–Bulkley, Bingham, and Heinz–Casson models) are much higher (by at least 307%; the values vary between 0.1 and 15 Pa ) than those obtained by the stress ramp method (the values vary between 0.213 and 0.580 Pa) [9]. The obtained yield stresses with the stress ramp method, extrapolation of the apparent viscosity versus the shear stress curve to the infinite apparent viscosity and those obtained from the intercept of the flow diagram and different rheological models including Heinz, Herschel–Bulkley, Casson, and Heinz–Casson are higher for SSG than for GG (1% w/w, 20 °C) [8] and lower than for XG (1% w/w, 30 °C) [12]. The extent of the difference between the static and dynamic yield stresses correlates with the extent of thixotropy and the %R (recovery parameter) (R2 = 94%–96%) [12]. The crossover point in the amplitude sweep test represents the yield stress for a short time scale and large deformation ( L (τ 0)), while the crossover point in the frequency sweep test shows the yield stress under small deformation at a long time scale. These yield stresses increase with temperature for SSG. The yield stress values in the small deformation test and its activation energy are far less than those obtained from the large deformation test ( L (τ 0)), which confirms that the yield stress is a time‐dependent property [11]. The time dependences of the yield stress for SSG in both long and short time scales are higher than for XG [11]. The static yield stress and dynamic yield stress increase with temperature from 10 to 90 °C. Furthermore, their subtraction value increases as the temperature increases, which suggests that with an increase in temperature, a structure sensitive to shear is enhanced to a greater extent than a structure insensitive to shear in SSG [22].
6.3.6 Steady and Oscillatory Shear Rheological Properties Comparison
There is an excellent linear correlation (p < 0.05) between the relaxation time from mechanical spectra (λ i ) and the relaxation time of the Moore model ( τ m ) in the steady shear test. τ m is 1.7 times the mean λ i , which shows a very close relationship between non‐Newtonian and viscoelastic relaxation times. In addition, there is an excellent correlation (R2 = 0.96) between the limiting Newtonian viscosity at a low shear rate from the Moore model and that of the discrete spectrum obtained from the Maxwell model in the frequency dependence measurement [8].

where η
* and
η
a
represent both viscous and elastic components in the oscillatory and steady shear tests, respectively, while η
′
represents the viscous component in oscillatory shear measurements. η
*
/η
′
, which characterizes the extent of the elastic component that sustained small deformation in SAOS, decreases with increase in frequency for SSG and XG, indicating that at a higher frequency, more reduction in the elastic component occurs in SAOS, which is higher for SSG than for XG at 0.0628–62.8 rad s−1. At low frequency, the
η
a
/
η
′
ratio approaches unity. With increasing ω and ![]() , η
′
(ω) and
, η
′
(ω) and ![]() begin to diverge gradually, which can be attributed to the very different molecular motions involved in the dynamic and steady shear tests at high ω and
begin to diverge gradually, which can be attributed to the very different molecular motions involved in the dynamic and steady shear tests at high ω and ![]() [12]. Both η*/η
′
and
η
a
/
η
′
ratio diminish with the increase in frequency/shear rate at 10 and 50 °C, whereas they increase with frequency/shear rate at 30, 70, and especially 90 °C. These results show that the same type of temperature effect on the molecular motions is involved in the dynamic and steady shear tests. The E
a
for the complex viscosity is much higher than the E
a
of the apparent viscosity [22].
[12]. Both η*/η
′
and
η
a
/
η
′
ratio diminish with the increase in frequency/shear rate at 10 and 50 °C, whereas they increase with frequency/shear rate at 30, 70, and especially 90 °C. These results show that the same type of temperature effect on the molecular motions is involved in the dynamic and steady shear tests. The E
a
for the complex viscosity is much higher than the E
a
of the apparent viscosity [22].
6.3.6.1 Cox–Merz Rule
As is shown in Figure 6.3, SSG does not obey the Cox–Merz rule at the shear rate and frequency ranges 0.01–316 s−1 and 0.01–10 Hz, respectively, whereas it follows the generalized Cox–Merz rule [ 8, 12, 21, 22].
η
* is higher than
η
a
at all rates of deformation, which could be explained by structural decay due to the effect of the exerted deformation applied to the system, which is low in oscillatory shear but is high enough in steady shear to break down intermolecular associations [ 8, 12]. The extent of departure from the Cox–Merz rule is studied by measuring the area between the apparent viscosity (
η
a
)–shear rate (![]() ) and the complex viscosity (
η
*)–angular frequency (ω) curves as follows:
) and the complex viscosity (
η
*)–angular frequency (ω) curves as follows:
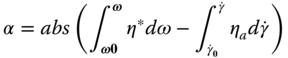
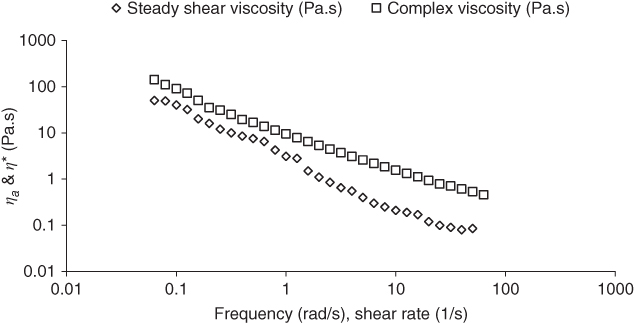
Figure 6.3 Cox–Merz plot of complex viscosity (η*) against steady shear viscosity for sage seed gum (1.0%, 20 °C).
Source: Adapted from Razavi et al. [8] with permission from Elsevier.
The extent of departure (α) from the Cox–Merz rule for SSG is higher than for GG [8] and XG [12]). A higher departure from the Cox–Merz rule shows that the characteristic of a weak gel predominates. In addition, with increase of the temperature from 10 to 90 °C, the extent of departure ( α ) from the Cox–Merz rule increases, except for SSG at 50 °C, which shows an almost similar α value as at 10 °C [22].
6.3.6.2 Shear‐Thinning Phenomena
Shear thinning as an important rheological behavior of biopolymers is broadly different in steady and dynamic shear tests of SSG. The power‐law model adequately fits both the steady shear viscosity versus the shear rate and complex viscosity versus the angular velocity data (R2 = 0.93–0.99) [12]. The magnitudes of the power‐law model parameters for steady shear viscosity (k and n) and oscillatory shear complex viscosity (k * and n *) were compared for 1% SSG at 10–90 °C. SSG is strongly shear thinning (n < 0.50 and n * < 0.26). At any temperature, the power‐law model parameters show greater shear thinning in SAOS than in steady shear tests, which may be attributed to the greater time scale of the segment–segment interaction in SSG which remains in the SAOS test. The highest shear thinning occurs in the range 0.01–0.1 (s−1 or Hz) at steady and dynamic rheological tests. The order of viscosity reduction in the range 0.01–100 s−1 of SSG (2404.25 times) is higher than for XG dispersions (1942.78 times), although in the range 0.01–300 s−1, they are 4808.50 and 7729.79 times for SSG and XG, respectively. The percent proportion of viscosity reduction in the ranges 0.01–0.1 s−1 is higher for SSG (91.37%) than for XG, while in the range 100–300 s−1 XG is predominant (21.27%). The order of the complex viscosity reduction is higher for SSG than for XG, while the proportion of the complex viscosity reduction, at all frequency ranges, is almost the same. Both n and n * decrease with increase in temperature. In addition, E a (n *) is greater than E a (n) [22]. These results confirm the different shear‐thinning behaviors of SSG and XG in the SAOS and steady shear tests.
6.4 Textural Properties
The effect of different drying methods – oven drying (40–80 °C), freeze drying (−40 °C), and vacuum oven drying (100 mbar, 50 °C) – on the textural properties of SSG was investigated via the penetration test. The amounts of hardness, stickiness, consistency, and adhesiveness of SSG gel (3% w/w) change from 45.7 to 78.2 g, 9.8 to 17.0 g, 340.4 to 794.8 g s−1, and 91.4 to 159.2 g s−1 under different drying conditions. The hardness values of oven‐dried SSG gel samples are lower than the freeze and vacuum oven‐dried samples [19]. The hardness of SSG at the minimum gelation concentration (1.7%) is 29.4 N [20].
6.5 Applications
6.5.1 D‐Limonene‐in‐Water Emulsions
The effect of varying concentrations of SSG (0%–0.3% w/v) and whey protein concentrate (WPC, 5%–15% w/v) on the interfacial tension, zeta potential, physical stability, droplet size, flow properties, and viscosity of D‐limonene‐in‐water emulsions at pH 7 was investigated. SSG does not show any significant effect on zeta potential, while the interfacial tension and mean diameter of the droplets decrease with increasing SSG concentration from 0.0% to 0.3%. Storage for a period of four weeks induces an increase in the size of droplets. This is markedly noticeable for the emulsions containing no SSG and negligible for those prepared with 0.3% SSG and 15% WPC. SSG in these emulsions enhances the emulsion stability indices. The emulsions containing only WPC show Newtonian behavior, while those consisting of both protein and gum are shear thinning. Among the various time‐independent rheological models, Herschel–Bulkley is the best model to describe the steady shear flow behavior of these emulsions [27].
6.5.2 Edible Film
The effect of different proportions (20–100% w/w) of plasticizers (glycerol, sorbitol, and PEG‐400) on the physicochemical, mechanical, permeability, surface, and thermal properties of SSG films show that glycerol and sorbitol can effectively plasticize the films of SSG, while glycerol's efficiency is higher than sorbitol's. The films plasticized by glycerol have high moisture content (27%–49%), moisture uptake (110%–140%), and solubility in water (∼80%), but they exhibit low permeability to water vapor, acceptable mechanical properties, surface hydrophilicity, and transparency. On the other hand, the films plasticized by different concentrations of sorbitol exhibit a low moisture content (∼14%), water vapor permeability (lower than 4 × 10–11 g/m s Pa), and moisture uptake (below 90%) with high surface hydrophobicity but less desirable mechanical properties. Samples containing sorbitol are thicker than glycerol‐plasticized films at constant proportions. Contact angle measurements against water show that the water contact angle increases from 32° to 56° and 42° to 103° in glycerol‐ and sorbitol‐plasticized films, respectively. Glycerol's efficiency in plasticizing SSG films is significantly greater than sorbitol's in terms of tensile strength reduction. The film of SSG shows excellent potential for incorporation in food packaging applications [28].
6.5.3 Yogurt
The effect of SSG on the physicochemical and sensorial properties of fat‐free concentrated yogurt was investigated and compared with basil seed gum (BSG) and pectin at concentrations of 0.05%–0.2% w/w. At each concentration, the highest sensory score and viscosity was for SSG samples. The yogurt sample with 0.05% SSG shows the highest mouthfeel score. Among all samples, the highest total solid mass, hardness, and apparent viscosity (51.5 s−1) and the least water released content is for yogurt containing 0.2% SSG. The softness of yogurt increases with increase in SSG concentration from 0.05% to 0.1%. As 0.2% SSG results in a 3.14% increase in total solid content relative to control yogurt samples, it can increase the recovery and reduce the cost of the final product [29].
6.5.4 Sauces
SSG was tested as a stabilizer in mayonnaise formulations in comparison with BSG and GG at 0.3% and 0.5% concentrations. Formulated mayonnaises had high stability (85.64%–99.89%), and none of them showed the creaming phenomenon after storage at 5 °C for 30 days. Formulations with BSG and SSG show the highest odor score. The highest score of texture in sensory analyze is for 100% SSG and 50–50 SSG‐GG, both at 0.5% concentration. With an increase in concentration from 0.3% to 0.5%, the emulsion stability, heat stability, viscosity, and hardness of emulsions containing SSG increase, while the score of color in sensory analysis reduces. Also, the least spreadability among formulations is obtained for 50–50 SSG‐GG samples (0.3% and 0.5%). Formulation with 50–50 SSG‐GG at a concentration of 0.4% is the best one on the basis of stability and sensory properties using RSM. Using a five‐point scale for sensory evaluations, at this formulation, the total scores of acceptance, taste, texture, spreadability, adhesion, viscosity, hardness, odor, color, thermal stability, and emulsion stability are 3.72, 3.63, 3.94, 3.60, 2.88, 3.45, 3.24, 3.68, 4.34, 0.41, and 0.99, respectively [30].
6.6 Summary
A brief description of the rheological properties of SSG is presented in this chapter along with some current applications in food. SSG has the potential to be used in an increasing variety of applications in the food industry. However, for successful food formulation, a complete understanding of the structure–function relationship in SSG is necessary. The long time scale of interaction in SSG chains in comparison with those in GG and XG could be due to the formation of intermolecular aggregates, which is facilitated by the rigid conformation of SSG. Comparison of SSG rheological behavior in dilute and concentrated regimes under thermal treatment show that the reason for the lower intrinsic viscosity and higher limiting Newtonian viscosity at low shear rates with increase in temperature is the reinforcement of entanglement in SSG with heating. The unique structuring and viscosifying capacities of SSG together with good heat stability make it ideal for use as a stabilizer, thickener, and emulsifier or restructuring agents in food, cosmetics, and pharmaceutical systems.
References
- 1 Hedge, I.C. (1986). Labiatae. In: Flora Iranica (ed. K.H. Rechinger), 403–480. Austria: Akademische Druck Verlagsantalt.
- 2 Sajadi, S.E. and Ghannadi, A. (2005). Essential oil of the Persian sage, Salvia rhytidea Benth. Acta Pharmaceutica 55: 321–326.
- 3 Javidnia, K., Miri, R., and Jamalia, A. (2005). Composition of the essential oil of Salvia macrosiphon Boiss. From Iran. Flavour and Fragrance Journal 20: 542–543.
- 4 Matloubi Moghddam, F., Moridi Farimani, M., Taheri, S. et al. (2008). Chemical constituents from Salvia macrosiphon. Chemistry of Natural Compounds 44: 518–519.
- 5 Gohari, A.R., Ebrahimi, H., Saeidnia, S. et al. (2011). Flavones and flavone glycosides from Salvia macrosiphon Boiss. Iranian Journal of Pharmaceutical Research 10 (2): 247–251.
- 6 Razavi, S.M.A., Bostan, A., and Rahbari, R. (2011). Computer image analysis and physico‐ mechanical properties of wild sage seed (Salvia macrosiphon). International Journal of Food Properties 13 (2): 308–316.
- 7 Razavi, S.M.A., Cui, S.W., Guo, Q., and Ding, H. (2014). Some physicochemical properties of sage (Salvia macrosiphon) seed gum. Food Hydrocolloids 35 (3): 453–462.
- 8 Razavi, S.M.A., Alghooneh, A., Behrouzian, F., and Cui, S.W. (2016). Investigation of the interaction between sage seed gum and guar gum: steady and dynamic shear rheology. Food Hydrocolloids 60: 67–76.
- 9 Razavi, S.M.A., Taheri, H., and Quinchia, L.A. (2011). Steady shear flow properties of wild sage (Salvia macrosiphon) seed gum as a function of concentration and temperature. Food Hydrocolloids 25 (3): 451–458.
- 10 Behrouzian, F., Razavi, S.M.A., and Alghooneh, A. (2017). Evaluation of interactions of biopolymers using dynamic rheological measurements: effect of temperature and blend ratios. Journal of Applied Polymer Science 134 (5), 1–13.
- 11 Razavi, S.M.A., Alghooneh, A., and Behrouzian, F. (2018). Thermo‐rheology and thermodynamic analysis of binary biopolymer blend: a case study on sage seed gum‐xanthan gum blends. Food Hydrocolloids 77: 307–321.
- 12 Alghooneh, A., Razavi, S.M.A., and Behrouzian, F. (2017). Rheological characterization of hydrocolloids interaction: a case study on sage seed gum‐xanthan blends. Food Hydrocolloids 66: 206–215.
- 13 Amirghofran, Z., Zand, F., Javidnia, K., and Miri, R. (2010). The cytotoxic activity of various herbals against different tumor cells: an in vitro study. Iranian Red Crescent Medical Journal 12 (3): 260–265.
- 14 Karami, M., Gohari, A.R., Naghshvar, F. et al. (2012). Comparison effects of methanolic extracts of Salvia macrosiphon and Withania coagulans on withdrawal syndrome in mice. Pharmaceutical Sciences 18 (3): 183–186.
- 15 Bostan, A., Razavi, S.M.A., and Farhoosh, R. (2010). Optimization of hydrocolloid extraction from wild sage seeds (Salvia macrosiphon) using response surface methodology. International Journal of Food Properties 13 (6): 1380–1392.
- 16 Farahnaky, A., Shanesazzadeh, E., Mesbahi, G., and Majzoobi, M. (2013). Effect of various salts and pH condition on rheological properties of Salvia macrosiphon hydrocolloid solutions. Journal of Food Engineering 116: 782–788.
- 17 Razavi, S.M.A., Mohammadi Moghaddam, T., Emadzadeh, B., and Salehi, F. (2012). Dilute solution properties of wild sage (Salvia macrosiphon) seed gum. Food Hydrocolloids 29: 205–210.
- 18 Salehi, F. and Kashaninejad, M. (2014). Kinetics and thermodynamics of gum extraction from wild sage seed. International Journal of Food Engineering 10 (4): 625–632.
- 19 Salehi, F. and Kashaninejad, M. (2015). Effect of drying methods on rheological and textural properties, and color changes of wild sage seed gum. Journal of Food Science and Technology 52 (11): 7361–7368.
- 20 Razavi, S.M.A., Bostan, A., Niknia, S., and Razmkhah, S. (2011). Functional properties of hydrocolloid extracted from selected domestic Iranian seeds. Journal of Food Research 21 (3): 379–389.
- 21 Yousefi, A.R., Razavi, S.M.A., and Khodabakhsh Aghdam, S.H. (2014). Influence of temperature, mono‐ and divalent cations on dilute solution properties of sage seed gum. International Journal of Biological Macromolecules 67: 246–253.
- 22 Razavi, S.M.A., Alghooneh, A., and Behrouzian, F. (2018). Influence of temperature on sage seed gum (Salvia macrosiphon) rheology in dilute and concentrated regimes. Journal of Dispersion Science and Technology 39 (7): 982, 995.
- 23 Friedrich, C.H.R. and Heymann, L. (1988). Extension of a model for crosslinking polymer at the gel point. Journal of Rheology 32 (3): 235–241.
- 24 Razavi, S.M.A., Taheri, H., and Sunchez, R. (2013). Viscoelastic characterization of wild sage (Salvia macrosiphon) seed gum as a function of concentration. International Journal of Food Properties 16: 1604–1619.
- 25 Mao, C.F. and Rwei, S.P. (2006). Cascade analysis of mixed gels of xanthan and locust bean gum. Polymer 47: 7980–7987.
- 26 Razavi, S.M.A., Behrouzian, F., and Alghooneh, A. (2017). Temperature dependency of the interaction between sage seed gum and xanthan gum: an interpretation of dynamic and thixotropy rheology based on creep test. Journal of Texture Studies 48 (5): 470–484.
- 27 Mohammadzadeh, H. (2012). Evaluation of the effectiveness of Salvia macrosiphon seed gum for emulsification and microencapsulation of D‐limonen. Master thesis. Ferdowsi University of Mashhad.
- 28 Razavi, S.M.A., Amini, A.M., and Zahedi, Y. (2015). Characterisation of a new biodegradable edible film based on sage seed gum: influence of plasticiser type and concentration. Food Hydrocolloids 43: 290–298.
- 29 Razmkhah, S., Razavi, S.M.A., Behzad, K., and Mazaheri Tehrani, M. (2010). The effect of pectin, sage seed gum and basil seed gum on physicochemical and sensory characteristics of non‐fat concentrated yoghurt. Iranian Food Science & Technology Research Journal 6 (1): 27–36.
- 30 Nik Nia, S., Razavi, S.M.A., Koocheki, A., and Nayeb Zadeh, K. (2010). The influence some food hydrocolloids on the sensory properties and stability of mayonnaise. Electronic Journal of Food Processing and Preservation 2 (2): 61–79.