9
Espina Corona (Gleditsia amorphoides) Seed Gum
María J. Spotti1, Martina Perduca2, Paula Loyeau1, Amelia Rubiolo1,3 and Carlos Carrara1
1 National University of Litoral, Food Technology Institute, Chemical Engineering Department, 1 de Mayo 3250, 3000, Santa Fe, Argentina
2 Universidad de la Cuenca del Plata, Engineering and Technological Faculty, Scientific Research Institute, Lavalle 50, 3400, Corrientes, Argentina
3 Instituto de Desarrollo Tecnológico para la Industria Química, Biotechnology and Food Engineering department, RN 168, Km 0, 3000, Santa Fe, Argentina
9.1 Introduction
Espina Corona gum (ECG) is a galactomannan extracted from the seeds of Espina Corona (Gleditsia amorphoides), a leguminous tree native of Latin America. The area where it grows is in the north and center of Argentina, in the provinces of Salta, Jujuy, Chaco, Corrientes, Entre Ríos, Santa Fe, Misiones, and Formosa. The tree also grows in neighboring countries like Brazil, Paraguay, and Uruguay [1]. The genus is Gleditsia, and the family is Fabaceae (Caesalpinioideae). In Argentina, two species of Gleditsia exist: (1) the Gleditsia amorphoides, which grows spontaneously in the north of Argentina, better known as Espina Corona, which means “thorn crown” in English, and (2) Gleditsia triacanthos, which was imported from the United States, better known as “black acacia.” The Gleditsia amorphoides tree was named after the thorn crown placed on Christ's head, the assumption being that the crown was made with the thorns of this tree. Other common names for this tree are Coronillo, quillai, quillar, caranchí, ivopé, and ivapó, among others. The several uses of the tree include constructions in general: carpentry, braces, floors, rods, walls, roof structures, ornamental sheets, and so on.
It is a meso‐xerophilous tree that is 15 m tall, with a straight trunk and cylindrical base, with branches having ramified thorns 8 cm long with pinnate and bipinnate leaf arrangements. It has leaflets narrowly elliptic to lanceolate or oblong‐lanceolate up to 3 cm long and 1 cm wide, small green flowers gathered in clusters, and indehiscent pod fruits of glossy black color that at maturity are 5–10 cm long by 2–3.5 cm wide. In Figure 9.1, the tree, its trunk, leafs, and fruits are shown [1]. The fruits enclose the seeds from which the gum is extracted, similar to locust bean gum (LBG), which comes from the seed of the European carob tree (Ceratonia silicua).

Figure 9.1 Espina corona gum tree, trunk, leafs, and fruits.
Source: Adapted from the website: http://arbolesdelchaco.blogspot.com.ar/2016/01/espina‐corona‐camba‐nambi‐coronillo.html [1].
Despite the rich flora biodiversity and the favorable climate for their production, galactomannans from Latin American sources are not well known [2]. The degree of purity of commercial ECG is generally not very high, lowering the value of the product and its applications in food formulations. Although there is scientific information about this gum, international publications focused on the study of its rheological properties and its relation with other gums are scarce. The study of these topics could promote and consolidate the technological applications of ECG on the national and international market. In this chapter, the rheological properties of this novel gum as a function of temperature, ionic strength, and pH as well as its interaction with some commercial hydrocolloids have comprehensively been reviewed. In addition, applications of ECG in different food systems like emulsions, foams, and gels have been addressed.
9.2 Purification and Composition
The usual ECG purification process includes its extraction from the seeds' flour using water as a solvent, followed by filtration or centrifugation. In the Argentinian market, the gum is not often commercially available in a purified form and contains significant amounts of insoluble fraction, visible as black spots from the tegument residues that cover the seed's endosperm. These black spots are generated in the roasting procedure used to remove the tegument. This insoluble fraction reduces the product value since it cannot be used in food formulations that need clear or light colors. Different purification procedures in both laboratory and pilot plant scales were studied to determine the soluble and insoluble fractions of ECG [3]. The soluble fraction that was translucent and without tegument residues was subjected to precipitation by alcohols and then drying by an appropriate method like spray drying. Using precipitation by alcohols, it was observed that the greater the volume of alcohol, the higher the percentage of solids of the precipitate, its aspect being white and fibrous. On the other hand, a fraction of purified gum was concentrated by spray‐drying on a pilot plant [3]. As a consequence of the purification, the ECG resulted in an additive that can be applied to any type of food because of its suitable visual characteristics. The color of purified ECG was compared with that of commercial guar gum (GG) and was found to be very similar. Regarding the chemical composition, the ECG extracted from Gleditsia amorphoidesis contains more than 80% of polysaccharides, about 2% of proteins, and low concentrations of lipids and fiber, being similar to the gums extracted from other species. The chemical composition of ECG was postulated by Cerezo in 1965 as a galactomannan composed of 71.4% D‐mannose and 28.6% D‐galactose with a mannose‐to‐galactose (M/G) ratio of 2.5 [4]. The mannose forms a linear chain of (1 → 4) β‐mannopyranose units with one molecule of D‐galactopyranose linked at position 6 every 3 units of mannose (Figure 9.2). This relation is very similar to that of other galactomannans such as GG, with 1 galactose every 2 units of mannose and an M/G ratio of 2.0 [5]. ECG has an approximate molecular weight of 1.39 × 10⁶ Da [6].

Figure 9.2 Espina Corona gum (ECG) structure.
9.3 Flow Behavior
The steady shear rheological properties of hydrocolloids have a significant role in food processing as they govern the product development, process design, and analysis of the present process [7]. The common property of gums is that they impart high viscosity or thickening properties to aqueous solutions or dispersions at very low concentrations. The viscosifying power depends on the type of gum and the level of concentration. The rheology of gums can be correlated with the sensory properties of the solution and, thereby, the acceptability of the products. Since the rheological properties of gums could be a useful tool to formulate specific foods, it is essential to analyze their flow behavior. The rheology of ECG was investigated at different concentrations and temperatures [6]. Also, the flow behavior of ECG solutions upon heating, addition of NaCl, and pH decrease is discussed in the following sections.
9.3.1 Effect of Concentration
The flow curves of ECG solutions as a function of concentration were obtained at 0.25, 0.50, 0.75, 1.00, and 1.50%, w/w, using a rotational rheometer (HAAKE RS80‐Rheo stress, Haake Mess‐Technik GmbH, Germany). As shown in Figure 9.3, all ECG solutions exhibited non‐Newtonian shear‐thinning behavior. The shear‐thinning behavior is generally found in many high‐molecular‐weight polysaccharides [8], and it is due to the fact that when the molecules are at rest, they are arranged in no particular order, which causes a great internal resistance to flow. As the shear rate increases, the molecules orient toward the flow, which decreases the slip resistance and therefore the apparent viscosity.
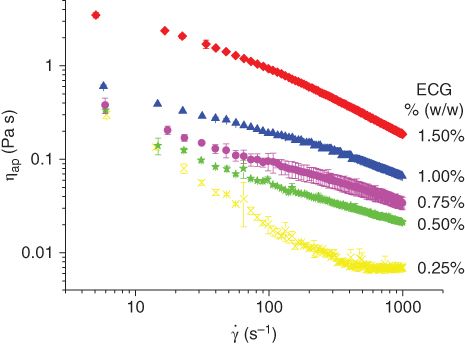
Figure 9.3 Flow behavior of Espina Corona gum ECG solution at 0.25% w/w, 0.50% w/w, 0.75% w/w, 1.00% w/w, and 1.50% w/w.
Source: Adapted from Perduca et al. [6] with permission from Elsevier.
Table 9.1 Power‐law rheological parameters of Espina Corona gum (ECG) in comparison with guar gum (GG).
| Sample | Concentration % (w/w) | Temperature (°C) | Consistency coefficient (Pa.sn) |
Flow behavior index (‐) |
R 2 |
| ECG | 0.25 | 25 | 0.25 ± 0.03 | 0.44 ± 0.02 | 0.897 |
| 0.50 | 25 | 0.41 ± 0.03 | 0.57 ± 0.02 | 0.981 | |
| 0.75 | 25 | 0.65 ± 0.07 | 0.58 ± 0.00 | 0.994 | |
| 1.00 | 10 | 2.75 ± 0.02 | 0.49 ± 0.00 | 0.989 | |
| 25 | 1.57 ± 0.02 | 0.55 ± 0.00 | 0.991 | ||
| 40 | 1.09 ± 0.02 | 0.58 ± 0.01 | 0.995 | ||
| 60 | 0.69 ± 0.00 | 0.61 ± 0.00 | 0.978 | ||
| 1.50 | 25 | 20.72 ± 1.14 | 0.32 ± 0.06 | 0.988 | |
| GG | 0.50 | 25 | 1.83 ± 0.06 | 0.38 ± 0.00 | 0.999 |
| 1.00 | 25 | 50.60 ± 6.22 | 0.14 ± 0.00 | 0.999 |
The values of the flow behavior index (n) and consistency coefficient (k) determined by fitting the power‐law model are shown in Table 9.1. It can be seen that an increase in ECG concentration raises both pseudoplasticity and viscosity, which increases k and decreases n. In addition, by comparing the flow behavior of ECG with GG, it was found that GG has higher consistency coefficient and lower flow behavior index values than ECG at equal concentration and temperature [6]. This would be associated with the higher molecular weight of GG as compared with that of ECG (1.81 × 10⁶ vs. 1.39 × 10⁶ Da, respectively) [6].
9.3.2 Effect of Temperature
The influence of different temperatures (10, 25, 40, and 60 °C) on the apparent viscosity of ECG solution (1.0% w/w) is shown in Figure 9.4A [6]. It can be seen that the apparent viscosity decreases when the temperature is increased from 10 to 60 °C, confirmed by lower k value at a higher temperature (Table 9.1). In general, these galactomannan solutions show a decrease by 50% of the apparent viscosity values when the temperature increases from 25 to 80 °C [9]. In addition, the effect of heating treatment on the ECG stability was studied. In order to perform this treatment, the solutions of ECG were heated in a water bath at different temperatures (60, 75, and 90 °C) for a period of 30 min and then were cooled down until 25 °C. Then, the samples were tested for rheological properties at 25 °C. As observed in Figure 9.4B, the flow curves are the same at different heating temperatures, so the ECG structure was not affected by the thermal treatment. These results suggest that ECG could be used in the food products that require stability upon heating. Other commonly used hydrocolloids such as GG and xanthan gum (XG) also exhibit thermic stability [10].
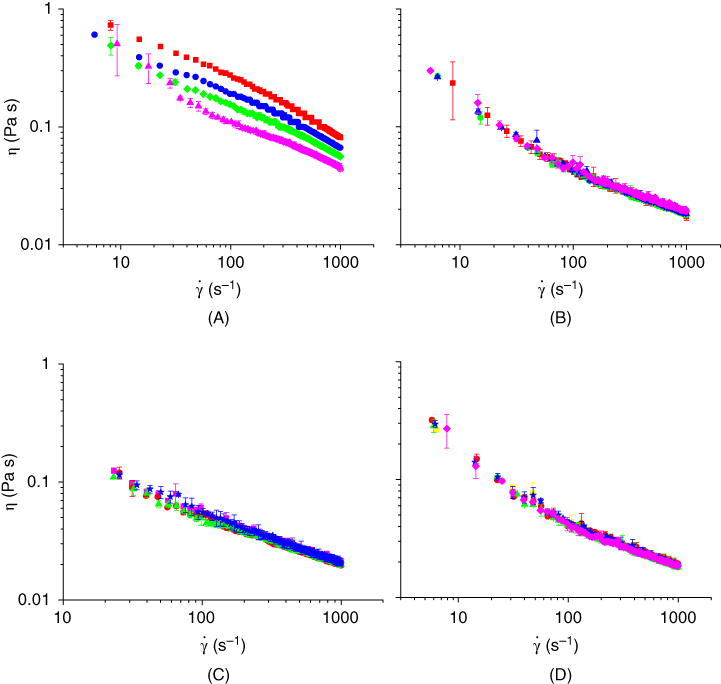
Figure 9.4
A: Flow behavior of Espina Corona gum (ECG) solution (1.00% w/w) at different temperatures: (▪) 10 °C, (•) 25 °C, ( ) 40 °C, and (
 ) 60 °C; B: Apparent viscosity of ECG solutions (0.5% w/w, 25 °C) after heating treatment at different temperatures: (▪) without heating, and after heating at: (
 ) 60 °C, (▴) 75 °C, and (♦) 90 °C. C: Effect of NaCl concentration on apparent viscosity of ECG solution (0.5% w/w, 25 °C): (▪) 0 mM, (
 ) 30 mM, (
 ) 60 mM, and (
 ) 90 mM; and D: Effect of glucono‐δ‐lactone (GDL) addition on apparent viscosity of ECG solution (0.5% w/w, 25 °C) heated at 75 °C for 30 min: (▪) 0% GDL (pH = 6.60), (•) 0.05% GDL (pH = 4.70), (
 ) 0.15% GDL (pH = 4.34), (
 ) 0.30% GDL (pH = 4.03), and (
 ) 0.60% GDL (pH = 3.20). Source: Adapted from Perduca et al [6] and Perduca [3] with permission from Elsevier.
9.3.3 Effect of Ionic Strength
The effect of NaCl addition on the ECG solution viscosity was studied [6]. Charged polymers exhibit higher viscosity than uncharged polymers because the molecular chains can be expanded due to the electrostatic repulsion of intermolecular charges. However, the galactomannan viscosity, like GG or algarroba, is not influenced by electrolytes. Electrolyte addition reduces the dissociation degree of charged groups, which normally leads to chain compaction and a significant drop in viscosity [11]. As shown in Figure 9.4C, the apparent viscosity of ECG (0.5%, 25 °C) was not changed significantly by increasing the concentration of NaCl from 30 to 90 mM, indicating the stability of ECG viscosity in the presence of salts.
9.3.4 Effect of pH
The effect of pH on hydrocolloid viscosity can vary according to the hydrocolloid species. XG maintains its viscosity, and it is stable at low pHs [12]; however, carboxymethylcellulose (CMC) and some galactomannans exhibit a decrease in viscosity with decreasing pH [13]. The effect of lowering pH as well as heating (75 °C, 30 min) on the flow behavior of ECG was investigated [6]. In order to evaluate the effect of varying pH, glucono‐δ‐lactone (GDL) was added to the ECG solutions. GDL is a salt that is hydrolyzed in water, giving δ‐lactone and gluconic acid, which slowly decrease the pH of the solution. The pH of ECG solution (0.5% w/w, 25 °C) before GDL addition was 6.6. The different concentrations of GDL – 0.05%, 0.15%, 0.30%, and 0.60% – led to a final pH of 4.70, 4.34, 4.03, and 3.20, respectively. As shown in Figure 9.4D, the decrease in pH from 6.6 to 3.2 did not alter the apparent viscosity of the ECG solutions, not even after heating. The literature shows that galactomannans can be degraded at very low pH or low pHs along with heating [11]. However, this behavior was not observed for ECG solutions, which maintain the same viscosity after heating at 75 °C for 30 minutes at low pH. These observations are very important for the ECG applications since they reveal that this gum is not affected by salt addition, heating, or acidic pH.
9.3.4.1 Effect of ECG Addition on Viscosity of Yogurts
The effects of ECG along with gelatin (G) on the rheological, physical, and sensory properties of the cholesterol‐reduced probiotic set (firm texture) and stirred yogurts were studied by Pavón et al. [14]. These authors measured the rheological properties of the probiotic yogurts and applied the modified Casson and Herschel–Bulkley models in order to obtain the values of the consistency index (K) and flow behavior index (n). They found that all yogurt samples exhibited non‐Newtonian shear‐thinning behavior (n < 1), indicating the viscosity dependence on shear rate. As expected, the consistency index increases with increasing hydrocolloid dosage, resulting in a firmer coagulum with more consistency and viscosity; meanwhile the flow behavior index decreased. The hysteresis area was larger for those samples manufactured with the addition of both thickeners (G mainly). These differences between the areas were more noticeable after 25 days of storage, probably due to non‐covalent bond formation that promotes thixotropy. ECG and G are hydrophilic hydrocolloids, which significantly increases the system viscosity and improves texture. The authors stated that ECG probably acts as a filler between the network of milk proteins, establishing hydrogen bonds, principally, because it is a neutral polysaccharide [15]. Therefore, yogurt samples with a higher content of both hydrocolloids were more susceptible to structural breakdown due to the application of a shear stress.
Sensory evaluation is also important, since yogurt with a high degree of grittiness and astringency is not accepted by consumers, while a creamy product is related to high‐fat content, dairy flavor, and a viscous, slippery, greasy, and mouth‐coating texture [16]; hence, it is important that the use of hydrocolloids results in desirable changes in terms of texture or mouthfeel [17]. Pavón et al. [14] have seen an increase in scores of texture attributes during storage that might depend on the water‐holding capacity of proteins added to probiotic yogurts (like whey proteins and thickeners agents) as was described by Akalın et al. [18] and Marafon et al. [19]. They also have shown that the acid taste was less detected in those samples with more G and ECG, while the creamy taste was significantly higher in samples with more ECG content. ECG proved to be useful in low‐fat formulations because it can improve the lubricity and flow control, which helps to provide a perception of fat‐like properties (e.g., creamy mouthfeel).
Pavón et al. [14] also studied the effect of ECG and G on the syneresis of yogurts, and they found that ECG and G decreased the syneresis, since these hydrocolloids have high water‐binding capacity and may act synergistically in retaining water in the gel structure [20]. So, the addition of ECG and G achieved greater clot stability, which is a relevant quality parameter because whey separation is an undesirable defect in dairy products. Increased syneresis with storage time is usually associated with casein network rearrangements that promote whey expulsion [21]. In summary, Pavón et al. [14] found that the optimum formulations were 0.49% G–0.41% ECG to obtain set yogurts and 0.01% G–0.43% ECG for stirred yogurts, with desirable sensory, rheological, and stability characteristics.
9.4 Viscoelasticity
The study of viscoelastic behavior is important since almost all foods exhibit some viscous and some elastic behavior simultaneously. Viscoelastic properties can be determined by dynamic methods applying a small sinusoidal strain (or stress) and measuring the resulting stress (or strain). Rheological studies of model systems are usually performed in the small deformation limit, for example, the linear viscoelastic region. There are a number of good practical reasons to do so: such deformations are easier to describe theoretically and therefore more readily interpretable in terms of a model; data are usually quite reproducible; and the method is non‐destructive, which makes it easier to study the time evolution of specific rheological characteristics of a material. However, the small deformation regime is not always the most relevant one. For example, many model studies on food structuring agents are performed in the small deformation regime, whereas the breaking properties of these materials are much more important [22]. Oscillatory tests express the results with two parameters: (1) the storage modulus G′, which represents the solid part of the material, that is, the energy spent in deform an elastic solid that is stored, and (2) the loss moduli G″, which represents the resistant to the flux of the sample, that is, the energy spent in introducing the flow [23]. The commonly used test in oscillatory rheology for characterizing structures is the G′ and G″ dependency with the frequency applied, which is denominated as mechanical spectra.
The viscoelastic behavior of ECG solutions at 0.5% w/v and 1% w/v concentration were evaluated by the frequency seep test at a constant strain amplitude (4%) and temperature (25 °C) [6]. In the dilute solutions, G″ is higher than G′ in a large portion of the frequency range where intermolecular disorder does not take place [11]. As shown in Figure 9.5, at the highest concentration and at low frequencies of oscillation, the viscous modulus was higher than the elastic modulus up to a point where this behavior was reversed (the crossing point) [6]. This is a typical behavior of macromolecules in solution known as a concentrated solution [ 14,24]. It can also be observed that the higher the hydrocolloid concentration, the less the difference in G′ and G″ values. These results were compared with the same concentrations of GG solutions. The mechanical spectra of both gums at 0.5 and 1.0% w/v concentrations are shown in Figure 9.5. In comparison, the crossing point of G′ and G″ occurred at lower frequencies for GG. This may be due to the higher molecular weight of GG, which exhibits a more elastic behavior than ECG [6].
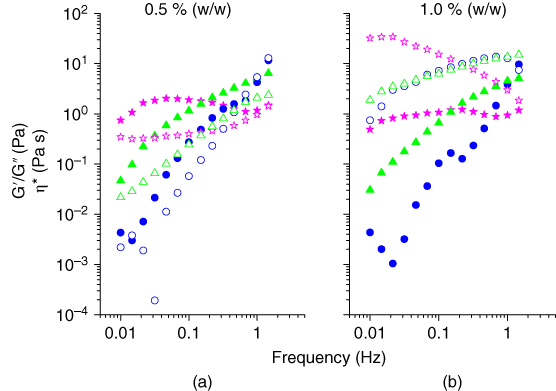
Figure 9.5
Mechanical spectra of Espina Corona gum solutions at (a) 0.5% w/w and (b) 1.0% w/w (γ = 4%, T = 25 °C), G′ ( ) being the elastic modulus, G″ (
 ) the viscous modulus, and η* (
 ) the complex viscosity.
Source: Adapted from Perduca et al. [6] with permission from Elsevier.
9.5 Applications of ECG in Colloidal Systems
Food colloids are multi‐phase systems containing particles or other structures with characteristic spatial dimensions in the colloidal size range [25]. The term colloid can be applied to particulate dispersions, foams, gels, and emulsions (oil‐in‐water, water‐in‐oil, and water‐in‐water systems). Therefore, many foods can be classified as food colloids, and hydrocolloids are added as ingredients in order to control the stability and rheological properties of these systems. In the following sections, the rheological behavior of ECG in different colloidal systems is presented.
9.5.1 Emulsions
Emulsions are dispersed systems which comprise two immiscible liquids [26]. Many natural and processed foods consist either partly or wholly of an emulsion, or have been in an emulsified state during processing, including milk, cream, beverages, dressings, mayonnaise, and so on [26]. These systems are thermodynamically unstable since liquid phases are non‐miscible and the density difference between them leads to fast phase separation if there are no kinetic factors to prevent it; thus, they are formulated with different macromolecules to improve their stability and shelf life. Destabilization is due to the action of forces of various ranges: gravitational force, interparticle repulsive and attractive forces, flow forces, and molecular forces. To a differing degree, these are responsible for the action of destabilization mechanisms. The processes leading to instability are creaming, flocculation, and coalescence, and sometimes emulsion phase inversion and Ostwald ripening [27].
It was observed that ECG alone is not a good emulsifier, probably because it is not an amphiphilic molecule, but it was used as a stabilizing agent in whey protein/sunflower oil systems [3]. The difference between having the emulsifying capacity and being an emulsifying stabilizer is that most of the emulsifiers produce emulsions, whereas the stabilizers help prevent the destabilization process. In order to study the stabilizing capacity of ECG, we have formulated oil‐in‐water emulsions with whey protein isolate as an emulsifying agent and studied the influence of different concentrations of ECG in the prevention of a destabilization process [3]. First, the minimum protein concentration (% w/w) to coat the oil globules without observing free oil after subjecting the emulsions to centrifugation was determined. The emulsions were prepared at whey protein isolate (WPI) concentrations of 1%, 3%, and 5% w/w, with 20% of sunflower oil and produced by blending at 20 000 rpm for 30 s. The minimum concentration of WPI for producing the emulsion was found to be 1%. After that, ECG was added to the emulsion in the following concentrations: 0.5%, 1.0%, and 1.5% w/w, and 30 s additional blending was applied to the systems. Finally, the emulsion rheology and stability were studied [3]. As shown in Figure 9.6, the creaming index significantly decreased with increasing ECG concentration. In addition, the flow curves of ECG emulsions presented shear‐thinning behavior, meaning the apparent viscosity decreased as the shear rate increased. The flow behaviors were modeled with the power‐law model. It was found that the consistency coefficient and flow behavior index increased with increasing concentration of ECG (data not shown).
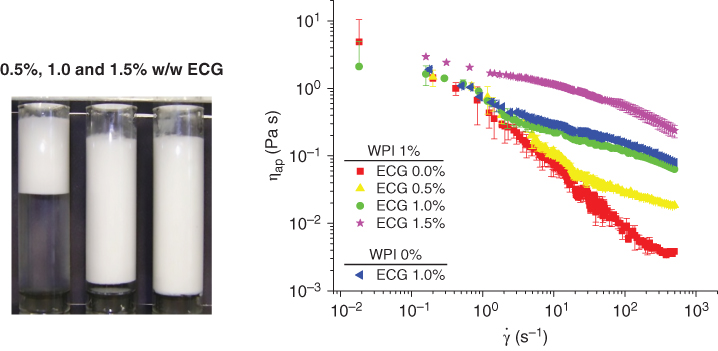
Flow behavior of oil‐in‐water emulsions prepared by whey protein isolate (WPI, 1% w/w) and different concentrations of Espina Corona gum (ECG, 0.0, 0.5, 1.0, and 1.5% w/w).
Source: Adapted from Perduca [3] with permission.
Oscillatory tests of the emulsions were also performed in the linear viscoelastic range, recording the elastic and viscous modulus versus frequency. As observed in Figure 9.7, G″ was greater than G′ in the frequency range studied up to a critical frequency at which the curves showed a crossover [3]. The increment in the hydrocolloid content produced an increase in elastic and viscous moduli, but there was no change in the emulsion structure in the concentration range studied. When the ECG concentration increased from 0.5% to 1.5% w/w, the critical frequency where the curves of the moduli exhibited a crossover increased from 0.15 to 4 Hz.

Figure 9.7 Mechanical spectra of the O/W emulsions prepared by whey protein isolate (WPI, 1% w/w) and different concentrations of Espina Corona gum (ECG, 0.5, 1.0, and 1.5%).
Source: Adapted from Perduca [3]) with permission.
The hydrocolloid addition to oil‐in‐water emulsions improved stability against creaming because the initial velocity of creaming in emulsions stored for 30 days decreased (data not shown). Coalescence phenomena were not observed in dispersed systems stabilized by ECG. ECG also produced a lower tendency to flocculation that could be due to the viscosity increment in the dispersed phase. These results indicated that dispersed systems of oil‐in‐water emulsions with ECG addition are more stable against the destabilization effects, allowing stable emulsions to be obtained.
9.5.2 Foams
Foams are dispersions of gas bubbles in a continuous liquid or semisolid phase [28]. Proteins are one of the main foaming agents used in food products, but they may have certain deficiencies if long‐term foam stability is required. Long‐term stability is much more difficult to achieve for aerated systems as foam than it is for emulsions. Hence, the incorporation of colloidal particles as a possible way of enhancing foam stability is a matter of great technological and commercial significance, because the aerated structure provides the essential textural characteristics of highly popular foods such as ice cream [29]. Therefore, we have studied the foam stability properties of ECG along with whey proteins comparing two methods: bubbling and stirring [3]. The stirring method proved to be better than bubbling, producing more stables foams with smaller bubble sizes. The flow behavior of the foam continuous phase with the addition of different ECG concentrations is shown in Figure 9.8. Higher ECG concentrations (ECG 0.5%–1.0% w/w) show strong pseudoplastic behavior, while lower concentrations exhibit a decrease in the apparent viscosity, indicating that the increment in ECG concentration increased the pseudoplasticity and the viscosity of the foam continuous phase. The power‐law model was applied, and it was found that the consistency coefficient (k), and the flux behavior index (n) increased with increasing ECG concentration (data not shown). Along with these studies, the disproportionation of the air bubbles of all the formulations has been studied [3]. ECG has been shown to be a good stabilizer that prolonged the drainage time, making the drainage slower. This was possible because the ECG increased the viscosity of the continuous phase, retarding the disproportionation of air bubbles.

Figure 9.8 Flow behavior of foams continuous phase of whey protein isolate (WPI, 1% w/w) at different Espina Corona gum (ECG) concentrations.
Source: Adapted from Perduca [3]) with permission.
9.5.3 Gels and Structured Systems
Gelation is a very important functional property of hydrocolloids since gelling agents are extensively used in products like jam, jelly, marmalade, restructured foods, and low‐sugar/low‐calorie gels [30]. When we describe a gel, it is important to note that it is a viscoelastic material, which means that it has the properties of both liquid and solid. These properties can be measured by applying a stress: if a force is applied to an elastic solid, the shape changes, and the deformation is proportional to the applied stress; when that stress is removed, the material returns to the initial shape, and most of the force used for the deformation is recovered. On the contrary, when a force is applied to a liquid, it responds by flowing, and the flow speed is proportional to the applied force. A gel has both properties, so this viscoelastic behavior is the main characteristic of the gel state [ 23,31].
Although galactomannans do not have the ability to form real gels when used singly, they form structured systems or weak gels or can act as a filler in the presence of other gelling biopolymers. The mixture of XG and galactomannan is one of the oldest and most extensively studied synergistic gelling systems [32]. The synergistic interactions can lead to an increase in viscosity and/or gel formation depending on the mannose‐galactose ratio of the galactomannan [33]. The viscoelastic properties of the mixed systems depend on the food system conditions, such as ionic strength, nature of salt added, processing temperature, and so on. The synergistic interactions between different polysaccharides are attractive in the food industry; they can confer different textures and rheological characteristics, and hence, they can reduce costs. In the following section, the interactions of ECG with other biopolymers for obtaining gel systems are reviewed.
9.5.3.1 Interaction between ECG and Xanthan Gum
XG and galactomannans can interact in solution, significantly increasing the viscosity and producing a gel structure [34–36]. XG is an exocellular polysaccharide produced by the bacterium Xanthomonas campestris and is nowadays very widely used in a broad range of products, including foods, pharmaceuticals, cosmetics, personal care, drilling muds, and so on, because of its unique rheological properties [11]. Essentially, XG solutions exhibit a very high viscosity at low shear rates, and a strong pseudoplastic behavior because of the weak intermolecular association of the polysaccharide chains [37]. The XG structure consists of β‐D‐mannose, (1,4)‐β‐D‐glucuronic acid, and (1,2)‐α‐D‐mannose, with side branch chains linked at position 3. The inner mannose may be acetylated, and the terminal mannose may be pyruvated. It has been clearly demonstrated by a range of techniques that the molecules undergo a conformational transition in solution to form a more flexible disordered state, which is favored at high temperature and low ionic strength [11]. These conformational changes are responsible for the interaction with galactomannan molecules, such as LBG and Tara gum, leading to the formation of thermoreversible gels [ 11,38]. These gels are optically clear and highly elastic and have considerable commercial importance.
A common feature of galactomannans with respect to their interaction with XG is that they adopt an extended conformation in solution. Many studies have proposed that the synergic interaction between XG and the galactomannans is based on a cooperative interaction that depends on the structure of the galactomannan [35]. This association is produced between the main and ordered chain of the XG and the unsubstituted regions of the galactomannan, forming junction zones [39,40]. This interaction depends on the galactose/mannose ratio of the galactomannan structure. The galactomannans with fewer lateral branches of galactose and more unsubstituted regions can establish more interactions. The amount of galactose depends on the species from which the galactomannan was extracted. So, LBG, which has a mannose/galactose ratio of 3.5:1, reacts more strongly with XG than GG, which has an M/G ratio of 2:1 [11]. ECG has an M/G ratio of 2.5:1, so the expected behavior is between these two gums. The interaction of XG with ECG also depends on the ratio of the two hydrocolloids in the mixture, pH, and ionic strength. Generally, the synergic interaction with galactomannans is at their maximum with deionized water at neutral pH, and it is reduced at high salt concentration and low pH [11]. The literature suggests that xanthan and galactomannans may interact by two distinct mechanisms. One takes place at room temperature, gives weak elastic gels, and has little dependence upon the galactose content of the galactomannan, while the second requires significant heating of the polysaccharide mixture, gives stronger gels, and is highly dependent upon galactomannan composition [41]. Khouryieh et al. [40] have reported that mixed systems of XG and GG exhibited the maximum synergic interaction when the mixture is heated at 80 °C and is then cooled to 25 °C, because the interaction is improved.
We have studied the interaction between XG and ECG in the following XG:ECG ratios: 100:0, 80:20, 60:40, 40:60, 20:80, and 0:100 [3]. After mixing, the mechanical spectra of the mixtures at 0.25% w/w polysaccharides with the addition of 0.1 M of KCl were evaluated. ECG (XG:ECG 0 : 100) exhibited the typical behavior of a viscous solution, with an elastic modulus G′ lower than the viscous modulus G″, whereas XG (XG:ECG 100:0) exhibited weak gel behavior, with G′ higher than G″ over the entire range frequency (data not shown) [3]. As seen in Figure 9.9, the mechanical spectra of XG:ECG 80:20 and 60:40 are shown with respect to XG alone (black lines). The system XG:ECG 80:20 exhibited higher values of G′ and G″ moduli with respect to XG alone, which indicates that addition of ECG produced an increase in the solid character of the systems. In these conditions, the maximum synergism is produced. A higher XG:ECG ratio (60:40) produced an increase in G′ while G″ did not show significant differences. However, when the ECG concentration in the mixture is higher than 50% of the total concentration of the polysaccharides, a decrease in both moduli G′ and G″ is produced (data not shown) [3].
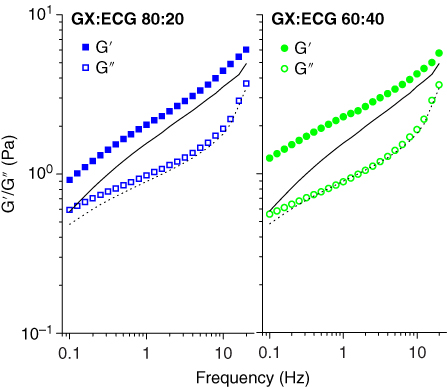
Figure 9.9 Mechanical spectra representative for mixed systems of xanthan: Espina Corona gum (GX/ECG) with a total concentration 0.25% w/w and with the addition of 0.1 M KCl. (Reference: GX:ECG 100:0 (−) G′, (−‐) G″).
Source: Adapted from Perduca [3]) with permission.
We have also compared the XG/ECG systems with XG/GG systems [3]. Some authors described the interaction between XG with GG as compatible [42]. According to several studies, the lower proportion of mannose/galactose in GG (2:1) relative to ECG (2.5:1) should produce a weaker synergism between XG and GG [43,44]. As previously mentioned, the mechanism of intermolecular association between XG and galactomannans is still controversial [40], although it is known that the galactose‐to‐mannose content strongly influences the interaction between galactomannans and XG. In order to study this interaction and compare the results with ECG, systems with different XG:GG ratios were prepared: 100:0, 80:20, 40:60, 60:40, 20:80, and 0:100. According to our results, no synergic interaction was found between XG and GG. Not only the viscous modulus (G″) but also the elastic modulus (G′) decreased with the incorporation of GG into the mixed system [3].
Because XG is an anionic polysaccharide and its conformation changes according to the ionic strength of the media in which is solubilized, we also studied the effect of electrolytes (monovalent (NaCl) and divalent (CaCl2) salts) on the viscoelastic properties of XG/ECG mixed systems [3]. The maximum elastic modulus was obtained for XG:ECG 40:60 ratio in the presence of 0.1 M CaCl2. The addition of NaCl increased the elastic modulus linearly with the increase in the ECG ratio in the system [45]. The interaction of XG/GG systems in different‐ionic‐strength media was also studied. It was found that the addition of NaCl at a concentration higher than 0.001 M or CaCl2 at a concentration higher than 0.0005 M decreased the interaction significantly. Calcium has a deeper impact on decreasing the synergism between these polysaccharides when compared with monovalent ions like sodium. This is possibly due to the electrostatic interaction that occurs between the XG and calcium, resulting in higher molecular contraction, inhibiting the interaction with the galactomannan [46]. Clark [47] found that the decrease in the synergism with the addition of ions is related to the conformational change in the XG molecule from disordered to ordered, induced by the presence of the ions. According to this study, the conformation of the xanthan molecule controls the interaction. The ionic strength favors the ordered conformation of XG, limiting the synergism with galactomannans like ECG at high salt concentrations [45]. However, Goycoolea et al. [48] showed that XG in any conformation can develop synergic properties with galactomannans.
9.5.3.2 Interaction between ECG and Carrageenan
Galactomannans can also interact synergistically with kappa‐carrageenan. Many mixed systems formed by galactomannans and κ‐carrageenan already find extensive applications in the food industry [49]. Carrageenan is the sulfated linear polysaccharides of D‐galactose and 3,6‐anhydro‐D‐galactose extracted from certain red seaweeds of the Rhodophyceae class [50]. They have been extensively used in the food industry as thickening, gelling, and protein‐suspending agents, and more recently by the pharmaceutical industry as an excipient in pills and tablets. The importance of carrageenans in the food industry derives mainly from the ability of kappa‐ and iota‐carrageenan to form elastic gels in the presence of certain cations (K+ and Ca2+ are the usual counterions in kappa‐ and iota‐carrageenan gels, respectively). Despite extensive research, the molecular basis for the conformational transitions in a solution that result in aggregation and gelation is as yet imperfectly understood. Carrageenans are able to form aqueous gels because of the association of the molecular chains into double helices, which then aggregate to form a network capable of immobilizing water [51], so gelation is achieved through junction zones formed by the helices, leading to a three‐dimensional network [52]. In general, the carrageenans produce rigid but fragile gels with syneresis. They slowly release water when stored, and also in the freezing and thawing process. A modification is required in the formulation of these systems in order to improve resilience, cohesiveness, and water retention [53].
Kappa‐carrageenan and some galactomannans, when mixed together, form a network whose strength depends on the preparation temperature and on the weight ratio between the two components [49]. Possibly, kappa‐carrageenan could interact through hydrogen bonding with unbranched smooth segments of the D‐mannose backbone of galactomannan molecules. Due to this interaction, mixed gels can be obtained at lower concentrations in respect of carrageenan alone. In comparison with carrageenan gels at the same concentration, the mixed systems with galactomannans exhibit an increase in gel strength and elasticity, with a reduced tendency to syneresis. In order to study the influence of ECG on the rheological and mechanical properties of carrageenan gels (4% w/w), different concentrations of ECG (0.00%, 0.35%, and 0.70% w/w) and KCl (0.010, 0.105, and 0.200 M) were studied [3]. The uniaxial compression test and texture profile analysis (TPA) were carried out on these samples. Large deformation tests have generally been used for studying the mechanical properties of the hydrocolloid gels. These measurements are characterized by (1) the nonlinear elastic response of the material and (2) the failure of the material at a certain critical strain, the breaking strain. Both phenomena are accessible in a single experiment by plotting the stress–strain curve of the material [22]. This type of study is important since, during manufacturing, food products are subjected to large strains that may cause severe deformation or even final fracture, affecting their structural integrity. Moreover, large deformations and fracture processes are involved in biting and mastication, and therefore, they are linked to consumer acceptance and preference. Determination of mechanical properties is of great importance for food scientists and technologists since the mechanical response affects food processing, handling, and consumption [54]. In a typical uniaxial compression test, some of the calculated parameters are the true or Hencky stress (σ H), and Hencky strain (ε H), which can be defined as
where F(t) and H(t) are the force and the height at a given time t, and A0 and H0 are the initial area and initial height of the gel, respectively [55]. The parameters calculated from the compression data were the maximum stress (σ M), which is the maximum value of σ H until rupture, calculated from Eq. 9.1; maximum strain (ε M), which is the maximum value until rupture, calculated with Eq. 9.2; and Young's modulus (E), which is calculated as the slope of the linear and initial region of the curve σ H versus ε H (5% strain) [56]. In Figure 9.10, the images of carrageenan/ECG gels and the uniaxial compression curves obtained in our study are shown [3]. In general, all the analyzed properties exhibited a maximum value at KCl concentrations of 0.105 mM and increased with increasing ECG concentration. These results indicate that there is an optimum in the KCl concentration, and the addition of ECG reinforces the gel resistance to rupture by increasing the maximum stress. At the same concentration of KCl (0.105 mM), the deformation values and Young's modulus are the same for gels without ECG or with 0.35% and 0.70% w/w ECG addition.
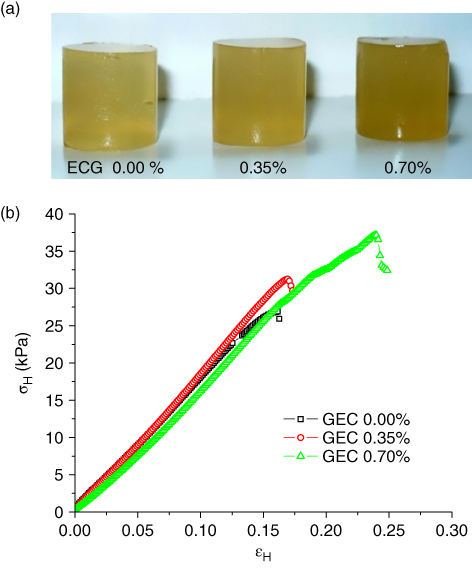
Figure 9.10 Image of carrageenan gels at 4.0 (%w/w) with Espina Corona gum (ECG) addition of 0.35 and 0.70% w/w (a); and (b) uniaxial compression curves of those gels.
Source: Adapted from Perduca [3]) with permission.
TPA was also carried out in the carrageenan/ECG mixed gels. The mechanical properties of solids and viscoelastic materials are described in terms of hardness, strength, deformability, fragility, rigidity, plasticity, elasticity, and ductility, among others. These mechanical and structural properties are related to the food texture that consumers can perceive as physical characteristics specific to each food. These macroscopic properties reflect molecular interactions. Several parameters are calculated from the TPA plot [57]:
- (1) Fracturability (originally called brittleness) is “the force at the first significant break in the curve.” As a break is a visible phenomenon related to the macrostructure of the sample, it must be identified as a change in the inflection of the curve whose magnitude must be defined.
- (2) Hardness is “the peak force during the first compression cycle” (this force is related to the first bite during chewing”).
- (3) Cohesiveness is “the ratio of the positive force area during the second compression portion to that during the first compression (Area 2/Area l), excluding the areas under the decompression portion in each cycle.”
- (4) Adhesiveness is defined as “the negative force area in the first cycle.”
- (5) Springiness (originally called elasticity) is “the height that the food sample recovers during the time that elapses between the end of the first cycle and the start of the second cycle.”
- (6) Gumminess is “the product of hardness and cohesiveness.”
- (7) Chewiness is defined as “the product of gumminess and springiness” (which is equivalent to hardness × cohesiveness × springiness).
These parameters obtained from TPA curves of carrageenan gels at 4% w/w with the addition of different concentrations of KCl and ECG are presented in Table 9.2. At the same concentration of ECG, the hardness is higher for the mixture containing 0.105 mM KCl, and the maximum hardness is exhibited by 0.105 mM KCl and 0.35% (w/w) ECG. Cohesiveness values are low because the gels lost their physical structure with the first compression. Something similar happened with adhesiveness (the gels were not adhesive). The maximum chewiness value is obtained at 0.2 mM KCl and 0.7%w/w ECG [3].
Table 9.2 Parameters of texture profile analysis (TPA) determined for carrageenan/Espina Corona gum (ECG) gels as a function of ECG and KCl concentration.
| ECG (% w/w) | KCl (mM) | Hardness (N) | Adhesiveness (N.s) | Cohesiveness (−) | Gumminess (N) |
| 0.0 | 0.01 | 9.60 ± 1.37 | 0.65 ± 0.45 | 0.12 ± 0.32 | 1.17 ± 0.19 |
| 0.35 | 0.01 | 16.26 ± 1.55 | 0.28 ± 0.22 | 0.06 ± 0.14 | 1.05 ± 0.31 |
| 0.7 | 0.01 | 13.45 ± 4.78 | 2.89 ± 1.81 | 0.08 ± 0.05 | 1.12 ± 0.67 |
| 0.0 | 0.105 | 37.08 ± 6.77 | 0.21 ± 0.29 | 0.06 ± 0.013 | 2.14 ± 0.1 |
| 0.35 | 0.105 | 45.19 ± 1.49 | 0.44 ± 0.17 | 0.07 ± 0.14 | 2.99 ± 0.72 |
| 0.7 | 0.105 | 42.76 ± 4.66 | 0.55 ± 0.30 | 0.08 ± 0.01 | 3.35 ± 0.45 |
| 0.0 | 0.2 | 25.44 ± 1.34 | 1.28 ± 0.01 | 0.08 ± 0.00 | 2.05 ± 0.13 |
| 0.35 | 0.2 | 29.38 ± 3.59 | 0.26 ± 0.08 | 0.09 ± 0.01 | 2.85 ± 0.70 |
| 0.7 | 0.2 | 34.63 ± 3.27 | 0.17 ± 0.01 | 0.1 ± 0.00 | 3.43 ± 0.10 |
9.5.3.3 Interaction between ECG and Proteins
9.5.3.3.1 ECG and WPI Mixture
Since proteins and polysaccharides are the major components of food systems and they play an essential role in their structure, texture, and stability, the study of mixed system properties is important to the food industry development. Among all food proteins, whey proteins have been extensively studied because of their important functional and nutritional properties. One important functional property is their ability to form gels. The gelation of whey proteins has been studied in the presence of a wide variety of polysaccharides [58–60]. Different types of mixed gels can be obtained according to the relative concentration of each macromolecule, their nature (neutral or ionic), and environmental conditions (temperature, pH, and ionic strength) [61]. The textural, mechanical, and sensory properties of these gels are a consequence of their microstructure, and this depends on the type and degree of protein–protein and protein–polysaccharide interactions, among other things [62].
Our group studied the interactions and the rheological properties of WPI/ECG mixed gels [15]. The WPI concentration was 12% w/w, and ECG was added at 0.12, 0.36, and 0.60% (w/w), leading to final ratios of 1:0.01, 1:0.03, and 1:0.05 [15]. On the basis of the results of the uniaxial compression test, the increment in ECG concentration led to an increase in the maximum stress (σM), this being significant from 0.36% of ECG onward. The maximum Hencky strain (ɛM) of the gels was not affected by the ECG concentration (p > 0.05). Similar results were obtained by Fitzsimons et al. [38] in WPI/GG mixed gels.
By means of confocal laser microscopy, it could be observed that WPI/ECG mixed systems exhibited phase separation. This phase separation could be the reason for the higher maximum strength in WPI/ECG gels when compared with WPI alone and lower pore size, since ECG could create micro‐areas with higher protein concentration, reinforcing the network cross‐linking. The addition of polysaccharide might cause protein molecules to approach each other, probably acting as a filler [63]. However, there are other protein–polysaccharide interactions that could be considered in the gel formation, such as hydrogen bonds among certain groups of polysaccharide and proteins. Electrostatic interactions between WPI and ECG should be underestimated because ECG is a neutral polysaccharide [15].
9.5.3.3.2 ECG and Sodium Caseinate Mixture
The influence of ECG addition on sodium caseinate's (NaCAS) properties was studied by López et al. [64]. NaCAS is derived from micellar casein and is composed of a soluble mixture of four proteins (α‐s1, α‐s2, β‐, and κ‐caseins), excluding the phosphate and calcium components. In solution, NaCAS is a mixture of monomeric or small aggregated particles [65]. They studied the aqueous interaction in diluted and concentrated systems by zeta potential, size distribution, and viscosity measurements. They found that the zeta potential of NaCAS was not affected by ECG at the different concentrations studied, suggesting that there was no modification in the surface charge of the NaCAS particles in the presence of ECG. The authors also found an increase in NaCAS particle size due to the addition of ECG, suggesting that the presence of ECG favors NaCAS self‐aggregation. Moreover, they found an increase in the size of the protein particles after 24 h incubation, which suggests that ECG affects not only the aggregation of NaCAS but also its stability in solution [66]. Other systems composed of galactomannans and caseins also showed phase separation [67]. Each system has a different concentration in which the phase separation occurs, so it is important to determine that biopolymer concentration. A relatively low concentration of ECG is needed to induce phase separation in NaCAS systems. However, even lower concentrations of GG were needed to induce phase separation in NaCAS/GG mixtures [68], which can be explained by taking into account that ECG has a lower molecular weight than GG [6]. Regarding the effect of ECG on viscosity, the authors have found a synergism between ECG and NaCAS that could be due to changes in the NaCAS structure in solution as a result of the presence of ECG. Comparing their results with those obtained by Bourriot et al. [69] in GG/casein micelles systems, it could be concluded that the flocculation of NaCAS as a result of the exclusion of the ECG from the protein surface is responsible for the observed behavior. In conclusion, the authors found that ECG and NaCAS did not interact effectively since the results would indicate that ECG is excluded from the protein surface, but it is likely to favor the aggregation of NaCAS. The results also suggested that the presence of ECG may induce the formation of NaCAS aggregates, whose sizes depend on the ECG concentration. The authors proposed that ECG addition causes NaCAS aggregation through depletion‐flocculation since the galactomannan is excluded from the NaCAS surface.
The same authors studied the effect of ECG on the aggregation and gelation of NaCAS and the physical characteristics of the derived acid‐induced gels [70]. NaCAS can produce a gel by acidification. The unfolded proteins solution first leads to protein aggregation, and when the amount of aggregated protein exceeds a critical concentration, a gel protein network can be formed by the association among these protein aggregates, for example, by inhibiting the electrostatic repulsion among aggregates. The gel properties depend strongly on the structure of the protein aggregates and their association into a three‐dimensional network [71]. Acidification of NaCAS can be carried out by microbial fermentation or by the chemical method through hydrolysis of GDL into gluconic acid [72]. First, López et al. [70] carried out the aggregation process, which consists of the removal of the electrostatic repulsion of the negative surface charges of NaCAS by means of GDL hydrolysis into gluconic acid. While the aggregation was under way, there was a decrease in the pH until the equilibrium gluconate/gluconic acid was established. ECG did not change the net amount of protonable groups exposed by NaCAS but affected the acidification rate, extending the time required to reach the aggregation pH as the ECG concentration increased. The presence of ECG did not modify the aggregation pH, which is the pH value at which gels are formed; in this case, it was 5.00 ± 0.02 and was not influenced by the addition of ECG. The gels containing ECG exhibited lower water‐holding capacity, maybe due to a phase separation through a depletion‐flocculation mechanism as seen in the previous study [70]. The mechanical properties with 0.1% (w/w) of ECG presented a similar penetrometer profile to those obtained for the NaCAS gels in the absence of ECG. Although firmness was not affected, the gel broke at a lower deformation rate than it did in the absence of ECG, the fracture force also being lower. On the other hand, the addition of 0.2% (w/w) ECG produced fewer firm gels that fracture at less penetration, thus being less deformable. The presence of the highest ECG concentration (0.3%, w/w) dramatically affected the mechanical properties of the system, reducing firmness significantly and making it impossible to determine the fracture point. Even though phase separation was not observed macroscopically, it was confirmed by confocal microscopy images analysis. The effect of ECG on the size distribution of the protein aggregates is not clear. However, the size of the pores in NaCAS acid‐induced gels is smaller and their distribution is narrower in the presence of ECG, which are similar results to those obtained by Spotti et al. [73] in the WPI/ECG heat set gels described in the previous section.
9.5.4 ECG Microspheres
The possibility of using biodegradable polymers as drug carriers attracted the attention of many researchers since biodegradable polymers have several advantages: biocompatibility, low dosage, and reduced side effects are some reasons why using biodegradable microspheres have gained in popularity. The drug and polymer may be combined in a number of different ways depending upon the application of interest. Microparticulate formulations have the widest applicability to the widest variety of formulation needs: oral delivery, intramuscular injection, subcutaneous injection, and targeted delivery.
The use of ECG for synthesizing microspheres for use in the transport of pharmaceutical drugs was compared with GG, and ECG‐XG and GG‐XG mixed systems [74]. The microspheres were prepared using the emulsion solvent evaporation/extraction method with glutaraldehyde (GA) as a cross‐linker. The chemical reaction between an excess of cross‐linker and the polymeric chains leads to the formation of a network [75]. According to the chemical structure of the repeating units of galactomannans, such as ECG and GG, and owing to the fact that the reaction of GA occurs only with the vicinal diols, the network formed in the presence of an excess of GA could exhibit a high degree of cross‐linking [75].
In order to prepare the spheres, the aqueous phase (AP) was prepared by dissolving ECG, GG, ECG‐XG, and GG‐XG solutions (3%, w/w) with Tween 80 (0.2%, w/w) and GA at 2% (w/w) under continuous and moderate stirring while the pH was decreased to 2 with 2 N HCl (to protonate the hydroxyl groups of the polymer) [74]. The oil phase (OP) was prepared using castor oil with Span 80 (5%, w/w). Both Tween 80 and Span 80 are emulsifiers; the former is soluble in the AP and the latter in the OP. Both phases, OP and AP, were mixed with a Baring Blender homogenizer (United States) to generate the water‐in‐oil emulsion. After stirring, the emulsion was mixed with ethanol to dehydrate the particles. OP was eliminated, the microspheres were sieved, and the GA was removed. The microspheres were dehydrated using acetone washes and dried. To analyze the absorption and retention of drugs, theophylline (THF) was used as a model molecule. THF is a bronchus‐dilator drug, but its use in the treatment of asthma has been restricted due to its short half‐life. One way to minimize this limitation is to encapsulate THF in an appropriate vehicle. The microspheres were allowed to soak up in a 0.67% (w/w) THF solution. The process was carried out at room temperature with moderate stirring. Since THF is insoluble in acetone, the microspheres were washed with this solvent and dried. To analyze the THF desorption process, the UV–Vis absorption spectrum of THF was obtained (Perkin Elmer, United States), the maximum absorption value occurring at 271 nm. The desorption process of THF was carried out at pH 6.8 and 37 °C with moderate stirring. Samples were taken at different times, and the absorption at 271 nm was determined [74]. It was found that after 2 h, GG and ECG systems released 8.48 ± 0.05% and 8.36 ± 0.05% THF, whereas GG‐XG and ECG‐XG released 15.51 ± 0.03% and 10.84 ± 0.09% THF, respectively. Sandolo et al. [75] have studied also the release of THF from GG hydrogels cross‐linked with GA and found that 97% of the charge was released in 8 h.
9.6 Conclusions and Future Trends
ECG exhibits shear‐thinning behavior, being influenced by the temperature but being stable after heating, salt addition, and pH decrease. ECG exhibits less viscosity and less pseudoplastic behavior than GG at the same concentration, probably because of its lower molecular weight. The stabilizing capacity of ECG for thermodynamically unstable systems such as foams and emulsions shows that oil‐in‐water emulsions prepared by ECG exhibit stability against the destabilization process because the gum increases the viscosity of the continuous phase, which produces a decrease in the creaming rate. In regard to the addition of ECG in foam systems, the gum exhibits the same effect as in emulsions, and thus the foams formulated with this gum are more stable to the disproportion phenomena and the draining time increase. ECG in combination with different biopolymers exhibits synergic interactions with other polysaccharides, such as XG and carrageenan. In systems with XG, the rheological properties depend on the ion addition and changes in temperature. ECG in gel systems like carrageenan/KCl improves the gel strength and decreases the syneresis of these mixed gels. ECG in combination with different proteins can improve the mechanical properties of the mixed gels. The results presented in this chapter could deepen the knowledge of the potentials of this gum as thickening and stabilizing agents for foams and emulsions, and also as a modifier of texture along with other biopolymers, among other uses. However, further studies should be carried out on the production and commercialization of this gum by the countries in which this gum originates. In this way, the gum could compete in the market with commercial gums such as GG and LBG, opening new markets and offering opportunities to these developing countries.
References
- 1 http://arbolesdelchaco.blogspot.com.ar/2016/01/espina‐corona‐camba‐nambi‐coronillo.html.
- 2 Azero, E.G. and Andrade, C.T. (2002). Testing procedures for galactomannan purification. Polymer Testing 21 (5): 551–556.
- 3 Perduca, M.J. (2013) Goma espina corona : purificación, interacciones con otras gomas. PhD thesis. Universidad de Chaco Austral.
- 4 Cerezo, A.S. (1965). The constitution of a galactomannan from the seed of Gleditsia amorphoides 1. The Journal of Organic Chemistry 30 (3): 924–927.
- 5 Chaubey, M. and Kapoor, V.P. (2001). Structure of a galactomannan from the seeds of Cassia angustifolia Vahl. Carbohydrate Research 332 (4): 439–444.
- 6 Perduca, M.J., Spotti, M.J., Santiago, L.G. et al. (2013). Rheological characterization of the hydrocolloid from Gleditsia amorphoides seeds. LWT‐Food Science and Technology 51 (1): 143–147.
- 7 Rao, M.A. (2007). Rheology of Fluid and Semisolid Foods. Boston, MA: Springer US.
- 8 Ahmed, J., Ramaswamy, H.S., and Ngadi, M.O. (2005). Rheological characteristics of Arabic gum in combination with guar and xanthan gum using response surface methodology: effect of temperature and concentration. International Journal of Food Properties 8 (2): 179–192.
- 9 Marcotte, M., Hoshahili, A.R.T., and Ramaswamy, H.S. (2001). Rheological properties of selected hydrocolloids as function of concentration and temperature. Food Research International. 34: 695–703. https://doi.org/10.1016/S0963‐9969(01)00091‐6.
- 10 Downey, G. (2002). Quality changes in frozen and thawed, cooked puréed vegetables containing hydrocolloids, gums and dairy powders. International Journal of Food Science and Technology 37 (8): 869–877.
- 11 Wielinga, W.C. (2009). Galactomannans. In: Handbook of Hydrocolloids, 2e (ed. G.O. Phillips and P.A. Williams), 228–251. Woodhead Publishing Series in Food Science, Technology and Nutrition.
- 12 García‐Ochoa, F., Santos, V.E., Casas, J.A., and Gómez, E. (2000). Xanthan gum: production, recovery, and properties. Biotechnology Advances 18 (7): 549–579.
- 13 Glicksman, M. (1982). Food Hydrocolloids. Boca Ratón, FL: CRC Press.
- 14 Pavón, Y.L., Lazzaroni, S.M., Sabbag, N.G., and Rozycki, S.D. (2014). Simultaneous effects of gelatin and espina corona gum on rheological, physical and sensory properties of cholesterolreduced probiotic yoghurts. International Journal of Food Science and Technology 49 (10): 2245–2251.
- 15 Spotti, M.J., Santiago, L.G., Rubiolo, A.C., and Carrara, C.R. (2012). Mechanical and microstructural properties of milk whey protein/espina corona gum mixed gels. LWT‐Food Science and Technology 48 (1): 69–74.
- 16 Johansen, S.M.B., Laugesen, J.L., Janhøj, T. et al. (2008). Prediction of sensory properties of low‐fat yoghurt and cream cheese from surface images. Food Quality and Preference 19 (2): 232–246.
- 17 Gallardo‐Escamilla, F.J., Kelly, A.L., and Delahunty, C.M. (2007). Mouthfeel and flavour of fermented whey with added hydrocolloids. International Dairy Journal 17 (4): 308–315.
- 18 Akalın, A.S., Unal, G., Dinkci, N., and Hayaloglu, A.A. (2012). Microstructural, textural, and sensory characteristics of probiotic yogurts fortified with sodium calcium caseinate or whey protein concentrate. Journal of Dairy Science 95 (7): 3617–3628.
- 19 Marafon, A.P., Sumi, A., Alcântara, M.R. et al. (2011). Optimization of the rheological properties of probiotic yoghurts supplemented with milk proteins. LWT‐Food Science and Technology 44 (2): 511–519.
- 20 Fiszman, S.M., Lluch, M.A., and Salvador, A. (1999). Effect of addition of gelatin on microstructure of acidic milk gels and yoghurt and on their rheological properties. International Dairy Journal 9 (12): 895–901.
- 21 Amatayakul, T., Halmos, A.L., Sherkat, F., and Shah, N.P. (2006). Physical characteristics of yoghurts made using exopolysaccharide‐producing starter cultures and varying casein to whey protein ratios. International Dairy Journal 16 (1): 40–51.
- 22 Bot, A., Van Amerongen, I.A., Groot, R.D. et al. (1996). Large deformation rheology of gelatin gels. Polymer Gels and Networks 4 (3): 189–227.
- 23 Stading, M. and Hermansson, A.M. (1990). Viscoelastic behaviour of β‐lactoglobulin gel structures. Topics in Catalysis 4 (2): 121–135.
- 24 Sittikijyothin, W., Torres, D., and Gonçalves, M.P. (2005). Modelling the rheological behaviour of galactomannan aqueous solutions. Carbohydrate Polymers 59 (3): 339–350.
- 25 Dickinson, E. (1992). An Introduction to Food Colloids. Oxford: Oxford University Press.
- 26 McClements, D.J. (2015). Food Emulsions : Principles, Practices, and Techniques. Boca Ratón, FL: CRC Press.
- 27 Chiralt, A. (2009). Food emulsions. In: Food Engineering, vol. II (ed. G.V. Barbosa‐Cánovas), 150–175. EOLSS Publications.
- 28 Murray, B.S. and Ettelaie, R. (2004). Foam stability: proteins and nanoparticles. Current Opinion in Colloid and Interface Science 9 (5): 314–320.
- 29 Dickinson, E. (2010). Food emulsions and foams: stabilization by particles. Current Opinion in Colloid and Interface Science 15 (1–2): 40–49.
- 30 Saha, D. and Bhattacharya, S. (2010). Hydrocolloids as thickening and gelling agents in food: a critical review. Journal of Food Science and Technology 47 (6): 587–597.
- 31 Cayot, P., and Lorient, D. (1997) Structure‐Function Relationships of Whey Proteins, in Food Proteins and Their Applications, 225–250. (Ed: S. Damodaran). New York: Routledge.
- 32 Milani, J., and Maleki, G. (2012) Hydrocolloids in food industry, in Food Industrial Processes‐Methods and Equipment.(Ed: B. Valdéz). Tech Open. https://doi.org/10.5772/32358
- 33 Hill, S.E., Ledward, D.A., and Mitchell, J.R. (1998). Functional Properties of Food Macromolecule. Aspen.
- 34 Morris, E.R., Rees, D.A., Young, G. et al. (1977). Order‐disorder transition for a bacterial polysaccharide in solution. A role for polysaccharide conformation in recognition between Xanthomonas pathogen and its plant host. Journal of Molecular Biology 110 (1): 1–16.
- 35 Higiro, J., Herald, T.J., and Alavi, S. (2006). Rheological study of xanthan and locust bean gum interaction in dilute solution. Food Research International 39 (2): 165–175.
- 36 Bresolin, T.M.B., Sander, P.C., Reicher, F. et al. (1997). Viscometric studies on xanthan and galactomannan systems. Carbohydrate Polymers 33 (2–3): 131–138.
- 37 Fitzpatrick, P., Meadows, J., Ratcliffe, I., and Williams, P.A. (2013). Control of the properties of xanthan/glucomannan mixed gels by varying xanthan fine structure. Carbohydrate Polymers 92 (2): 1018–1025.
- 38 Fitzsimons, S.M., Tobin, J.T., and Morris, E.R. (2008). Synergistic binding of konjac glucomannan to xanthan on mixing at room temperature. Food Hydrocolloids 22 (1): 36–46.
- 39 Wang, F., Wang, Y.J., and Sun, Z. (2002). Conformational role of xanthan in its interaction with locust bean gum. Journal of Food Science 67 (7): 2609–2614.
- 40 Khouryieh, H.A., Herald, T.J., Aramouni, F., and Alavi, S. (2006). Influence of mixing temperature on xanthan conformation and interaction of xanthan‐guar gum in dilute aqueous solutions. Food Research International 39 (9): 964–973.
- 41 Mannion, R.O., Melia, C.D., Launay, B. et al. (1992). Xanthan locust bean gum interactions at room‐temperature. Carbohydrate Polymers 19 (2): 91–97.
- 42 Schorsch, C., Garnier, C., and Doublier, J.L. (1997). Viscoelastic properties of xanthan/galactomannan mixtures: comparison of guar gum with locust bean gum. Carbohydrate Polymers 34 (3): 165–175.
- 43 Dea, I.C.M., Morris, E.R., Rees, D.A. et al. (1977). Associations of like and unlike polysaccharides: mechanism and specificity in galactomannans, interacting bacterial polysaccharides, and related systems. Carbohydrate Research 57 (C): 249–272.
- 44 Dea, I.C.M. and Morrison, A. (1975). Chemistry and interactions of seed galactomannans. Advances in Carbohydrate Chemistry and Biochemistry 31 (C): 241–312.
- 45 Higiro, J., Herald, T.J., Alavi, S., and Bean, S. (2007). Rheological study of xanthan and locust bean gum interaction in dilute solution: effect of salt. Food Research International 40 (4): 435–447.
- 46 Lai, L. and Chiang, H. (2002). Rheology of decolorized hsian‐tsao leaf gum in the dilute domain. Food Hydrocolloids 16: 427–440.
- 47 Clark, R.C. (1987). Viscoelastic response of xanthan guar gum blends. In: Gums and Stabilisers for the Food Industry (ed. G.O. Phillips, P.A. Williams and D.J. Wedlock), 165–172. Oxford: IRL Press.
- 48 Goycoolea, F.M., Richardson, R.K., Morris, E.R., and Gidley, M.J. (1995). Stoichiometry and conformation of xanthan in synergistic gelation with locust bean gum or Konjac Glucomannan: evidence for heterotypic binding. Macromolecules 28 (24): 8308–8320.
- 49 Pinheiro, A.C., Bourbon, A.I., Rocha, C. et al. (2011). Rheological characterization of κ‐carrageenan/galactomannan and xanthan/galactomannan gels: comparison of galactomannans from non‐traditional sources with conventional galactomannans. Carbohydrate Polymers 83 (2): 392–399.
- 50 Campo, V.L., Kawano, D.F., da Silva, D.B., and Carvalho, I. (2009). Carrageenans: biological properties, chemical modifications and structural analysis – a review. Carbohydrate Polymers 77 (2): 167–180.
- 51 Piculell, L. (1995). Gelling carrageenans. In: Food Polysaccharides and Their Application (ed. S.M. Alistair), 205–245. Boca Ratón, FL: CRC Press.
- 52 Hemar, Y., Hall, C.E., Munro, P.A., and Singh, H. (2002). Small and large deformation rheology and microstructure of κ‐carrageenan gels containing commercial milk protein products. International Dairy Journal 12 (4): 371–381.
- 53 Rosenthal, A. (2001). Textura de los alimentos: medida y percepción. Acribia, Zaragoza.
- 54 Çak, E. and Foegeding, E.A. (2011). Combining protein micro‐phase separation and protein e polysaccharide segregative phase separation to produce gel structures. Food Hydrocolloids 25: 1538–1546.
- 55 Yamamoto, F. and Cunha, R.L. (2007). Acid gelation of gellan : effect of final pH and heat treatment conditions. Carbohydrate Polymers 68: 517–527.
- 56 Steffe, J. (1996). Rheological Methods in Food Process Engineering. Freeman Press, East Lansing, MI.
- 57 Friedman, H.H., Whitney, J.E., and Szczesniak, A.S. (1963). The texturometer – a new instrument for objective texture measurement. Journal of Food Science 28: 390–396.
- 58 Bertrand, M.E. and Turgeon, S.L. (2007). Improved gelling properties of whey protein isolate by addition of xanthan gum. Food Hydrocolloids 21 (2): 159–166.
- 59 Bryant, C.M. and McClements, D.J. (2000). Influence of xanthan gum on physical characteristics of heat‐denatured whey protein solutions and gels. Food Hydrocolloids 14 (4): 383–390.
- 60 Li, J., Ould Eleya, M.M., and Gunasekaran, S. (2006). Gelation of whey protein and xanthan mixture: effect of heating rate on rheological properties. Food Hydrocolloids 20 (5): 678–686.
- 61 Spahn, G., Baeza, R., Santiago, L.G., and Pilosof, A.M.R. (2008). Whey protein concentrate/λ‐carrageenan systems: effect of processing parameters on the dynamics of gelation and gel properties. Food Hydrocolloids 22 (8): 1504–1512.
- 62 van den Berg, L., Rosenberg, Y., van Boekel, M.A.J.S. et al. (2009). Microstructural features of composite whey protein/polysaccharide gels characterized at different length scales. Food Hydrocolloids 23 (5): 1288–1298.
- 63 Tavares, C. and Lopes Da Silva, J.A. (2003). Rheology of galactomannan‐whey protein mixed systems. International Dairy Journal 13 (8): 699–706.
- 64 López, D.N., Galante, M., Alvarez, E.M. et al. (2017). Physicochemical study of mixed systems composed by bovine caseinate and the galactomannan from Gleditsia amorphoides. Carbohydrate Polymers 173: 1–6.
- 65 Lucey, J.A., Srinivasan, M., Singh, H., and Munro, P.A. (2000). Characterization of commercial and experimental sodium Caseinates by multiangle laser light scattering and size‐exclusion chromatography. Journal of Agricultural and Food Chemistry 48 (5): 1610–1616.
- 66 Sharafbafi, N., Alexander, M., Tosh, S.M., and Corredig, M. (2014). Dynamics of phase separation in oat β‐glucan/milk mixtures studied with ultrasonic and diffusing wave spectroscopy. Food Biophysics 10 (1): 66–75.
- 67 Neirynck, N., Van lent, K., Dewettinck, K., and Van der Meeren, P. (2007). Influence of pH and biopolymer ratio on sodium caseinate‐guar gum interactions in aqueous solutions and in O/W emulsions. Food Hydrocolloids 21 (5–6): 862–869.
- 68 Hidalgo, M.E., Fontana, M., Armendariz, M. et al. (2015). Acid‐induced aggregation and gelation of sodium Caseinate‐guar gum mixtures. Food Biophysics 10 (2): 181–194.
- 69 Bourriot, S., Garnier, C., and Doublier, J.L. (1999). Phase separation, rheology and microstructure of micellar casein‐guar gum mixtures. Food Hydrocolloids 13 (1): 43–49.
- 70 López, D.N., Galante, M., Alvarez, E.M. et al. (2017). Effect of the espina corona gum on caseinate acid‐induced gels. LWT‐Food Science and Technology 85: 121–128.
- 71 Maltais, A., Remondetto, G.E., and Subirade, M. (2008). Mechanisms involved in the formation and structure of soya protein cold‐set gels: a molecular and supramolecular investigation. Food Hydrocolloids 22 (4): 550–559.
- 72 Braga, A.L.M., Menossi, M., and Cunha, R. (2006). The effect of glucono‐δ‐lactone/caseinate ratio on sodium caseinate gelation. International Dairy Journal 16: 389–398.
- 73 Loyeau, P. A. (2015) Desarrollo de microesferas de galactomananos para la liberaci{on controlada dedrogas farmacéuticas. Bachelor thesis, Universidad nacional del Litoral.
- 74 Sandolo, C., Matricardi, P., Alhaique, F., and Coviello, T. (2007). Dynamo‐mechanical and rheological characterization of guar gum hydrogels. European Polymer Journal 43 (8): 3355–3367.
- 75 Mathur, N.K. (2011). Industrial Galactomannan Polysaccharides. Boca Ratón, FL: CRC Press.