16
Marshmallow (Althaea officinalis) Flower Gum
Seyedeh Fatemeh Mousavi Seyed M.A. Razavi and Arash Koocheki
Food Hydrocolloids Research Centre, Department of Food Science and Technology, Ferdowsi University of Mashhad (FUM), Mashhad, Iran
16.1 Introduction
Marshmallow (Althaea officinalis), known as Khatmi in Iran, is a herb belonging to the Malvaceae family which is often used as a traditional medicine, especially for treatment of cough and irritation of mucous membranes (Figure 16.1) [1]. This plant is broadly distributed throughout the world, mainly in the Mediterranean, Europe, Southwest Asia, Central Asia, North Africa [2], America, Russia [3], and Iran [4]. Several chemical substances including pectin (11%), mono‐ and disaccharides, saccharose (10%), starch (25%–35%), mucilage (5%), flavonoids, coumarins, scopoletin, phytosterols, tannins, and many amino acids are being extracted from different parts of A. officinalis for industrial applications [5,6]. Further studies have showed that an aqueous extract of A. officinalis flower has potential benefits in inflammation, gastric ulcer, and platelet aggregation with no visible adverse effects [7].
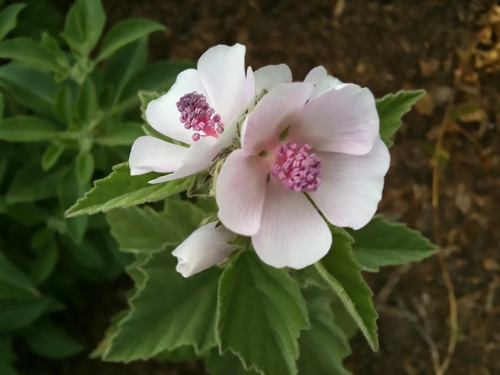
Figure 16.1 Marshmallow (Althaea officinalis) flower.
Mucilage is a hydrocolloid, a complex polymer with the nature of a carbohydrate having branched structures and soluble hydrophilic polysaccharides, which are thick, sticky substances [8]. Marshmallow mucilage mainly consists of galactose, rhamnose, glucuronic acid, and galacturonic acid in the molar ratios 1.2:1.0:1.0:1.0, respectively. Al‐Snafi [9] reported that the oligosaccharides of [O]‐α‐(galactopyranosyluronic acid)‐(1‐2)‐rhamnopyranose, [O]‐β‐(glucopyranosyluronic acid)‐(1‐3)‐[O]‐α‐(galactopyranosyluronic acid)‐(1‐2) rhamnopyranose and hexasaccharide, monosaccharide, dodecasaccharide are composed of a repeating unit having the structure of a trisaccharide through position 4 of the galacturonic acid residue in marshmallow flower gum (MFG).
There is still a growing demand for new sources of hydrocolloids with specific functional properties and good price. Such material could be a potential alternative to some commercial products. Gums have been utilized commercially as thickeners, bio‐adhesives, binders, stabilizers, and gelling agents [10]. There are many studies on the optimization of gum extraction from new sources using response surface methodology (RSM), such as Salvia macrosiphon [11], Alyssum homolocarpum [12], Lepidium perfoliatum [13], Ocimum basilicum [14], Lepidium sativum [15], Eruca sativa [16], Acanthophyllum bracteatum root [17], and quince seed [18]. In addition, knowledge of structural properties is an important requirement for understanding the gelling properties, rheological behavior, and other functional characteristics of gums, which are directly related to the structural features [19]. The rheological properties of polysaccharide gum in aqueous solutions have an important role in developing structure‐function relationships for systems of polysaccharide solutions [20]. Moreover, the rheological properties of hydrocolloid in aqueous solutions have a major influence on the technological processes involved, such as heating, mixing, filtering, and so on [21]. It is essential to take into consideration the effects of temperature, concentration [22], shear rate, ionic strength, and pH [23] on viscosity in the evaluation of materials and design of food processing equipment.
Although some studies were conducted on the A. officinalis roots mucilage, comprehensive information has not been reported on the characterization of its flower mucilage. Therefore, the objectives of the present chapter are (1) to investigate the effect of extraction conditions on the yield, consistency coefficient, emulsion stability, foam stability, and color, (2) to find out the optimum conditions for extraction of MFG by RSM, (3) to explore physicochemical profiling such as the chemical composition, structural analysis, macromolecular characteristics, antioxidant activity, and thermal decomposition behavior of MFG, and (4) to determine the influence of varying temperature, concentration, and pH on the intrinsic viscosity and rheological properties of MFG as a new hydrocolloid source.
16.2 Extraction Optimization using RSM
16.2.1 Fitting Models
For extraction optimization of MFG, the effect of independent variables including pH (5, 9, and 9), temperature (25, 45, and 65 °C) and water‐to‐powder ratio (W/P, 40, 60, and 80) on the yield, consistency coefficient, emulsion stability, foam stability, and lightness (L*) values were evaluated. The significance of each coefficient was determined using the p‐value. The result showed that adding terms up to quadratic will significantly improve the model (Table 16.1); therefore, a quadratic model was the most appropriate model for prediction of the five responses as a function of the independent variables. Also, the lack of fit was not significant, which suggested that the quadratic models were desirable for prediction of the relevant responses (Table 16.2). The results of statistical analysis also showed that the R2 value for each dependent variable was higher than 0.80.
Table 16.1 Sequential model and sum of squares analyzed for each response (Yield, k, L*, FSI, and ESI).
| Yield | k | L | FSI | ESI | ||||||||||||
| Source | DF | Mean Square | Value F | Prob. F | Mean Square | Value F | Prob. F | Mean Square | Value F | Prob. F | Mean Square | Value F | Prob. F | Mean Square | Value F | Prob. F |
| Mean | 1 | 1354 | — | — | 349.2 | — | — | 1.437 × 10⁵ | — | — | 1.331 × 10⁵ | — | — | 1.366 × 10⁵ | — | — |
| Linear | 3 | 6.6 | 0.74 | 0.542 | 37.83 | 4.11 | 0.0244 | 102.5 | 19.19 | 0.1 | 82.36 | 0.43 | 0.7355 | 19.88 | 0.77 | 0.5262 |
| 2FI | 3 | 2.02 | 0.19 | 0.8994 | 1.49 | 0.14 | 0.9372 | 7.15 | 1.45 | 0.2735 | 514.05 | 4.38 | 0.0241 | 34.94 | 1.48 | 0.2662 |
| Quadratic | 3 | 38.68 | 19.36 | 0.0002 | 34.87 | 9.13 | 0.0033 | 12.44 | 4.66 | 0.0276 | 330.33 | 6.19 | 0.012 | 86.43 | 18.1 | 0.0002 |
| Cubic | 4 | 3.56 | 1.72 | 0.2625 | 9.98 | 5.43 | 0.034 | 1.39 | 0.28 | 0.882 | 67.32 | 0.91 | 0.5145 | 7.5 | 1.34 | 0.3564 |
| Residual | 6 | 3.1 | — | — | 2.76 | — | — | 7.51 | — | — | 110.58 | — | — | 8.41 | — | — |
| Total | 20 | 1407.96 | — | — | 436.12 | — | — | 1.438 × 10⁵ | — | 1.342 × 10⁵ | — | — | 1.368 × 10⁵ | — | — | |
k, consistency coefficient; L*, color component parameter; FSI, foaming stability index; ESI, emulsion stability index.
Table 16.2 ANOVA and regression coefficients of models for the response variables.
| Response | Source | Sum of square | DF | Mean square | Value F | Prob. F |
| Extraction yield | Models | 43.22 | 4 | 10.80 | 15.09 | <0.0001** |
| A | 0.72 | 1 | 0.72 | 1.00 | 0.3325ns | |
| C | 5.49 | 1 | 5.49 | 7.67 | 0.0143* | |
| A2 | 33.63 | 1 | 33.63 | 46.96 | <0.0001** | |
| C2 | 4.04 | 1 | 4.04 | 5.94 | 0.0314* | |
| Lack of fit | 9.50 | 10 | 0.95 | 3.81 | 0.0765ns | |
| Pure error | 1.25 | 5 | 0.25 | — | — | |
| Consistency coefficient (k) | Models | 70.88 | 4 | 17.72 | 16.57 | <0.0001** |
| A | 10.51 | 1 | 10.51 | 9.82 | 0.0068** | |
| B | 26.83 | 1 | 26.83 | 25.09 | 0.0002** | |
| C | 0.49 | 1 | 0.49 | 0.46 | 0.5076ns | |
| C2 | 33.05 | 1 | 33.05 | 30.91 | <0.0001** | |
| Lack of fit | 13.58 | 10 | 1.36 | 2.76 | 0.1371ns | |
| Pure error | 2.46 | 5 | 0.49 | — | — | |
| Lightness (L*) | Models | 113.12 | 5 | 22.63 | 17.74 | <0.0001** |
| A | 40.28 | 1 | 40.28 | 31.58 | <0.0001** | |
| B | 8.39 | 1 | 8.39 | 6.58 | 0.0225* | |
| C | 53.82 | 1 | 53.82 | 42.19 | <0.0001** | |
| B2 | 8.40 | 1 | 8.40 | 6.58 | 0.0224* | |
| C2 | 8.61 | 1 | 8.61 | 6.75 | 0.0211* | |
| Lack of fit | 11.58 | 9 | 1.29 | 1.02 | 0.5189ns | |
| Pure error | 6.28 | 5 | 1.26 | — | — | |
| Foaming stability index (FSI) | Models | 919.80 | 6 | 153.30 | 10.79 | 0.0002** |
| A | 10.49 | 1 | 10.49 | 0.74 | 0.4059ns | |
| B | 71.88 | 1 | 71.88 | 5.06 | 0.0425* | |
| C | 9.0 × 10⁻⁵ | 1 | 9.0 × 10⁻⁵ | 6.33 × 10⁻⁶ | 0.9980ns | |
| B2 | 325.06 | 1 | 325.06 | 22.87 | 0.0004** | |
| AB | 267.73 | 1 | 267.73 | 18.84 | 0.0008** | |
| AC | 244.65 | 1 | 244.65 | 17.21 | 0.0011** | |
| Lack of fit | 155.20 | 8 | 19.40 | 3.28 | 0.1031ns | |
| Pure error | 29.55 | 5 | 5.91 | — | — | |
| Emulsion stability index (ESI) | Models | 133.18 | 7 | 19.03 | 9.52 | 0.0004** |
| A | 12.10 | 1 | 12.10 | 6.05 | 0.0300* | |
| B | 3.04 | 1 | 3.04 | 1.52 | 0.2414ns | |
| C | 4.75 | 1 | 4.75 | 2.37 | 0.1493ns | |
| A2 | 23.84 | 1 | 23.84 | 11.92 | 0.0048** | |
| B2 | 28.35 | 1 | 28.35 | 14.18 | 0.0027** | |
| C2 | 23.95 | 1 | 23.95 | 11.98 | 0.0047** | |
| BC | 26.86 | 1 | 26.86 | 13.44 | 0.0032** | |
| Lack of fit | 18.01 | 7 | 2.57 | 2.15 | 0.2078ns | |
| Pure error | 5.98 | 5 | 1.20 | — | — |
A, pH; B, Temperature; C, W/P ratio.
** means “highly significant” (p < 0.01), and * means “significant” (p < 0.05).
ns means “not significant.”
16.2.2 Effect of Extraction Conditions on Yield
The linear and quadratic effects of the W/P ratio (C and C2, p < 0.05) and the quadratic effect of the pH of extraction (A2, p < 0.01) were significant terms (Table 16.2), whereas other terms have a negligible effect on the model and did not show any interactive effect among independent variables. The equation below was developed for the extraction yield of MFG:
The variation of the yield with the pH and W/P ratio at constant temperature (45 °C) is presented in Figure 16.2a. It is clear that the yield value increased with an increase in pH up to 7, but afterward, the increase in pH of extraction reduced the yield. A similar result was obtained by Koocheki et al. [16], who reported that when the pH of extraction was increased from 4 to 7, a greater mucilage yield was obtained from E. sativa seed. However, contrary results were found by Balke and Diosady [24], Estévez et al. [25], Somboonpanyakul et al. [26], and Karazhiyan et al. [23], who found that the highest yield was in alkaline solution for white mustard seed, mesquite, malva gums, and cress seed gum, respectively. Furuta et al. [27] obtained a greater soybean polysaccharide extraction in acidic conditions.

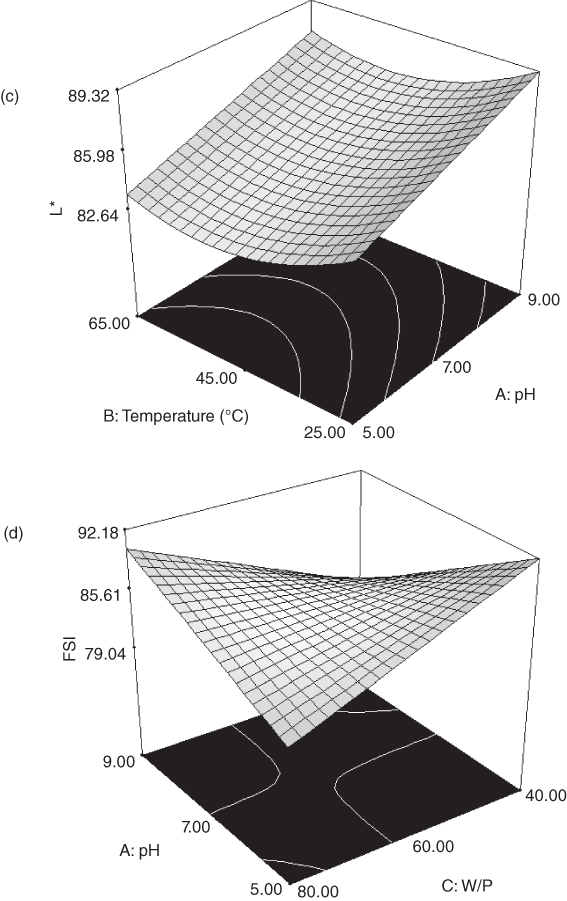

Figure 16.2 Response surface plot for the extraction optimization of marshmallow flower gum (MFG): (a) effect of water‐powder ratio and pH on the extraction yield (temperature 45 °C), (b) effect of temperature and pH on the consistency coefficient (water‐powder ratio = 60:1), (c) effect of temperature and pH on L* parameter (water‐powder ratio = 60:1), (d) effect of water‐powder ratio and pH on the foam stability index (temperature = 45 °C), (e) effect of temperature and pH on the foam stability index (water‐powder ratio = 60:1), and (f) effect of temperature and water‐powder ratio on the emulsion stability index (pH = 7).
Increasing the W/P ratio from 40:1 to 60:1 decreased the extraction yield of MFG. A similar trend has been reported for yanang leave gum [28], with the highest yield at the lowest water:solid ratio. However, increasing the water:seed ratio to 80:1 increased the yield due to an increase in the driving force for the mass transfer of the mucilage [29].
The effect of temperature on the extraction yield was insignificant (p > 0.05), which was in agreement with Sepúlveda et al. [30] on the extraction of mucilage from Opuntia. On the other hand, temperature significantly affected the yield of yanang leaves [28] and E. sativa mucilage [16].
According to the above results, the optimum conditions for maximum yield (12.14%) of MFG are a temperature of 55 °C, pH of 7, and W/P ratio of 40:1. Comparing the extraction yield of MFG with that of other gums indicates a higher yield value for MFG than those from Durio zibethinus [31], flaxseed [32], E. sativa seed [16], cress seed [15], and yanang leaves [28].
16.2.3 Effect of Extraction Conditions on Consistency Coefficient
The consistency coefficient (k) of MFG was obtained by fitting the power‐law model to the shear stress versus shear rate data. The results indicated that the predicted model was significant (p < 0.01) (Table 16.1). The linear effect of pH and temperature and the quadratic effect of the W/P ratio were significant (p < 0.01) (Table 16.2), although there were no interaction effects among them. The equation below was developed in order to predict the consistency coefficient of MFG as a function of the applied extraction conditions:
The variations of the consistency coefficient with pH and temperature at a constant W/P ratio (60:1) are shown in Figure 16.2b. The values of the consistency index ranged from 1.08 to 9.69 Pa s n . Increasing pH had a negative impact on the k value, which was similar to those reported by Bostan et al. [11] and Razavi et al. [14] for sage seed gum and basil seed gum, respectively. However, Cui et al. [32] reported that the viscosity of flaxseed gum solution increased with increasing pH from acidic to neutral. In contrast, Medina‐Torres et al. [33] observed that the highest viscosity of Opuntia ficus‐indica was obtained at high pH.
Temperature had a significant effect on the consistency coefficient of MFG. With an increase in temperature from 25 to 65 °C, the consistency coefficient increased, probably because of an increase in mucilage solubility at high temperatures [4]. The maximum consistency coefficient (9.69 Pa s n ) was obtained at pH = 5, temperature 65 °C, and a W/P ratio of 40:1, which was lower than that of crude (17.46 Pa s n ) and purified (22.20 Pa s n ) basil seed gum, respectively, but higher than that of Qodume Shirazi (8.27 Pa s n ) and sage seed gum (4.455–9.435 Pa s n ) at optimal extraction conditions [ 11, 12, 14].
16.2.4 Effect of Extraction Conditions on L*
Statistical analysis showed that extraction conditions including pH (A, p < 0.01), temperature (B and B2, p < 0.05) and the W/P ratio (C, p < 0.01) (C2, p < 0.05) had significant effects on the L* parameter (Table 16.2). The predicted L* was calculated by the following equation:
The effects of extraction temperature and pH at a constant W/P ratio (60:1) on L* are shown in Figure 16.2c. It can be seen that when the pH increased from 5 to 9, L* increased considerably (88.92). A study on L. perfoliatum mucilage by Koocheki et al. [13] indicated that in acidic conditions and a higher water‐to‐seed ratio, the color of the gum was closer to yellow than at higher pH and lower water‐to‐seed ratio. The L* value of MFG was temperature dependent and decreased with an increase in temperature from 25 to 45 °C, although the higher temperature did not have a significant effect on the L* value. The lowest response for L* (77.42) was observed when the mucilage was extracted at the highest temperature of 65 °C, which might be due to the effect of high temperature on moving impurities out. Koocheki et al. [13] showed that the L. perfoliatum mucilage hue reduced with an increase in temperature. It was, however, contrary to the results found by Balke and Diosady [24], who reported that extracted mucilage at high temperature was highly colored. The MFG extracted at temperature 25 °C, pH 9 and water‐to‐powder ratio of 80:1 had the highest L* (88.92) among all the samples, which was similar to the value reported for Opuntia mucilage (88.9) by Sepúlveda et al. [30].
16.2.5 Effect of Extraction Condition on Foam Stability Index
Foam, a multi‐phase system consisting of a liquid or solid continuous phase, is utilized as raw material for the creation of new products [34]. Among other parameters, only temperature (B, p < 0.05) showed a significant linear effect on foam stability (Table 16.2). A quadratic effect of temperature was significant at less than the 5% level. Moreover, there were significant interactions between temperature and pH (AB, p < 0.01) as well as between pH and W/P ratio (AC, p < 0.01). The equation below was developed for the foaming stability index (FSI) prediction:
The stabilizing effect of MFG decreased with increase in the pH (A) and W/P ratio (C) (Figure 16.2d). However, an increase in foam stability was observed with an increase in temperature from 25 to 45 °C (Figure 16.2e), which might be due to the decrease in viscosity of the continuous phase [35]. The values of foam stability varied from 66.24% to 94.38%. An increase in foam stability was observed when the pH decreased from 9 to 5 at a temperature of 65 °C and W/P ratio of 40:1. Koocheki et al. [16] also pointed out that increasing temperature and pH reduced the foam stability of the E. sativa seed mucilage. The highest foam stability (94.38%) of MFG was obtained when the extraction temperature, pH, and water‐to‐powder ratio were 65 °C, 5, and 40 : 1, respectively, which was higher in comparison with E. sativa seed mucilage (87.5%) and quince seed mucilage (21.36%) at optimal conditions [ 13, 18].
16.2.6 Effect of Extraction Conditions on Emulsion Stability Index
As shown in Table 16.2, the linear and quadratic effects of pH (A, p < 0.05 and A2, p < 0.01) and the quadratic effects of both temperature (B2, p < 0.01) and the W/P ratio (C2, p < 0.01) on the ESI of MFG were significant. Moreover, among the interaction effects, only the mutual interaction between the extraction temperature and W/P ratio was significant (BC, p < 0.01). The following equation was developed for estimation of the ESI of the MFG:
The response surface plots showed an increase in the emulsion stability of the extracted mucilage with an increase in the W/P ratio (C) until 60:1, but decreased afterward. This trend was somehow similar to those observed for the consistency coefficient of MFG. It can be concluded that an increase in the consistency of the aqueous phase might be the result of limited movement of oil droplets in the emulsion. As seen in Figure 16.2f, the effect of the W/P ratio on ESI depended on temperature and increased with an increase in temperature from 25 to 45 °C, but afterward, a further increase in temperature reduced the emulsion stability. A similar trend for sage seed gum and E. sativa seed mucilage was reported by Bostan et al. [11] and Koocheki et al. [16], respectively. The highest ESI (86.86%) of MFG was obtained when the temperature, pH, and W/P ratio were 45 °C, 5 and 60:1, respectively, which was lower compared to the values for E. sativa seed gum (87.0%), L. perfoliatum seed gum (88.96%), and quince seed gum (94.89%) at optimal extraction conditions.
16.2.7 Optimization and Verification of Models
Optimal extraction conditions were selected based on the maximal yield, consistency coefficient, emulsion stability, foam stability, and L* values via a statistical analysis of RSM. The optimum conditions for the extraction of MFG were 80:1 W/P ratio, pH of 6.63 at 55 °C, under which the highest yield, k, ESI, FSI, and L* were obtained as 9.61%, 6.7 (Pa s n ), 82.69%, 84.64%, and 85.03, respectively. To verify the models, predictions were compared with experimental data at the optimum conditions. Comparing the independent means (t‐test, SPSS, Version: 16) indicated that the actual data and the results of the selected model did not show any significant difference at the level of 0.05. Therefore, the predicted values were validated adequately.
16.3 Chemical Compositions
The chemical compositions of MFG and several novel gums are shown in Table Table 16.3. It can be seen that the MFG sample, extracted under the optimum conditions, contains approximately 75.01% dry basis (d.b.) carbohydrate, 13.40% wet basis (w.b.) moisture, 8.58% protein (d.b.), 12.11% ash (d.b.), and 12.54% (d.b.) uronic acid. In addition, the metal ions in MFG are summarized in Table 16.4. It can be seen that total carbohydrate of MFG was almost similar to that of other gums, except A. bracteatum root gum, which had a much higher sugar content (84.30%) [17]. By comparison, the protein content in MFG was higher than that for basil seed gum (1.32%), A. bracteatum root gum (0.90%), sage seed gum (2.84%), quince seed mucilage (2.71%), and cress seed gum (2.45%). It was also found that MFG had the highest total ash content (12.11%) among the studied gums. This value was higher than those reported by Somboonpanyakul et al. [26] for Malva nut gum (8.4%), and by Sepúlveda et al. [30] for O. ficus‐indica (7.3%). In addition, MFG had a higher content of uronic acid (12.54%) than A. bracteatum root gum (10.30%) and basil seed gum (6.51%) [ 17,37].
Table 16.3 Chemical compositions of marshmallow flower gum (MFG) in comparison with some emerging hydrocolloids.
| Composition (% w/w) | MFG | BSG a | CSG b | ABRG c | SSG d | QSG e |
| Moisture | 13.43 ± 0.36 | 9.10 ± 0.17 | 7.17 | 13.20 ± 0.80 | 6.72 ± 0.00 | 8.86 ± 0.31 |
| Ash | 12.11 ± 1.68 | 6.53 ± 0.21 | 11.5 | 1.50 ± 0.20 | 8.17 ± 0.01 | 6.71 ± 0.46 |
| Protein | 8.58 ± 0.91 | 1.32 ± 0.09 | 2.45 | 0.90 ± 0.03 | 2.84 ± 0.01 | 2.71 ± 0.28 |
| Carbohydrate | 75.01 ± 0.24 | 79.63 ± 0.73 | 77.03 | 84.30 ± 1.00 | 79.75 ± 0.01 | 79.11 ± 3.17 |
a Basil (Ocimum basilicum L.) seed gum [36].
b Cress (Lepidium sativum) seed gum [15].
c Acanthophyllum bracteatum root gum [17].
Table 16.4 Quantitative value of metal ions of marshmallow flower gum (MFG).
| Elements | ppm |
| Calcium (Ca2+) | 262327 ± 0.72 |
| Sodium (Na+) | 3905.66 ± 0.22 |
| Magnesium (Mg2+) | 34436.4 ± 0.75 |
| Zinc (Zn2+) | 274.050 ± 1.04 |
| Potassium (K+) | 3721.65 ± 0.19 |
The weight‐average molecular mass of MFG was found to be 750 kDa, which was higher than those reported for Acacia senegal (160–300 kDa) and konjac mannan (300 kDa) [38] and lower than for basil seed gum (2320 kDa), xanthan (4200 kDa), Balangu seed gum (3650 kDa), and sage seed gum (1500 kDa) [ 37 39–41]. Sugar analysis of MFG confirmed the presence of arabinose (4.19%), rhamnose (12.42%), galactose (5.84%), glucose (6.15%), xylose (32.52%), mannose (10.83%), glucuronic acid (26.53%), and galacturonic acid (1.53%). Anderson and Grant [42] reported that gums with higher viscosity contain high proportions of fucose, xylose, galacturonic acid, and methoxyl groups and low proportions of arabinose and nitrogenous compounds. Comparatively, the galacturonic acid value of A. officinalis crude gum was lower than the xylose value. These results also are in agreement with Balaghi et al. [43], who reported that gum tragacanth samples with higher amounts of galacturonic acid and fructose and lower amounts of xylose and arabinose showed higher consistency coefficient values. The data from HPLC analysis showed that the major monosaccharide of A. officinalis crude gum was xylose, which is consistent with the finding of Singthong et al. [28]. Furthermore, the weight ratio of galacturonic acid to glucuronic acid in A. officinalis crude gum was about 1:17; however, it was different from that for most other gums such as Anogeissus latifolia gum [44], Prunus persica gum [45], and locust bean gum [46]. Differences observed in monosaccharide compositions may be related to the raw material used and discrepancies in the hydrolysis method applied [28].
16.4 FT‐IR
FT‐IR makes it possible to determine the structure, to solve the problems of identification of carbohydrates, to carry out quantitative functional analysis, to check their purity, and to investigate complexing and intermolecular interactions [47]. The spectral region of 1200–700 cm−1 is generally selected for gum analysis because it includes the carbohydrate region (1200–900 cm−1), and fingerprint region (900–700 cm−1) [48]. The infrared spectra of MFG are presented in Figure 16.3. It can be seen that there were several absorption bands that encompassed a broad peak observed at 3357 cm−1, which was attributed to the OH stretching vibration in the MFG structure. The spectra also showed another broad peak at 2925 and 2847 cm−1 assigned to CH2 symmetrical stretching vibrations. The MFG FT‐IR spectrum exhibited absorption at 1728 cm−1, which corresponds to the presence of CH3CO−. The absorption band at 1620 cm−1 is characteristic of the COO− asymmetric stretching vibration. Other peaks observed in the FT‐IR spectrum of the sample were assigned as 1425 cm−1 (stretching of carboxylate ion, COO−), 1376 cm−1 (COOH), 1318 cm−1 (OH bending vibration), 1256 and 1155 cm−1 (CO), and 1070 and 1039 cm−1 (CH2OCH2 stretching). The peaks at 903 and 780 cm−1 were attributed to the CO bond stretching, and the broad band at 637 cm−1 resulted from the presence of out‐of‐plane bending of NH amide [ 8 49–52].
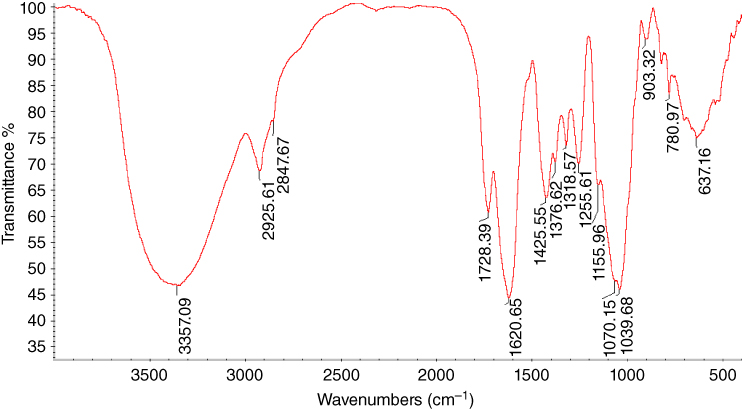
Figure 16.3 FT‐IR spectra of marshmallow flower gum (MFG).
16.5 Differential Scanning Calorimetry (DSC)
DSC was used to monitor thermal transitions and physicochemical changes of crude gum during thermal processing [53]. The DSC method exhibits different behaviors for each polysaccharide, which is due to different structural and functional groups [54]. The DSC thermogram of MFG showed two endothermic transitions at 85.06 and 239.51 °C as well as one small endothermic transition at 160.88 °C (Figure 16.4). The first transition can be attributed to moisture or bound‐water evaporation [55]. The onset temperature of the first transition occurred at 49.22 °C and the end set temperature at 135.97 °C with an enthalpy of fusion of 144.80 J g−1. The second endothermic event at 239.51 °C could be ascribed to the melting of MFG [ 55,56]. The onset temperature and end set temperatures were observed at 186.70 °C and 279.22 °C with an enthalpy of 337.2 J g−1, respectively. The exothermic transition due to decomposition of the sample must occur at temperatures of over 300 °C. This can be correlated with its complicated structure and the resistance of MFG during the thermal process that involves higher temperatures [55].
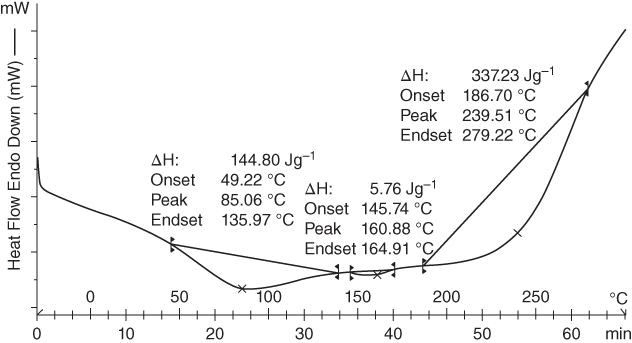
Figure 16.4 Differential scanning calorimetry (DSC) thermograms of marshmallow flower gum (MFG) in powdered form.
16.6 DPPH Radical‐Scavenging Activity
2,2‐Diphenyl‐1‐picrylhydrazyl (DPPH) radical‐scavenging activity can be expressed as the ability of a particular sample to scavenge the DPPH free radical [57]. The data indicated that the DPPH scavenging activity of MFG and vitamin C significantly increased (p < 0.05) with an increase in concentration, and as shown in Figure 16.5, the maximum inhibition at 1.2 mg ml−1 MFG and vitamin C were 25.82 ± 0.09% and 68.05 ± 0.2%, respectively. The antioxidant activity of the MFG polysaccharides may be attributed to high uronic acid content [58], molecular size, structure, and conformation [57]. Although the antioxidant activity of MFG was lower than that of vitamin C as the standard, the result suggests that gum extracted from marshmallow flowers can effectively scavenge DPPH.
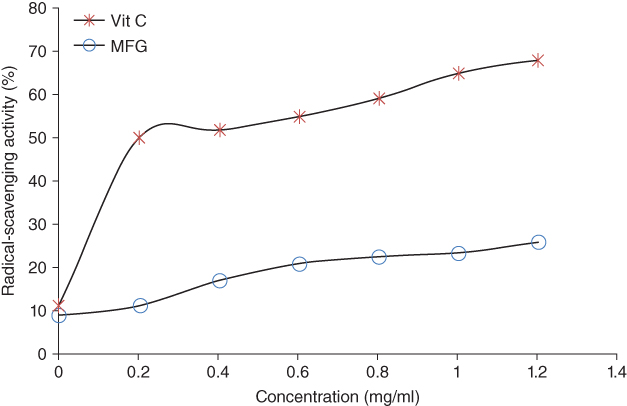
Figure 16.5 DPPH radical‐scavenging activity of marshmallow flower gum (MFG) in comparison with vitamin C (Vit. C).
16.7 Steady Shear Rheological Properties
16.7.1 Flow Behavior
The time‐independent rheological properties of MFG aqueous dispersions as a function of concentration (0.25%, 0.5%, 1.0%, and 2.0% [w/v]) and temperature (5, 25, 45, and 65 °C) were evaluated using the forward‐backward steady shear measurements in the shear rate range of 15–300 s−1. The power‐law model was used to fit the experimental shear stress‐shear rate of MFG solutions for both flow curves obtained by increasing (forward) and decreasing (backward) the shear rate. As shown in Table 16.5, the determination coefficients (R2) were close to unity, and the values of the root mean square error (RMSE) varied between 0.048 and 1.179, indicating that the power‐law model was satisfactorily verified to describe the flow behavior of the MFG dispersions under different conditions. The literature review also demonstrates that the flow behavior of many hydrocolloids was well described by the power‐law model [ 13, 20,59,60]. The power‐law model, because it has only two parameters, is a simple and extensively empirical model that provides a reasonable representation of many practical shear‐thinning fluids [61]. The rheological parameters of the power‐law model influenced by concentration and temperature are summarized in Table 16.5. The results show that the flow behavior index values are less than 0.50, indicating that all tested MFG dispersions were strongly shear‐thinning (pseudoplastic) fluids in the range of shear rate studied. The value of the flow behavior index, n, ranged from 0.19 to 0.49 for upward curves and varied between 0.17 and 0.50 for downward curves. The shear‐thinning phenomenon of gums is mainly related to the destruction of the dispersing molecules arranged along the streamline of flow [62] and breakdown of the hydrocolloid microstructure in solution under a shear field [23]. This behavior has been seen in many studied hydrocolloids [ 23, 28 63–68].
Table 16.5 Power‐law parameters for marshmallow (A. officinalis) flower gum (MFG) solutions at different concentrations and temperatures.
| Upward curve | Downward curve | ||||||||
| Concentration (%) | Temperature (°C) | k (Pa s n ) | n (−) | R2 | RMSE | k (Pa s n ) | n (−) | R2 | RMSE |
| 0.25 | |||||||||
| 5 | 0.35 ± 0.06 | 0.48 ± 0.04 | 0.995 | 0.086 | 0.31 ± 0.87 | 0.50 ± 0.16 | 0.994 | 0.096 | |
| 25 | 0.32 ± 0.41 | 0.48 ± 0.01 | 0.996 | 0.071 | 0.29 ± 0.37 | 0.50 ± 0.02 | 0.997 | 0.048 | |
| 45 | 0.25 ± 0.71 | 0.49 ± 0.19 | 0.996 | 0.063 | 0.22 ± 0.07 | 0.49 ± 0.06 | 0.996 | 0.053 | |
| 65 | 0.24 ± 0.06 | 0.45 ± 0.11 | 0.988 | 0.075 | 0.22 ± 0.19 | 0.47 ± 0.01 | 0.995 | 0.049 | |
| 0.50 | |||||||||
| 5 | 0.76 ± 0.04 | 0.44 ± 0.21 | 0.998 | 0.098 | 0.69 ± 0.84 | 0.45 ± 0.02 | 0.997 | 0.117 | |
| 25 | 0.69 ± 0.34 | 0.41 ± 0.17 | 0.984 | 0.191 | 0.68 ± 0.29 | 0.42 ± 0.01 | 0.992 | 0.139 | |
| 45 | 0.53 ± 0.38 | 0.42 ± 0.12 | 0.996 | 0.071 | 0.49 ± 0.52 | 0.43 ± 0.02 | 0.998 | 0.049 | |
| 65 | 0.50 ± 0.56 | 0.40 ± 0.03 | 0.996 | 0.067 | 0.45 ± 0.12 | 0.41 ± 0.02 | 0.994 | 0.102 | |
| 1.00 | |||||||||
| 5 | 3.50 ± 0.67 | 0.29 ± 0.09 | 0.996 | 0.175 | 3.14 ± 0.66 | 0.32 ± 0.05 | 0.996 | 0.228 | |
| 25 | 3.34 ± 0.19 | 0.30 ± 0.08 | 0.996 | 0.226 | 3.21 ± 0.28 | 0.31 ± 0.04 | 0.996 | 0.215 | |
| 45 | 2.44 ± 1.01 | 0.33 ± 0.03 | 0.996 | 0.196 | 2.29 ± 0.73 | 0.35 ± 0.03 | 0.997 | 0.180 | |
| 65 | 2.07 ± 0.37 | 0.32 ± 0.20 | 0.993 | 0.200 | 1.76 ± 0.32 | 0.35 ± 0.00 | 0.992 | 0.226 | |
| 2.00 | |||||||||
| 5 | 24.18 ± .091 | 0.21 ± 0.07 | 0.992 | 1.066 | 27.54 ± 0.49 | 0.18 ± 0.07 | 0.990 | 0.813 | |
| 25 | 23.62 ± 0.76 | 0.19 ± 0.30 | 0.990 | 0.835 | 23.50 ± 0.19 | 0.17 ± 0.00 | 0.975 | 1.179 | |
| 45 | 13.84 ± 0.43 | 0.19 ± 0.01 | 0.997 | 0.138 | 11.96 ± 0.64 | 0.18 ± 0.01 | 0.999 | 0.259 | |
| 65 | 13.18 ± 0.26 | 0.19 ± 0.02 | 0.984 | 0.692 | 12.89 ± 0.38 | 0.19 ± 0.02 | 0.989 | 0.656 | |
k, consistency coefficient; n, flow behavior index.
16.7.1.1 Effect of Concentration
The steady shear flow curve of MFG at different concentrations and constant temperature (25 °C) is shown in Figure 16.6. It can be seen that MFG exhibited remarkably pseudoplastic flow behavior at all concentrations. In addition, the apparent viscosity of MFG increased greatly as the concentration increased from 1.0% to 2.0%. The phenomenon of increased viscosity with increasing concentration is related to the increment entanglements of macromolecular chains [62]. Feng et al. [69] also found a noteworthy increase in the apparent viscosity when the Mesona Blumes gum concentration was 2%, which related this significant increase in apparent viscosity values to the highly branched structure in the gum. The results indicated that MFG might also have a highly branched structure. Moreover, an increase in hydrogen bonding with hydroxyl groups and the distortion in the velocity pattern affect the MFG viscosity by increasing the solid concentration [22]. Slight pseudoplastic behavior in the high‐shear‐rate region was seen when the MFG concentration was 1% or less. These results are in agreement with those observed for flaxseed gum [32] and acidic fraction flaxseed gum [70]. Dakia et al. [46] reported that the values of viscosity at low and high shear rates can simulate the consistency of foodstuffs in the mouth and the viscosity of the product during some processing operation, respectively.
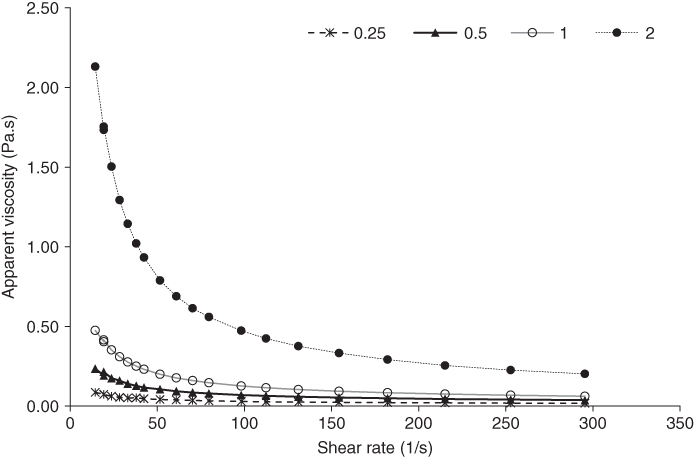
Figure 16.6 Effect of the concentration on the steady shear flow behavior of marshmallow (A. officinalis) flower gum.
As seen in Table 16.5, the consistency coefficient (k) of MFG dispersions at 25 °C increased from 0.32 to 23.62 Pa s n , when the concentration increased from 0.5% to 2%, whereas the flow behavior index (n) decreased from 0.48 to 0.19 under the same conditions. In comparison, under the same conditions (2%, 25 °C), the consistency coefficient of MFG is higher than those of L. sativum seed gum, A. homolocarpum seed gum, zedo gum, and Cordia myxa leaf gum, while the flow behavior index of MFG is lower than those of A. homolocarpum seed gum, zedo gum, and C. myxa leaf gum [ 13, 20, 23, 63]. On the other hand, the power‐law parameters of A. homolocarpum mucilage indicated a higher value of k and n compared with those of MFG [71]. Chaharlang and Samavati [20] reported that the flow behavior index changes with concentration are highly dependent on the molecular size.
16.7.1.2 Effect of Temperature
The flow behavior of MFG dispersions was investigated over the temperature range 5–60 °C. As seen in Table 16.5, the consistency coefficient of MFG decreased as the temperature rose at each concentration. This could be attributed to the greater kinetic motion of the molecules, which resulted in a weakening of the intra‐ and intermolecular attractions, thus lowering the resistance to flow as the temperature increased [ 23,72]. The viscosity–temperature dependence can be described by an Arrhenius‐type model. The result indicated that the activation energy (Ea) values of MFG increased from 5.396 kJ mol−1 at 0.25% concentration to 8.480 kJ mol−1 at 2% concentration. The activation energy (Ea) described the sensitivity of the apparent viscosity changes with temperature [69]. Therefore, as the MFG concentration increases, its viscosity sensitivity to the temperature increases. These phenomena are in agreement with the work done by Chaharlang and Samavati [20] on C. myxa leaf gum. The authors reported that an increase in the concentration of C. myxa leaf gum solution (0.5–2.5%) was accompanied by an increase in activation energy (5.972–18.104 kJ mol−1). In addition, a study on O. ficus‐indica mucilage by Medina‐Torres et al. [33] also demonstrated that higher values of Ea (1.32 kcal mol−1) were observed at the highest concentration studied (10%). The authors concluded that a higher Ea value indicates a more rapid change in viscosity with temperature. Razavi et al. [73] also studied the concentration effect on the activation energy values of wild sage seed gum and observed that Ea increased from 3.949 kJ mol−1 at 0.5% concentration and shear rate 100 s−1 to 16.384 kJ mol−1 at 1.0%. In contrast, Balaghi et al. [43], Bae et al. [74], Karazhiyan et al. [23], Koocheki et al. [ 13, 71], and Wu et al. [68] reported the activation energy of the studied gums decreased as the concentration increased. The results above suggest that as MFG is used at a high concentration in food processing, temperature control is critical for achieving stable viscosity.
16.7.1.3 Effect of pH
The rheological properties of MFG dispersion (0.5%) at different pH levels is presented in Figure 16.7. It can be seen that the apparent viscosity of MFG is highly pH dependent, and it decreases as the pH becomes alkaline or acidic. The highest apparent viscosity was observed at neutral pH, while the lowest value was obtained at pH 11. The power‐law parameters of MFG showed that the consistency coefficient (k), like the apparent viscosity, decreased considerably at pH levels of 5, 9, and 11, with the highest value being obtained at pH 7 (Figure 16.8). In addition, there was no specific change in the flow behavior index with pH. The sudden increase in the consistency coefficient at pH 7 is probably due to a change in conformation of the molecular chains [69]. At neutral pH, the MFG coils expand because of charge repulsion, causing the viscosity to increase [69]. Our experimental data thus provide evidence that the chain rigidity of the MFG molecule is enhanced at pH 7. On the other hand, the sharp reduction in viscosity with increasing/decreasing pH means that the increase in the ionization degree of carboxyl groups was adverse to viscosity [75]. In comparison with other natural gums, A. homolocarpum seed gum, similar to MFG, shows a strong pH dependence of the apparent viscosity, which is related to the ionization of the carboxyl groups above pH 7.0 [13]. Medina‐Torres et al. [33] also studied the effect of pH on the apparent viscosity in O. ficus‐indica and concluded that it increases with an increase in pH. Koocheki et al. [71] reported that the viscosity of L. perfoliatum seed gum increased as the pH changed from acidic to alkaline conditions until a pH of 9 and afterward decreased. However, the viscosity of Colocasia esculenta gum dispersion was not sensitive to changes in either pH or ionic strength [76].
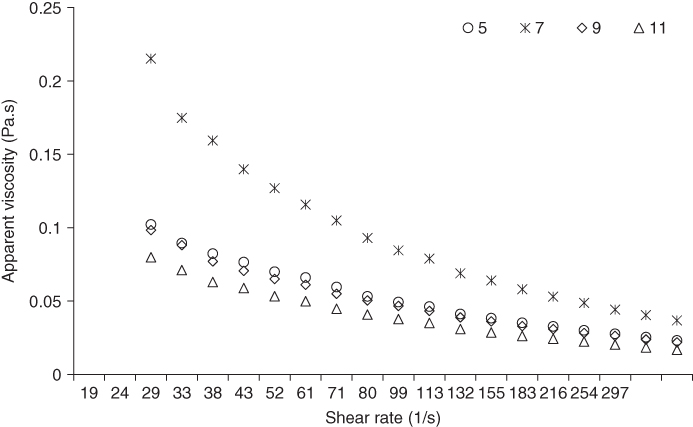
Figure 16.7 Effect of different pHs on the apparent viscosity of marshmallow (A. officinalis) flower gum at 25 °C.
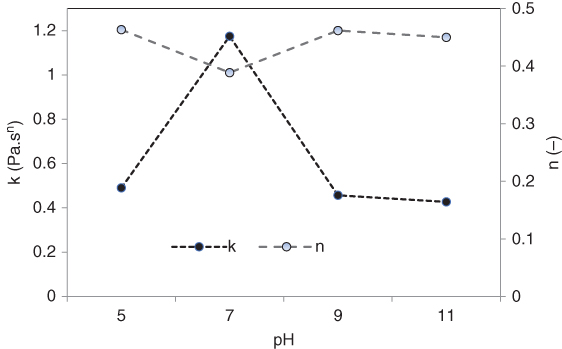
Figure 16.8 Effect of the pH type on consistency coefficient (k) and flow behavior index (n) of marshmallow (A. officinalis) flower gum.
16.7.2 Thixotropy
The time‐dependent rheological properties of MFG dispersions were evaluated by increasing (loading) and decreasing (unloading) shear measurements [77]. The area enclosed between the forward and backward curves, namely, the hysteresis loop area, may be considered as an estimation of the degree of thixotropy or as the extent of the time dependency [78]. The thixotropic behavior of the product is connected to changes occurring in the inner structure of the fluid [21]. It can be concluded from Table 16.5, that the consistency coefficients of MFG of the upward curve at different temperatures and concentrations are slightly higher than those obtained for the downward curve, indicating that all MFG dispersions exhibited a weak thixotropic behavior and the viscosity can be recovered their original viscosity when the shear rate decreases. In addition, the thixotropy extent is independent of the level of concentration or temperature used. This result is in agreement with the research of Hosseini‐Parvar et al. [36], who observed similar weak thixotropic behavior for O. basilicum L. seed gum. In contrast, carboxymethyl cellulose (CMC), Salvia hispanica L. mucilage, L. sativum seed gum, A. homolocarpum seed gum, wild terrestrial orchids, and Lallemantia royleana seed gum exhibited strong thixotropic behavior, especially at the highest concentrations [ 21, 23, 60, 77,79].
16.8 Intrinsic Viscosity
The intrinsic viscosity or limiting viscosity number, denoted as [η], is a parameter indicating the hydrodynamic volume occupied by the polymer [80]. Also, it is directly related to the macromolecules' capability to disturb flow and indirectly related to their size and shape [22]. Therefore, it provides deep insight into the fundamental molecular properties of macromolecules in solution [39]. The intrinsic viscosity is determined experimentally from measurements of the viscosity at very low concentrations or in the dilute solution domain [81]. There are some nonlinear (Tanglertpaibul–Rao and Higiro) and linear (Huggins and Kraemer) equations to determine the intrinsic viscosity [82]. The intrinsic viscosity values of MFG calculated by five models at different temperatures (25, 45, and 65 °C) are shown in Table 16.6. The outcome indicates that the Tanglertpaibul–Rao model was best for estimating the intrinsic viscosity which had the highest R 2 and lowest RMSE values. This model was also recommended for estimation the intrinsic viscosity of sage seed gum [41] at different temperatures (20, 30, and 40 °C) as well as for xanthan and locust bean gum at 20 °C [81] and cress seed gum at 25 °C [83]. The intrinsic viscosity of MFG was 22.29 dl gr−1, and it decreased greatly as the temperature increased from 25 to 65 °C. A similar result was observed by Mohammad Amini and Razavi [39], who reported that the intrinsic viscosity of Balangu seed gum decreased when the temperature increased from 20 to 50 °C. However, contrary results were found by Ehrlich et al. [84], who observed that the intrinsic viscosity of levan produced by Streptococcus salivarius increased with an increase in temperature. A number of studies have been extensively performed to quantify the intrinsic viscosity of a broad range of new hydrocolloids, such as fenugreek gum [85], Mucuna flagellipes seed gum [86], Caesalpinia ferrea [83], peach gum [ 45, 80], flaxseed gum [70], Balangu seed gum [39], sage seed gum [41], tamarind seed gum [65], mesquite seeds [49], cress seed gum [87], Prosopis juliflora seed gum [88], Sage seed gum [82], and Prosopis ruscifolia [59].
Table 16.6 Intrinsic viscosity ([η], dl gr−1) of marshmallow (A. officinalis) flower gum (MFG) estimated by five models at different temperatures.
| Tanglertpaibul–Rao | Huggins | Kraemer | Higiro (1) | Higiro (2) | |||||||||||
| Temperature (°C) | [η] | R2 | RMSE | [η] | R2 | RMSE | [η] | R2 | RMSE | [η] | R2 | RMSE | [η] | R2 | RMSE |
| 25 | 22.29 | 0.94 | 0.05 | 25.07 | 0.16 | 0.58 | 22.59 | 0.86 | 0.56 | 15.87 | 0.88 | 0.04 | 37.63 | 0.83 | 0.12 |
| 45 | 23.21 | 0.96 | 0.04 | 22.81 | 0.32 | 0.25 | 20.85 | 0.98 | 0.15 | 16.73 | 0.84 | 0.05 | 35.69 | 0.91 | 0.08 |
| 65 | 10.88 | 0.98 | 0.02 | 1.00 | 0.98 | 0.28 | 2.54 | 0.92 | 0.15 | 8.62 | 0.90 | 0.04 | 17.85 | 0.88 | 0.9 |
The effect of varying the pH on the intrinsic viscosity of MFG is shown in Table 16.7. In can be seen that, similar to the temperature result, the Tanglertpaibul–Rao model is best for calculating the intrinsic viscosity at different pH levels (5, 7, and 9). The results also show that at neutral pH (pH 7), the intrinsic viscosity of MFG was highest (21.84 dl g−1), but it decreased in acidic (pH 5) and alkaline (pH 9) conditions to 21.84 and 15.24 dl g−1, respectively. Trachtenberg and Mayer [89] observed that the intrinsic viscosity of Opuntia ficus mucilage increased with increasing pH.
Table 16.7 Intrinsic viscosity ([η], dl gr−1) of marshmallow (A. officinalis) flower gum (MFG) estimated by five models at different pH levels.
| Tanglertpaibul–Rao | Huggins | Kraemer | Higiro (1) | Higiro (2) | |||||||||||
| pH | [η] | R2 | RMSE | [η] | R2 | RMSE | [η] | R2 | RMSE | [η] | R2 | RMSE | [η] | R2 | RMSE |
| 5 | 21.84 | 0.99 | 0.01 | 20.39 | 0.48 | 0.46 | 11.52 | 0.91 | 0.59 | 16.84 | 0.90 | 0.02 | 23.66 | 0.98 | 0.03 |
| 7 | 23.01 | 0.95 | 0.05 | 24.89 | 0.37 | 0.66 | 23.13 | 0.87 | 0.43 | 16.27 | 0.90 | 0.02 | 35.92 | 0.87 | 0.12 |
| 9 | 15.24 | 0.91 | 0.01 | 15.36 | 0.68 | 0.38 | 17.18 | 0.90 | 0.37 | 11.15 | 0.95 | 0.02 | 35.12 | 0.89 | 0.05 |
16.9 Conclusions and Future Trends
The numerical optimized extraction conditions of the gum from marshmallow (A. officinalis) flower were identified as 80:1 v/w W/P ratio, 55 °C, and pH 6.63. The results showed that an increase in the extraction temperature resulted in a higher consistency coefficient and a lower L * value, emulsion stability, and foam stability. On the other hand, increasing the extraction pH increased the L * and reduced the consistency coefficient of MFG. The quadratic effect of the water‐to‐powder ratio was significant for all response variables except foam stability. The major constituent monosaccharide of A. officinalis flower gum is xylose, together with substantial amounts of glucuronic acid, mannose, rhamnose, arabinose, galactose, glucose, and with traces of galacturonic acid. The FT‐IR spectra revealed that MFG has carboxylic and acetyl groups and also NH amide bonds. From this study, the antioxidant activity of MFG showed that it has the interesting characteristic of scavenging DPPH. Besides, the thermal profile of MFG is endothermic. The influence of concentration (0.25, 0.5, 1.0, and 2.0% w/w), temperature (5, 25, 45, and 65 °C), and pH (5, 7, 9, and 11) on the steady shear rheological properties of MFG showed that all tested samples exhibited non‐Newtonian shear‐thinning behavior, which is a flow behavior that fits the power‐law model well. It was found that the consistency coefficient had the highest value at pH 7.0, while it had the lowest value in acidic and alkaline conditions. The consistency coefficient of MFG dispersions decreased with increasing temperature at any concentration and increased with concentration at each temperature. The effect of temperature on the MFG viscosity was well described by the Arrhenius‐type model. Also, it was observed that the Tanglertpaibul–Rao model was best for estimating [η] at all selected temperatures. According to the information presented in this chapter, MFG, as a new source of hydrocolloid, has interesting functional properties that enable it to be used as a natural thickener, stabilizer, and antioxidant agent with high thermal tolerance for application in the food and pharmaceutical industries. However, further studies are required to characterize other functional properties and strengthen the potential of marshmallow (A. officinalis) flower polysaccharides as a novel alternative to commercial hydrocolloids in food formulations.
References
- 1 Deters, A., Zippel, J., Hellenbrand, N. et al. (2010). Aqueous extracts and polysaccharides from Marshmallow roots (Althea officinalis L.): cellular internalisation and stimulation of cell physiology of human epithelial cells in vitro. Journal of Ethnopharmacology 127: 62–69.
- 2 Ozturk, S. and Ercisli, S. (2007). Antibacterial activity of aqueous and methanol extracts of Althaea officinalis and Althaea cannabina from Turkey. Pharmaceutical Biology 45: 235–240.
- 3 Drake, P.M., de Moraes Madeira, L., Szeto, T.H., and Ma, J.K. (2013). Transformation of Althaea officinalis L. by Agrobacterium rhizogenes for the production of transgenic roots expressing the anti‐HIV microbicide cyanovirin‐N. Transgenic Research 22: 1225–1229.
- 4 Aghaabbasi, K., Dehghan, E., Baghizadeh, A., and Dashti, H. (2014). Comparing the effect of ethanol extracts of Descurainia sophia (L.) seed and Althaea officinalis root on Streptococcus pyogenes. Zahedan Journal of Research in Medical Sciences 16: 27–32.
- 5 Blumenthal, M., Goldberg, A., and Brinckmann, J. (2000). Herbal Medicine. Expanded Commission E Monographs. Integrative Medicine Communications.
- 6 Wichtl, M. (2004). Herbal Drugs and Phytopharmaceuticals: A Handbook for Practice on a Scientific Basis, 3e. Boca Raton: CRC Press.
- 7 Hage‐Sleiman, R., Mroueh, M., and Daher, C.F. (2011). Pharmacological evaluation of aqueous extract of Althaea officinalis flower grown in Lebanon. Pharmaceutical Biology 49: 327–333.
- 8 Naqvi, S.A., Khan, M., Shahid, M. et al. (2011). Biochemical profiling of mucilage extracted from seeds of different citrus rootstocks. Carbohydrate Polymers 83: 623–628.
- 9 Al‐Snafi, A.E. (2013). The pharmaceutical importance of Althaea officinalis and Althaea rosea: a review. International Journal of PharmTech Research 5: 1378–1385.
- 10 Prajapati, V.D., Jani, G.K., Moradiya, N.G., and Randeria, N.P. (2013). Pharmaceutical applications of various natural gums, mucilages and their modified forms. Carbohydrate Polymers 92: 1685–1699.
- 11 Bostan, A., Razavi, S.M., and Farhoosh, R. (2010). Optimization of hydrocolloid extraction from wild sage seed (Salvia macrosiphon) using response surface. International Journal of Food Properties 13: 1380–1392.
- 12 Koocheki, A., Mortazavi, S.A., Shahidi, F. et al. (2010). Optimization of mucilage extraction from Qodume Shirazi seed (Alyssum homolocarpum) using response surface methodology. Journal of Food Process Engineering 33: 861–882.
- 13 Koocheki, A., Mortazavi, S.A., Shahidi, F. et al. (2009). Rheological properties of mucilage extracted from Alyssum homolocarpum seed as a new source of thickening agent. Journal of Food Engineering 91 (3): 490–496. https://doi.org/10.1016/j.jfoodeng.2008.09.028.
- 14 Razavi, S., Mortazavi, S.A., Matia‐Merino, L. et al. (2009). Optimisation study of gum extraction from Basil seeds (Ocimum basilicum L.). International Journal of Food Science & Technology 44: 1755–1762.
- 15 Karazhiyan, H., Razavi, S., and Phillips, G.O. (2011a). Extraction optimization of a hydrocolloid extract from cress seed (Lepidium sativum) using response surface methodology. Food Hydrocolloids 25: 915–920.
- 16 Koocheki, A., Razavi, S.M., and Hesarinejad, M.A. (2012). Effect of extraction procedures on functional properties of Eruca sativa seed mucilage. Food Biophysics 7: 84–92.
- 17 Jahanbin, K., Moini, S., Gohari, A.R. et al. (2012). Isolation, purification and characterization of a new gum from Acanthophyllum bracteatum roots. Food Hydrocolloids 27: 14–21.
- 18 Jouki, M., Mortazavi, S.A., Yazdi, F.T., and Koocheki, A. (2014). Optimization of extraction, antioxidant activity and functional properties of quince seed mucilage by RSM. International Journal of Biological Macromolecules 66: 113–124.
- 19 Chaubey, M. and Kapoor, V.P. (2001). Structure of a galactomannan from the seeds of Cassia angustifolia Vahl. Carbohydrate Research 332: 439–444.
- 20 Chaharlang, M. and Samavati, V. (2015). Steady shear flow properties of Cordia myxa leaf gum as a function of concentration and temperature. International Journal of Biological Macromolecules 79: 56–62.
- 21 Wei, Y., Lin, Y., Xie, R. et al. (2015). The flow behavior, thixotropy and dynamical viscoelasticity of fenugreek gum. Journal of Food Engineering 166: 21–28.
- 22 Toğrul, H. and Arslan, N. (2003). Flow properties of sugar beet pulp cellulose and intrinsic viscosity–molecular weight relationship. Carbohydrate Polymers 54 (1): 63–71.
- 23 Karazhiyan, H., Razavi, S.M., Phillips, G.O. et al. (2009). Rheological properties of Lepidium sativum seed extract as a function of concentration, temperature and time. Food Hydrocolloids 23 (8): 2062–2068.
- 24 Balke, D.T. and Diosady, L.L. (2000). Rapid aqueous extraction of mucilage from whole white mustard seed. Food Research International 33: 347–356.
- 25 Estévez, A.M., Saenz, C., Hurtado, M.L. et al. (2004). Extraction methods and some physical properties of mesquite (Prosopis chilensis (Mol) Stuntz) seed gum. Journal of the Science of Food and Agriculture 84: 1487–1492.
- 26 Somboonpanyakul, P., Wang, Q., Cui, W. et al. (2006). Malva nut gum. (Part I): extraction and physicochemical characterization. Carbohydrate Polymers 64: 247–253.
- 27 Furuta, H., Takahashi, T., Tobe, J. et al. (1998). Extraction of water‐soluble soybean polysaccharides under acidic conditions. Bioscience, Biotechnology and Biochemistry 62: 2300–2305.
- 28 Singthong, J., Ningsanond, S., and Cui, S.W. (2009). Extraction and physicochemical characterisation of polysaccharide gum from Yanang (Tiliacora triandra) leaves. Food Chemistry 114 (4): 1301–1307.
- 29 Bendahou, A., Dufresne, A., Kaddami, H., and Habibi, Y. (2007). Isolation and structural characterization of hemicelluloses from palm of Phoenix dactylifera L. Carbohydrate Polymers 68: 601–608.
- 30 Sepúlveda, E., Sáenz, C., Aliaga, E., and Aceituno, C. (2007). Extraction and characterization of mucilage in Opuntia spp. Journal of Arid Environments 68: 534–545.
- 31 Amin, A.M., Ahmad, A.S., Yin, Y.Y. et al. (2007). Extraction, purification and characterization of durian (Durio zibethinus) seed gum. Food Hydrocolloids 21: 273–279.
- 32 Cui, W., Mazza, G., Oomah, B., and Biliaderis, C. (1994). Optimization of an aqueous extraction process for flaxseed gum by response surface methodology. LWT‐Food Science and Technology 27: 363–369.
- 33 Medina‐Torres, L., Brito‐De La Fuente, E., Torrestiana‐Sanchez, B., and Katthain, R. (2000). Rheological properties of the mucilage gum (Opuntia ficus indica). Food Hydrocolloids 14: 417–424.
- 34 Żmudziński, D., Ptaszek, P., Kruk, J. et al. (2014). The role of hydrocolloids in mechanical properties of fresh foams based on egg white proteins. Journal of Food Engineering 121: 128–134.
- 35 Hailing, P.J. and Walstra, P. (1981). Protein‐stabilized foams and emulsions. Critical Reviews in Food Science & Nutrition 15: 155–203.
- 36 Hosseini‐Parvar, S., Matia‐Merino, L., Goh, K. et al. (2010). Steady shear flow behavior of gum extracted from Ocimum basilicum L. seed: effect of concentration and temperature. Journal of Food Engineering 101: 236–243.
- 37 Naji‐Tabasi, S., Razavi, S.M.A., Mohebbi, M., and Malaekeh‐Nikouei, B. (2016). New studies on basil (Ocimum bacilicum L.) seed gum: part I–fractionation, physicochemical and surface activity characterization. Food Hydrocolloids 52: 350–358.
- 38 Harding, S.E. and Adams, G.G. (2002). Some bacterial and synthetic polysaccharides. In: An Introduction to Polysaccharide Biotechnology (ed. M. Tombs and S.E. Harding), 164–165. Boca Raton: CRC Press.
- 39 Mohammad Amini, A. and Razavi, S.M. (2012). Dilute solution properties of Balangu (Lallemantia royleana) seed gum: effect of temperature, salt, and sugar. International Journal of Biological Macromolecules 51: 235–243.
- 40 Faria, S., de Oliveira Petkowicz, C.L., de Morais, S.A.L. et al. (2011). Characterization of xanthan gum produced from sugar cane broth. Carbohydrate Polymers 86: 469–476.
- 41 Razavi, S.M., Moghaddam, T.M., Emadzadeh, B., and Salehi, F. (2012). Dilute solution properties of wild sage (Salvia macrosiphon) seed gum. Food Hydrocolloids 29: 205–210.
- 42 Anderson, D.M.W. and Grant, D.A.D. (1988). The chemical characterization of some Astragalus gum exudates. Food Hydrocolloids 2: 417–423.
- 43 Balaghi, S., Mohammadifar, M.A., Zargaraan, A. et al. (2011). Compositional analysis and rheological characterization of gum tragacanth exudates from six species of Iranian Astragalus. Food Hydrocolloids 25: 1775–1784.
- 44 Kang, J., Cui, S.W., Chen, J. et al. (2011). New studies on gum ghatti (Anogeissus latifolia) part I. Fractionation, chemical and physical characterization of the gum. Food Hydrocolloids 25: 1984–1990.
- 45 Simas‐Tosin, F.F., Barraza, R.R., Petkowicz, C.L.O. et al. (2010). Rheological and structural characteristics of peach tree gum exudate. Food Hydrocolloids 24: 486–493.
- 46 Dakia, P.A., Blecker, C., Robert, C. et al. (2008). Composition and physicochemical properties of locust bean gum extracted from whole seeds by acid or water dehulling pre‐treatment. Food Hydrocolloids 22: 807–818.
- 47 Filippov, M. (1992). Practical infrared spectroscopy of pectic substances. Food Hydrocolloids 6: 115–142.
- 48 Prado, B.M., Kim, S., Özen, B.F., and Mauer, L.J. (2005). Differentiation of carbohydrate gums and mixtures using Fourier transform infrared spectroscopy and chemometrics. Journal of Agricultural and Food Chemistry 53: 2823–2829.
- 49 López‐Franco, Y.L., Cervantes‐Montaño, C.I., Martínez‐Robinson, K.G. et al. (2013). Physicochemical characterization and functional properties of galactomannans from mesquite seeds (Prosopis spp.). Food Hydrocolloids 30 (2): 656–660.
- 50 Srichamroen, A. and Chavasit, V. (2011). Rheological properties of extracted Malva nut gum (Scaphium scaphigerum) in different conditions of solvent. Food Hydrocolloids 25: 444–450.
- 51 Vinod, V., Sashidhar, R., Suresh, K. et al. (2008). Morphological, physico‐chemical and structural characterization of gum kondagogu (Cochlospermum gossypium): a tree gum from India. Food Hydrocolloids 22: 899–915.
- 52 Gong, H., Liu, M., Chen, J. et al. (2012). Synthesis and characterization of carboxymethyl guar gum and rheological properties of its solutions. Carbohydrate Polymers 88: 1015–1022.
- 53 Singh, S. and Bothara, S.B. (2014). Physico‐chemical and structural characterization of mucilage isolated from seeds of Diospyros melonoxylon Roxb. Brazilian Journal of Pharmaceutical Sciences 50: 713–725.
- 54 Zohuriaan, M. and Shokrolahi, F. (2004). Thermal studies on natural and modified gums. Polymer Testing 23: 575–579.
- 55 Kamboj, S. and Rana, V. (2014). Physicochemical, rheological and antioxidant potential of corn fiber gum. Food Hydrocolloids 39: 1–9.
- 56 Bothara, S.B. and Singh, S. (2012). Thermal studies on natural polysaccharide. Asian Pacific Journal of Tropical Biomedicine 2: S1031–S1035.
- 57 Chen, R., Liu, Z., Zhao, J. et al. (2011). Antioxidant and immunobiological activity of water‐soluble polysaccharide fractions purified from Acanthopanax senticosu. Food Chemistry 127: 434–440.
- 58 Chen, H., Zhang, M., and Xie, B. (2004). Quantification of uronic acids in tea polysaccharide conjugates and their antioxidant properties. Journal of Agricultural and Food Chemistry 52: 3333–3336.
- 59 Busch, V.M., Kolender, A.A., Santagapita, P.R., and Buera, M.P. (2015). Vinal gum, a galactomannan from Prosopis ruscifolia seeds: physicochemical characterization. Food Hydrocolloids 51: 495–502.
- 60 Capitani, M., Corzo‐Rios, L.J., Chel‐Guerrero, L. et al. (2015). Rheological properties of aqueous dispersions of chia (Salvia hispanica L.) mucilage. Journal of Food Engineering 149: 70–77.
- 61 Gratao, A., Silveira, V., and Telis‐Romero, J. (2007). Laminar flow of soursop juice through concentric annuli: friction factors and rheology. Journal of Food Engineering 78 (4): 1343–1354.
- 62 Xu, L., Xu, G., Liu, T. et al. (2013). The comparison of rheological properties of aqueous welan gum and xanthan gum solutions. Carbohydrate Polymers 92 (1): 516–522.
- 63 Fadavi, G., Mohammadifar, M.A., Zargarran, A. et al. (2014). Composition and physicochemical properties of Zedo gum exudates from Amygdalus scoparia. Carbohydrate Polymers 101: 1074–1080.
- 64 Haddarah, A., Bassal, A., Ismail, A. et al. (2014). The structural characteristics and rheological properties of Lebanese locust bean gum. Journal of Food Engineering 120: 204–214.
- 65 Khounvilay, K. and Sittikijyothin, W. (2012). Rheological behaviour of tamarind seed gum in aqueous solutions. Food Hydrocolloids 26 (2): 334–338.
- 66 Oh, M.‐H., So, J.‐H., and Yang, S.‐M. (1999). Rheological evidence for the silica‐mediated gelation of xanthan gum. Journal of Colloid and Interface Science 216 (2): 320–328.
- 67 Sibaja‐Hernández, R., Román‐Guerrero, A., Sepúlveda‐Jiménez, G., and Rodríguez‐Monroy, M. (2015). Physicochemical, shear flow behaviour and emulsifying properties of Acaciacochliacantha and Acaciafarnesiana gums. Industrial Crops and Products 67: 161–168.
- 68 Wu, Y., Ding, W., Jia, L., and He, Q. (2015). The rheological properties of tara gum (Caesalpinia spinosa). Food Chemistry 168: 366–371.
- 69 Feng, T., Gu, Z., and Jin, Z. (2007). Chemical composition and some rheological properties of Mesona Blumes gum. Food Science and Technology International 13 (1): 55–61.
- 70 Qian, K., Cui, S., Wu, Y., and Goff, H. (2012). Flaxseed gum from flaxseed hulls: extraction, fractionation, and characterization. Food Hydrocolloids 28 (2): 275–283.
- 71 Koocheki, A., Taherian, A.R., and Bostan, A. (2013). Studies on the steady shear flow behavior and functional properties of Lepidium perfoliatum seed gum. Food Research International 50 (1): 446–456.
- 72 Nwokocha, L.M. and Williams, P.A. (2012). Rheological characterization of the galactomannan from Leucaena leucocephala seed. Carbohydrate Polymers 90 (2): 833–838.
- 73 Razavi, S.M.A., Taheri, H., and Quinchia, L.A. (2011). Steady shear flow properties of wild sage (Salvia macrosiphon) seed gum as a function of concentration and temperature. Food Hydrocolloids 25 (3): 451–458.
- 74 Bae, I.Y., Oh, I.‐K., Lee, S. et al. (2008). Rheological characterization of levan polysaccharides from Microbacterium laevaniformans. International Journal of Biological Macromolecules 42 (1): 10–13.
- 75 Wang, S., He, L., Guo, J. et al. (2015). Intrinsic viscosity and rheological properties of natural and substituted guar gums in seawater. International Journal of Biological Macromolecules 76: 262–268.
- 76 Lin, H. and Huang, A.S. (1993). Chemical composition and some physical properties of a water‐soluble gum in taro (Colocasia esculenta). Food Chemistry 48 (4): 403–409.
- 77 Benchabane, A. and Bekkour, K. (2008). Rheological properties of carboxymethyl cellulose (CMC) solutions. Colloid and Polymer Science 286 (10): 1173–1180.
- 78 Koocheki, A. and Razavi, S.M. (2009). Effect of concentration and temperature on flow properties of Alyssum homolocarpum seed gum solutions: assessment of time dependency and thixotropy. Food Biophysics 4 (4): 353–364.
- 79 Razavi, S.M. and Karazhiyan, H. (2009). Flow properties and thixotropy of selected hydrocolloids: experimental and modeling studies. Food Hydrocolloids 23 (3): 908–912.
- 80 Qian, H.F., Cui, S.W., Wang, Q. et al. (2011). Fractionation and physicochemical characterization of peach gum polysaccharides. Food Hydrocolloids 25 (5): 1285–1290.
- 81 Higiro, J., Herald, T., Alavi, S., and Bean, S. (2007). Rheological study of xanthan and locust bean gum interaction in dilute solution: effect of salt. Food Research International 40 (4): 435–447.
- 82 Yousefi, A., Razavi, S.M., and Aghdam, S.K. (2014). Influence of temperature, mono‐and divalent cations on dilute solution properties of sage seed gum. International Journal of Biological Macromolecules 67: 246–253.
- 83 de Souza, C.F., Lucyszyn, N., Ferraz, F.A., and Sierakowski, M.R. (2010). Caesalpinia ferrea var. ferrea seeds as a new source of partially substituted galactomannan. Carbohydrate Polymers 82 (3): 641–647.
- 84 Ehrlich, J., Stivala, S.S., Bahary, W.S. et al. (1975). Levans: I. Fractionation, solution viscosity, and chemical analysis of levan produced by Streptococcus salivarius. Journal of Dental Research 54 (2): 290–297.
- 85 Brummer, Y., Cui, W., and Wang, Q. (2003). Extraction, purification and physicochemical characterization of fenugreek gum. Food Hydrocolloids 17 (3): 229–236.
- 86 Nwokocha, L.M. and Williams, P.A. (2009). Isolation and rheological characterization of Mucuna flagellipes seed gum. Food Hydrocolloids 23 (5): 1394–1397.
- 87 Behrouzian, F., Razavi, S.M., and Karazhiyan, H. (2014). Intrinsic viscosity of cress (Lepidium sativum) seed gum: effect of salts and sugars. Food Hydrocolloids 35: 100–105.
- 88 Rincón, F., Muñoz, J., Ramírez, P. et al. (2014). Physicochemical and rheological characterization of Prosopis juliflora seed gum aqueous dispersions. Food Hydrocolloids 35 (0): 348–357.
- 89 Trachtenberg, S. and Mayer, A.M. (1980). Biophysical properties of Opuntia ficus‐indica mucilage. Phytochemistry 21 (12): 2835–2843.