CHAPTER 2
Going Solo (1991–2002)
1991–1998: I START INVESTING. BULL MARKET
Meanwhile, movements were afoot at Bestinver. Over the course of 1990, our diversification arm began to lose steam and at the start of 1991 the team in charge, led by José Ignacio Benjumea, upped sticks to set up a private equity project funded by the Rockefeller Foundation. Jorge Mataix and Luis Gabarda stayed behind as co-director generals. Santos Martínez-Conde, the head of analysis and portfolio management, also went with them. I mustered the nerve to ask the two co-directors whether I could take over responsibility for managing the Bestinver portfolios.
I felt I was capable of rising to the challenge, after having spent a year studying the Spanish stock market and analysing nearly all the key sectors. Luckily, there was not a lot of money to manage, which meant it wasn't completely preposterous for me to take on the responsibility – some two or three million euros, if memory serves me. If the amount had been larger it would have been unthinkable for them to entrust me with this responsibility; I was only 27 years old, with just a year of experience under my belt.
Despite some reluctance on the part of José María Entrecanales, who saw a certain ‘wetness behind the ears’, they conceded and I started life as an asset manager in 1991.
That same year we launched our first fund, Tibestfond. It was a cash fund that never amounted to much and later became Bestinver Renta, offering a decent alternative service to liquidity. We managed equities via mandates or private investment portfolios. At the start, it was just a handful of portfolios and next to no money, attracting no public attention.
1993–1994: UP AND DOWN (OR UP AND AWAY...)
At the end of 1992, we launched Bestinfond, which in time went on to offer one of the highest returns in Europe. Initially, it was a family fund, focused on the Spanish stock market, which gradually attracted external clients over time thanks to the returns it achieved. Ten years later it would go on to become the embodiment of our ideal mix of global and Spanish stocks.
It was an important step for all involved and required a cautious approach. After three years analysing stocks, studying the investment strategies of the masters – Buffett, Graham, etc. – and a little of market history, I was already certain of the style of investment I wanted to apply. But it needed to be very well explained and serious errors had to be avoided; the goal was to buy attractive shares at a time when they were unwanted or not valued by the markets, without worrying too much about general economic or stock market developments.
It is worth remembering that global stock markets had been tracking upwards for 10 years. The process had begun at the start of the 1980s, when Paul Volcker, Chairman of the Federal Reserve, broke the American economy's inflationary spiral once and for all. There was a brief interruption with the major shock of October 1987. However, this didn't lead to long-lasting losses in international markets and the indexes continued to rise for some time after.
In Spain, however, the stock market did perform somewhat more erratically from 1987 onwards. The economy experienced patchy growth, culminating with a recession in winter 1992–1993 caused by the hangover from excessive spending in previous years. May 1993 brought about the third peseta devaluation in quick succession, which, together with an improvement in the external environment, enabled the economy to recover.
We were therefore fortunate. After these somewhat bumpy years, exacerbated by the first Gulf War, the Spanish stock market found itself at the same level in December 1992 as it had been in December 1987, 35% below the 1989 peak. When a market stagnates for such a long period of time it tends to be storing up future gains. The prices of large caps, banks, electricity, etc. were extremely attractive and there wasn't much need for us to focus on small companies, which – while obviously offering more value – needed more careful explaining to clients. And we already know that it's not the same thing to get it wrong with Telefónica as it is with an unknown company.
Bestinfond's initial portfolio (see the table on the following page) was heavily invested in large caps, over 70%. Telefónica, Bilbao-Vizcaya, Banco Santander, Bankinter, and Iberdrola accounted for nearly 50% of our total equity investment. However, we had already begun to uncover some of the small-cap gems which would go on to become star performers for us over time, such as Electra de Viesgo, Hullas del Coto Cortés, and Vidrala. And who could forget Acerinox.
1993 was a positive year for global stock markets and it was exceptional for the Spanish market. The IGBM (Madrid Stock Exchange General Index) rose by 46%, supported by a sharp cut in interest rates in Spain. The yield on Treasury bills fell from 13.5% to 7.75% in less than 12 months. Bestinfond also performed very well, rising by 44%, especially bearing in mind that we were holding high levels of liquidity during the first three quarters,1 nigh on 50%! We only lowered some of this liquidity towards the end of the year to end up with 30% cash. Continual price rises over the course of the year made it impossible to fully invest; it is generally not a wise idea to chase prices while they are rising.
Bestinfond's Initial Portfolio (31/12/1992)
| STOCKS | Investment |
| Bankinter | 18,495,840 |
| Bilbao-Vizcaya | 47,268,000 |
| Pastor | 10,764,000 |
| Popular | 10,780,000 |
| Santander | 34,872,797 |
| Enher | 8,308,000 |
| Cantábrico | 11,407,500 |
| Iberdrola | 16,900,000 |
| Reunidas | 3,888,750 |
| E. de Viesgo | 6,842,750 |
| Campofrio | 2,550,000 |
| Ebro | 3,792,000 |
| Aumar | 1,950,000 |
| Acesa | 17,100,000 |
| Finan. Alba | 3,750,000 |
| Vidrala | 4,500,000 |
| Cubiertas | 31,955,000 |
| Metrovacesa | 5,700,000 |
| Acerinox | 1,533,600 |
| Hullas C. Cortes | 10,603,800 |
| Indo | 3,000,000 |
| Tabacalera | 12,090,000 |
| Telefónica | 30,780,000 |
| TOTAL EQUITIES | 298,832,037 |
| Treasury bills | 1,960,094 |
| Debt repos. | 252,277,797 |
| TOTAL PUBLIC FUNDS | 254,237,891 |
| TOTAL DOMESTIC PORTFOLIO | 553,069,928 |
| TOTAL PORTFOLIO AT COST | 582,224,810 |
| PORTFOLIO CASH VALUE (pesetas) | 553,069,928 |
Source: CNMV.
Generally speaking, it is harder to outperform the indexes in bull markets, but with half the investment we secured similar results to a benchmark index, delivering a strong increase in value – not at all bad for our first year operating as a public fund focused on equities. We ended the year reducing our position in large caps to 40% of the portfolio. Around this time some old friends began to appear, such as Elecnor, Citroën, Lingotes Especiales, and Unipapel. That year some of them went up in value by over 100%.
Then came 1994. Alan Greenspan hiked interest rates by surprise and the markets had a tough year overall. We started the year with a conservative portfolio and made the most of the fall from February onwards to increase our investment in equities, which accounted for over 90% in the second quarter, reaching 95% in the second half of the year.
The IGBM ultimately suffered a decline of 11.7% in 1994, but Bestinfond went up in value by 5.28%, proving to be the best-performing mutual fund in the Spanish stock market that year. The large caps had suffered the most and our limited exposure to them enabled the portfolio to perform well. However, banks – Santander, BBVA, Popular, Argentaria, and Bankinter – still accounted for between 30% and 40% of the portfolio that year. Seen from 2016, and knowing a bit about our philosophy, this might seem odd, but with the EU progressing solidly, following the signing of the Maastricht Treaty in 1992, Spain's economic outlook was very robust and the banking sector was an easy way to capitalise on the opportunity.
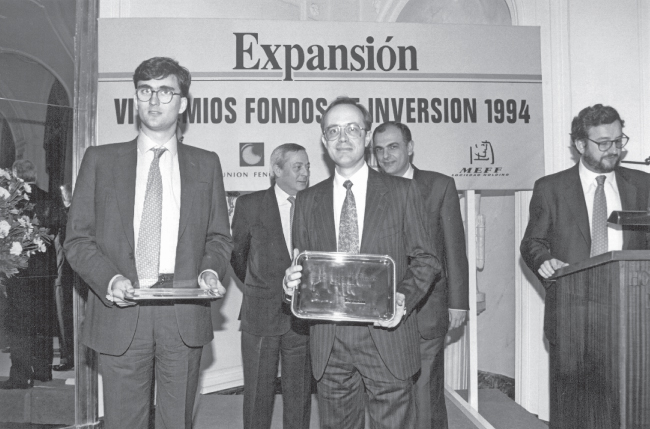
1994 was a key year. We showed that we could keep our trunks on in both a bull market such as 1993, as well as in 1994's bearish market. When the tide went out we weren't swimming naked, as Buffett has often warned. The stock market went up and the fund went up; the stock market went down and the fund kept going up. We won our first management prize and future clients started to take note of us, our net asset value (NAV, the share price at which the fund trades), and the fund's performance was being published daily in Spain's main economic press.
These two years cemented trust among our client base, especially the most important ones – the Entrecanales family – forming a solid basis with which to weather the events that were to come our way over the next 20 years.
1995–1997: EUPHORIA RUNS WILD
The markets performed exceptionally over the following three years from 1995 to the end of 1997. Once the Gulf War had died down, which had temporarily delayed the benefits to be derived from the fall of the Berlin War, the market economy subsequently spread across the world. There were few major uncertainties and we experienced the final glorious ‘autumn’ of the long bull market initiated two decades before, at the start of the 1980s.
This positive cycle started with the liberalisation policies embraced by the United Kingdom and the United States. Following the calamitous 1970s, the UK and US governments finally turned their backs on expansionary public spending policies (which culminated with the Vietnam war and President Johnson's ‘great society’ in the United States and the negative effects of numerous post-war nationalisations in the United Kingdom: the ‘winter of our discontent’ and the UK's IMF loan). Furthermore, this liberalisation gradually spread – to a greater or lesser extent – across the West (underlined by President Mitterrand's policy U-turn in France).
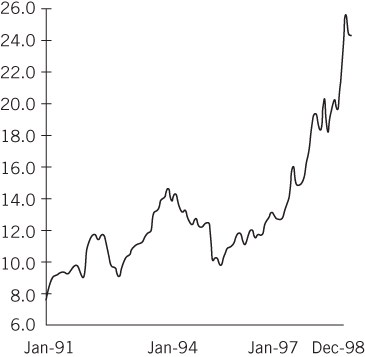
The first quarter of 1995 was still negative. The IGBM fell by 5.66%, against a backdrop of political instability in Spain – the GAL plot, effectively state-sponsored terrorism, was in full swing – and another peseta devaluation. But in June the Fed once again cut interest rates and markets embarked on a breath-taking 36 months. The IGBM jumped from 268.85 points on 31 March 1995 to 888.67 points on 31 March 1998, more than tripling in value in three years.
While it was true that the market hadn't done much since 1989, it is equally true that the bull market went back a long way: the Madrid market had multiplied in value by 12 since 1980, as Spain began to leave behind the debilitating crisis of the 1970s. All in all, an exceptional performance in three unbeatable years. As of June 2016, some 20 years later, the IGBM stood at 780 points. The banking crisis is partly to blame for this disappointing performance, but the extremely high starting point – coming off the back of previous price increases – conditioned future developments.
Our portfolio obtained spectacular returns during those three glorious years in absolute terms, tripling net asset value, though lagging a little behind the overall market. As I have already noted, when the market rises quickly, it becomes quite a lot harder to outperform. It is always easier to create relative value from falls.
Nonetheless, it is worth pointing out that in our case the increase in value took place while holding a high average level of liquidity throughout the period – around 25%. This gives additional merit to the returns achieved, but is also an indication that we were facing a lot of uncertainty. In fact, ever more expensive share prices led us to gradually increase liquidity over the period. We were already struggling to come up with sufficient ideas to invest 100% of assets in the stock market, meaning that by the end of the year we were holding 19% liquidity, which we maintained and increased slightly over the remainder of the upswing.
Another transformation was taking place in the portfolio, with the gradual disappearance of large caps. By the end of 1996, they accounted for just 20%. Meanwhile the list of secondary stocks began to lengthen: Electra de Viesgo, Cubiertas, Fiponsa, OMSA, CAF (Construcciones y Auxiliar de Ferrocarriles), BP Oil… (BP's Spanish subsidiary, for which, oddly enough, we received two takeover bids: we took part in the first, repurchasing later and subsequently BP launched a public tender offer, which we also participated in).
In December 1996, Federal Reserve Chairman, Alan Greenspan, made his famous remarks on the ‘irrational exuberance’ of stock markets. The price rises during previous years had meant that shares were now becoming seriously overpriced. The markets fell briefly during the following days, but later regained momentum.
Spanish elections in 1996 saw the centre-right come to power for the first time since the transition to democracy in 1979, and it became increasingly clear that the first stage of Monetary Union was about to get underway, providing an additional stimulus to the markets.
We kept liquidity at a very high level in 1997, some 30%. Little by little we completely unwound our holdings of large caps: Banco Santander, Repsol, and the like. We continued to focus on the medium caps which had been left behind, particularly increasing our positions in ERZ and Enher, very defensive electricity stocks. Selling Banco Santander was a poignant moment for me, it having been the first share I bought back in 1990. After seven years the market price now reflected its capacity to generate earnings over the long term. I had begun to have reservations about the bank and now, nearly 20 years later, the bank's shares are trading at similar levels…
Still, the market did not see any clouds on the horizon. Only towards the end of 1997, while on honeymoon in Italy, did some insipid warning signs emerge out of Southeast Asia, but the market shrugged them off. The biggest bull market of the twentieth century had been running for 15 years and it appeared as though nothing could stand in its path.
1998: THE END OF THE CYCLE
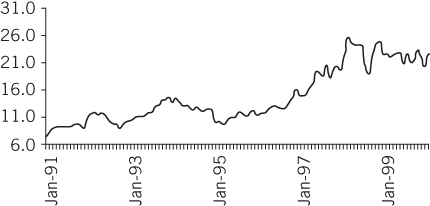
Gradually we woke up to the reality of our position in the centre of the storm, at the worst moment for any sensible investor: the end of a long upswing. And everything pointed in this direction.
In the first quarter of 1998 the IGBM was revalued by 40.9%, while Bestinfond remained at 22.12%. 40% in a quarter after two years of increases of 41%! I am not sure whether there has been a similar quarter in the history of the market, but at the time it struck me as total lunacy.
We continued with the process of selling shares, meaning that by the end of the quarter liquidity had climbed to 32%. Never before (except at the very outset) had we held so much liquidity.
It was also the first time that our approach came under real scrutiny; our returns were significantly below the market. Indeed, at the start of 1998 we began to have issues with some clients. It wasn't easy to espouse an investment philosophy in those markets. Many investors had obtained and were continuing to obtain significant returns from investing their own money, and they thought that we were the ones in the wrong. As Peter Lynch explained in his cocktail party theory, these are the times when clients tell you where you have to invest. The only way to cope with end-of-cycle euphoria is with time and patience.
When I speak of patience it is not just about waiting for the shares we have invested in to rise, but also being able to sit tight until expensive stocks fall to more attractive prices. And this can be even harder still.
I felt obliged to call on some clients personally to reassure them, explaining that it was a highly critical moment, which required taking maximum precaution. Ultimately, some clients ended up leaving the fund and for the first time I had to stand firm in the face of external irrationality.
By the summer of 1998 we had taken an extreme liquidity position in the fund, representing 31% of total assets. In fact, liquidity would have been over 60% had it not been for our investment in the subsidiaries of the electricity company, Endesa.
We had just under 30% of assets invested in Electra de Viesgo, ERZ, Enher, and Saltos del Nansa – good distributing utilities with superb generating assets, which were mainly hydraulic. These were top-class electricity assets at very reasonable prices given the market conditions, which is why to date they have been the most significant investment in a single ‘area’ that we have made in 25 years.
This one-off focus on a single sector was influenced by a relationship that I struck up with Xavier Cuadrat, a professor of sociology at the Complutense University of Madrid. Xavier is a market enthusiast who started investing his savings at the beginning of the 1980s, riding on the coat tails of the long bull market. He had and continues to have (though I don't see him much these days) the trait of foraging into the heart of companies. He goes to AGMs in far-flung places, speaks with whoever he can, and visits assets wherever they may be, combining visits to Romanesque churches with water dams.
I too was already doing a similar type of thing (I remember attending Prim's AGM – a company which distributes medical products – and having the sensation of gate-crashing a baptism or communion for one of the family's children), but he made me even more aware of the need to take this route. I ended up visiting the impressive dams at the Tajo and Duero rivers and going down Hullera Vasco-Leonesa's coal mines.
Bestinfond Portfolio (30/06/1998)
| STOCKS | Investment (millions of pesetas) | % Total |
| CAF | 276 | 2.54 |
| Electra de Viesgo | 1.037 | 9.54 |
| Reunidas de Zaragoza | 1.082 | 9.96 |
| Elecnor | 494 | 4.55 |
| Ence | 0 | 0.00 |
| Enher | 1020 | 9.39 |
| Acerinox | 103 | 0.95 |
| Cevasa | 146 | 1.34 |
| Cevasas Nuevas | 0 | 0.00 |
| Fasa Renault | 281 | 2.59 |
| Frimancha I. Cárnicas | 4 | 0.04 |
| Grupo Anaya | 352 | 3.24 |
| H. Cantábrico | 94 | 0.87 |
| Hullas Coto Cortés | 163 | 1.50 |
| Hullera Vasco Leonesa | 72 | 0.66 |
| Koxka | 94 | 0.87 |
| Iberpapel | 88 | 0.81 |
| Indo Intern. | 38 | 0.35 |
| Lingotes especiales | 41 | 0.38 |
| Liwe España | 0 | 0.00 |
| Oscar Mayer | 254 | 2.34 |
| Papelera Navarra | 526 | 4.84 |
| Prim | 115 | 1.06 |
| Roberto Zubiri-A | 6 | 0.06 |
| Saltos del Nansa | 14 | 0.13 |
| Uniland | 39 | 0.36 |
| Unipapel | 340 | 3.13 |
| Dchos. lingotes Esp. Serie A | 16 | 0.15 |
| Dchos. lingotes Esp. Serie B | 17 | 0.16 |
| TOTAL EQUITIES | 7.475 | 68.80 |
| TOTAL INTERIOR | 10.865 | 100.00 |
| TOTAL PORTFOLIO | 10.865 | 100.00 |
Source: CNMV.
SHADOW REPORT ON ENDESA AND ITS SUBSIDIARIES
Summary of Appraisals
Exchanges according to the criteria used by minority shareholders in Enher, ERZ, Viesgo, and Saltos del Nansa, and to the proposal made by Endesa (only for subsidiaries where there are major differences):
Minority Shareholder Criteria
- 1 Enher × 2.57 Endesa
- 1 ERZ × 3.66 Endesa
- 1 Viesgo × 2.54 Endesa
- 1 Nansa × 8.04 Endesa
Endesa Criteria
- 24 Enher × 25 Endesa + 200 Ptas
- 1 ERZ × 2 Endesa + 38 Ptas
- 14 Viesgo × 23 Endesa + 345 Ptas
- 5 Nansa × 19 Endesa + 171 Ptas
According to the valuation models described later on, we obtain the following share price for the Endesa Group:
| Endesa Group Valuation | Millions of pesetas |
| ASSETS | 3,969 |
| Electricity holding Assets | 992 |
| Subsidiary valuation | 1,765 |
| Parent diversification | 219 |
| International parent | 436 |
| Other parent assets | 557 |
| PARENT LIABILITIES | 1,000 |
| Net debt | 795 |
| Pensions | 205 |
| NET EQUITY | 2,969 |
| No. shares (millions) | 954,8 |
| VALUE ENDESA/SHARE (pesetas) | 3,109 |
Using the exact same valuation criteria, we obtain the following valuation for their subsidiaries:
| Valuation Subsidiaries | Valuation (billion pesetas) | Valuation (pesetas/share) |
| Enher | 501 | 8,016 |
| ERZ | 220 | 11,340 |
| Viesgo | 154 | 7,897 |
| Sevillana | 560 | 1,877 |
| Fecsa | 428 | 2,055 |
| Gesa | 134 | 11,814 |
| Nansa | 25 | 25,000 |
| Elcogas | 8 | — |
| Unelco | 200 | 6,529 |
This knowledge gave us the confidence to commit to making such a significant investment in what was basically a single idea.
As a side note, it is worth pointing out that Endesa ultimately launched an operation to merge all its subsidiaries using a very self-interested exchange equation, which failed to reflect the true value of the subsidiary's assets (see tables above). Unfortunately, unlike on other occasions when we were able to successfully convince the parent company to improve its offer for their Spanish subsidiaries – PSA-Citroën and Renault (although they were delisting tender offers, where CNMV had the last word) – we were not able to change their minds. For Endesa it was an important operation, which helped to compensate for the loss in value of their Latin American investments, meaning that they dug in on their preferred exchange equations, supported by an ‘independent’ valuation from Deloitte, who did not cover themselves in glory on that occasion. We weighed up taking it to court, but decided against given the uncertainties involved with a long-drawn-out process, which would have done little more than distract us.
ACTIVISM
I have always taken the view that I am not an activist shareholder, and that I only invest in well-managed companies requiring few changes. Though there are two exceptions to this:
- When the situation is clearly unfair, such as the one above or what happened to Ciba in 2008 (More on this later).
- When there is a dispute between two ‘factions’ of shareholders, obliging us to take a stance. When this happens it is usually because we have got it wrong and the company is not on the right track. Koenig & Bauer, a world leader in the manufacture of printing machines, is a recent example of this; a group of minority shareholders tried to force through a change in the management team.
Either way, I only get involved in ‘activism’ when I have a significant stake; when my investment is small, I let larger shareholders lead the way. At the end of the day it's about making efficient use of my most scarce resource, which is my time.
Under normal conditions I limit myself to insisting on the virtues of share buybacks, since if I invest in a company it's because I think the market is undervaluing its assets. So, reducing the number of shares at this market price makes economic sense. Otherwise, if I am asked about issues related to management, I politely respond that there are limits to my knowledge and I turn down opportunities to participate on management boards.
I do this for various reasons:
- I don't have the time. With a diversified portfolio of shares, there is no way I could handle the enormous demands associated with being a director in a listed company.
- I don't have the knowledge. Each company and sector is unique, making it difficult to enter into depth in the management. I would love to acquire this level of knowledge, but it would reduce the time available for other companies.
- It would limit my management flexibility, restricting the purchase and sale of shares to specific time periods to avoid falling foul of insider trading rules. This restriction could run counter to my interests and those of our shareholders.
- This has always been my position, which new Spanish legislation has ‘reinforced’ by barring fund managers from naming directors in companies in which they are invested, to avoid influencing the management! Say no more: bureaucracy in action.
Either way, it is worth bearing in mind that I have tended to be quite susceptible to family-run companies, which have historically accounted for more than 70% of our invested assets. This allows us to delegate control of management and the managers to the family. Who better than the family owners to ensure that the managers are looking after the shareholders' long-term interests. However, you obviously also have to watch out for nepotism, with unqualified family members becoming heavily involved in the management. We will look into this in the second part of the book.
END OF THE CYCLE
In the summer of 1998 the crisis and the conditions that would trigger it were already brewing. 1997 had already produced a flicker in Asia of what was to come. Many developing economies – such as Thailand, Malaysia, and Indonesia – were growing, based on strong imbalances, particularly external, and were dependent on a continual flow of external investment to finance growth.
These problems worsened in 1998, broadening to other countries such as Russia (also affected by the falling oil price) and Latin America. This culminated in one of the largest and most prestigious hedge funds in the world, Long Term Capital Management (LTCM) – led by an array of Wall Street professionals and Nobel Prize winners in Economics – running into dramatic liquidity problems and requiring a rescue. Furthermore, the Fed injected an exceptional amount of liquidity into the system through successive interest rate cuts.
The rescue averted the crisis of the summer of 1998, but the liquidity injected into the system sowed the seed for a still larger crisis two years later.
Fortunately, the markets seized on this as a good excuse (they always find one) to correct some of the excessive prices. Between the beginning of July and the start of September, the Spanish index (which had risen by 50% from January) fell by around 40%, while our funds retreated by 10%. This afforded us the opportunity to reinvest the bulk of our liquidity at much more attractive prices. We ended the year with liquidity of 10%. We obtained overall returns in 1998 of 30%, below the market returns of 37%, but a respectable difference given that the volatility and the risk level of our investments had been much lower. This is crucial and bears repeating: we took on much less risk.
It's my personal belief that the 20-year bull market came to an end in the summer of 1998. The Dow Jones had risen from 790 in 1982 to 9,000 by the summer of 1998, multiplying more than 10-fold, the biggest increase in prices in history over such a length of time.
Buffet explained it all very well in an article published in Fortune on 22 November 1999. Over 17 years he had obtained an annual average return of 19% from investing in shares, an astonishing achievement for this period. Yet he now saw the outlook for the next 17 years at a maximum of 4% per year. He may not be a prophet, but 17 years on the Dow Jones had clocked up a 2% annual real return.
While most indexes went on to hit record highs in March 2000, by that time there were also numerous attractive companies on offer; but back in summer 1998 it was practically impossible to find value in any of the markets. The cheapest sector in Spain was trading at a P/E ratio of 17, and the Spanish stock market as a whole had an average P/E ratio of 25. The banks traded at five times book value…
Our approach during this long bull market was to try to take advantage of opportunities in the market, generally with secondary stocks, while at the same time preparing the portfolio for what would sooner or later happen: a sharp downward adjustment in prices. The Fed kicked the can down the road in 1998 with its liquidity injection, but it couldn't be avoided months later.
Market Valuation
| 1997 | March 1998 | April 1998 | May 1998 | |
| Growth in EPS (%) | 13.5 | 13.0 | 14.2 | 14.2 |
| Return on own funds (%) | 12.2 | 12.8 | 13.0 | 13.0 |
| Dividend yield (%) | 2.4 | 1.9 | 2.0 | 2.0 |
| Long-term interest (%) | 5.6 | 5.1 | 5.1 | 5.0 |
| P/E ratio (x) | 20.5 | 25.6 | 24.4 | 24.3 |
| IBEX 35 | 7,255 | 10,209 | 10,025 | 10,005 |
| IGBM | 632 | 889 | 871 | 875 |
Source: AB Asesores Morgan Stanley Dean Witter Research.
Valuation of Banking Sector (prices to 29/05/1998)
| Banks | Relative Returnr | % | Growth in EPS | P/E Ratio | Relative P/E Ratio | Price/CF (cash flow) | Dividend Yield (%) | Relative Return | |||
| 1 | 15,168.7 | 1M | −3.2 | 97 | 28.0 | 31.2 | 1.1 | 14.4 | 1.3 | 1.6 | 0.9 |
| 2 | 5.0 | 3M | −6.3 | 98J | 21.9 | 25.4 | 1.1 | 17.0 | 0.2 | 2.0 | 1.0 |
| 3 | n.m. | 12M | 23.7 | 99J | 17.2 | 21.7 | 1.0 | 16.2 | 0.2 | 2.3 | 1.0 |
Source: AB Asesores Morgan Stanley Dean Witter Research.
| Last Price | % | EPS | P/E | CFPS | P/CF | Divid. | Yield (%) | ||||
| Argentaria | 4M | ||||||||||
| 1 | 1,581.5 | 12,910 | 1M | 2.0 | 97 | 514 | 25.1 | 573 | 22.5 | 295 | 2.3 |
| 2 | 4,690 | 14,350 | 3M | −0.3 | 98J | 600 | 21.5 | 700 | 18.5 | 314 | 2.4 |
| 3 | n.m. | 7,200 | 12M | 11.0 | 99J | 689 | 18.7 | 811 | 15.9 | 341 | 2.6 |
| Bankinter | 3M | ||||||||||
| 1 | 411.9 | 9,950 | 1M | −3.2 | 97 | 433 | 23.0 | 480 | 20.7 | 228 | 2.3 |
| 2 | 3,343 | 11,880 | 3M | −10.7 | 98J | 477 | 20.8 | 521 | 19.1 | 286 | 2.9 |
| 3 | n.m. | 6,800 | 12M | −24.0 | 99J | 533 | 18.7 | 570 | 17.4 | 320 | 3.2 |
| B.B.V. | 2M | ||||||||||
| 1 | 5,147.0 | 7,610 | 1M | −2.3 | 97 | 194 | 39.3 | 416 | 18.3 | 96 | 1.3 |
| 2 | 1,147 | 8,060 | 3M | −4.2 | 98J | 259 | 29.4 | 439 | 17.3 | 129 | 1.7 |
| 3 | mm. | 3,366 | 12M | 43.6 | 99J | 310 | 24.5 | 432 | 17.6 | 155 | 2.0 |
| B.C.H. | 4M | ||||||||||
| 1 | 1,829.6 | 4,965 | 1M | −2.7 | 97 | 129 | 38.6 | 271 | 18.3 | 64 | 1.3 |
| 2 | 1,097 | 5,190 | 3M | −6.0 | 98J | 176 | 28.1 | 315 | 15.8 | 88 | 1.8 |
| 3 | n.m. | 2,262 | 12M | 34.8 | 99J | 217 | 22.9 | 347 | 14.3 | 109 | 2.2 |
| Popular | 3L | ||||||||||
| 1 | 1,360.5 | 12,020 | 1M | −5.7 | 97 | 595 | 20.2 | 711 | 16.9 | 300 | 2.5 |
| 2 | 2,641 | 15,240 | 3M | −22.1 | 98J | 656 | 18.3 | 746 | 16.1 | 329 | 2.7 |
| 3 | n.m. | 7,647 | 12M | −2.4 | 99J | 719 | 16.7 | 815 | 14.7 | 359 | 3.0 |
| Santander | 2M | ||||||||||
| 1 | 4,377.6 | 7,630 | 1M | −5.4 | 97 | 231 | 33.0 | 882 | 8.7 | 122 | 1.6 |
| 2 | 1,141 | 8,210 | 3M | −5.1 | 98J | 283 | 27.0 | 450 | 17.0 | 134 | 1.8 |
| 3 | n.m. | 3,700 | 12M | 15.1 | 99J | 335 | 22.8 | 460 | 16.6 | 167 | 2.2 |
- Market capitalisation (billions of pesetas):
- Book Value/Share
- Net Debt/Own Funds
Source: AB Asesores Morgan Stanley Dean Witter Research.
With the benefit of hindsight, I believe those years were probably the most important of my professional career. It's no simple undertaking managing to survive at the end of the longest bull market in the twentieth century, managing to post a reasonable return while being conscious of the dangers on the cards for the following years. Not only was it necessary to be well acquainted with the markets and companies, but also with oneself and the environment. And all of this needed to be managed appropriately. In such heady market conditions, clients – who have been successful with their own individual investments without having to put in much effort – think they know better than you.
Surviving that storm unscathed prepared me to overcome the crises that were to come later, the 2000 dot.com crash and the 2008 financial crisis. Seen from the perspective of the late 1990s, the latter seemed almost like child's play.
1998–2002: DOWNSWING. GLOBAL PORTFOLIO
So far this account has only focused on our portfolio in the Spanish stock market. Up to that point Bestinfond had only invested in Spain.
The start of 1998 was therefore a key milestone, with the launch of Bestinver Internacional. The main proponent was Javier Colomina, the managing director at the time, who was insistent that this was the way to go. I accepted the challenge, albeit with a healthy dose of scepticism.
It was certainly true that to manage in the Spanish stock market it was necessary to take account of the global environment and the pricing of comparable companies (for example, there's no sense in analysing Telefónica in isolation). However, I always believed – and still do – that you have to focus on what you do well. And at that time what I knew how to do was navigate the Spanish market. I was not at all certain whether I would be capable of investing globally.
But we got down to work, and the first year proved to be an absolute disaster… not so much in terms of philosophy, or experience, or laying the groundwork, but definitely in terms of results.
Lacking the necessary certainty and conviction to create a portfolio off the bat and faced with the added difficulty of a very overvalued market, we invested heavily in fixed income for most of the year, at around 50%. We diversified our investment in equities among funds and other products, such as commodity-backed bonds.
Our equity position at the end of the cycle was designed to make the most of low prices in Asian markets and commodities (I am struck by a certain déjà vu as I write this in late 2015!). Investment in Asian stocks through funds or structured products accounted for more than 20% of the portfolio; exposure to oil and other commodities another 20% (oil was trading at 15 dollars per barrel); and finally, less than 10% was invested in a limited group of shares in small European companies.
Commodities have never had much weight in our investment, they are too exposed to market-imposed prices, but at that time – as in 2015 – there were opportunities worth exploiting.
With such a peculiar structure and a lack of sufficient conviction, the fund was destined not to perform in the short run, and that's what happened. Hampered by a further decline in crude oil from 15 dollars to below 10, and by a lack of recovery in Asian markets, the year ended with a 14% loss. A great start to the fund's life! Especially bearing in mind that global indexes rose by 10% that year.
Being able to overcome these types of situations is critical for an investor wanting to get things right in the long term. It's not just critical but also inevitable: there are always going to be bad runs. No one avoids them. You have to ride them out. To do so successfully requires three things. First, having earned the confidence of investors and the environment in general. Second, being resolute and unwavering in your philosophy. Third, praying like crazy for it to be over with quickly!
For us the small scale of the fund, three million euros, and the limited number of shareholders played to our advantage. It gave us a certain amount of room to experiment, provided it didn't blow up in our faces. We tested the patience of our investors and shareholders, but miraculously the international portfolio rose 43% in the first half of 1999, well above global indexes, thanks to the recovery in Asian markets and oil prices. This enabled us to comfortably recoup the first year's losses.
Bestinver Internacional Portfolio (30/09/1998)
| STOCKS | Investment | % Total |
| TOTAL MONETARY ASSETS | 11 | 2.51 |
| Government bonds 11512 | 10 | 2.28 |
| Government bonds 11462 | 0 | 0.00 |
| Total temporary purchases | 10 | 2.28 |
| TOTAL SPANISH FIXED INCOME | 21 | 4.79 |
| TOTAL SPANISH EQUITIES | 0 | 0.00 |
| TOTAL DOMESTIC PORTFObIO | 21 | 4.79 |
| Treasury bills Germany | 85 | 19.41 |
| Bonds Den Danske Bank | 27 | 6.16 |
| Bonds Gohnan Sachs Petroleum | 17 | 3.88 |
| Argentaria PFD 7.2 Serie C USD | 9 | 2.05 |
| Federal Home Loan Bank | 15 | 3.42 |
| Bonds Fnma 5% 16-02-01 Dem | 27 | 6.16 |
| DSL Bandk 6.25% Mat 29-12-99 | 27 | 6.16 |
| B. Birds Notes on Nikkei USD | 46 | 10.50 |
| Bonds BNP Finance 4% GRD | 15 | 3.42 |
| TOTAL FOREIGN FIXED INCOME | 268 | 61.19 |
| GT Berry Japan Fund-B | 20 | 4.57 |
| Asian Capital Holding | 23 | 5.25 |
| JF Asean Trust | 7 | 1.60 |
| Cie Financ Richemont-Uts A | 12 | 2.74 |
| Sgs Soc Gen Surveillance- B | 4 | 0.91 |
| Outokumpu | 7 | 1.60 |
| Metaleurop, S.A. | 15 | 3.42 |
| Enterprise Oil Pic | 5 | 1.14 |
| Premier Oil | 12 | 2.74 |
| Banca Populare | 6 | 1.37 |
| Saga Petroleum serie A | 24 | 5.48 |
| Saga Petroleum serie B | 8 | 1.83 |
| Chile Fund | 6 | 1.37 |
| TOTAL FOREIGN EQUITIES | 149 | 34.02 |
| TOTAL EXTERNAL PORTFOLIO | 417 | 95.21 |
| TOTAL PORTFOLIO (millions of pesetas) | 438 | 100.00 |
Source: CNMV.
Not only that, but little by little we managed to invest the fixed income in attractive companies, finishing 1999 with an equity investment of 80%. 25% was still in Asian funds and commodities, but 50% was already in small and medium-sized global companies. Dassault Aviation, which went on to be one of our firm favourites, entered into the portfolio at this time, as well as others such as the Swiss companies Bel and SGS.
We were able to invest in small companies in 1999, because the markets had embarked on one of the most extreme episodes of schizophrenia in their history: the overpricing of everything related to new technologies (TMT) and the underpricing of traditional companies. Thus, while in summer 1998 it had been impossible to find good companies at a decent price, by 1999 this was now an option.
In 1999 our international fund was still very small compared with our overall size – three million euros (compared with 176 million euros of total assets under management and a total of 80 million euros in Spanish stocks; the rest were fixed-income funds) – and was yet to earn its stripes.
Our eggs were still firmly placed in the Spanish stock market basket. And 1999 was not an easy year. Not by any stretch of the imagination.
Bestinver Internacional Portfolio (31/12/1999)
| STOCKS | Investment | % Total |
| Government bonds 11355 | 0 | 0.00 |
| Government bonds 11595 | 62 | 12.53 |
| TOTAL PUR. ASSETS | 62 | 12.53 |
| TOTAL SPANISH FIXED INCOME | 62 | 12.53 |
| TOTAL DOMESTIC PORTFOLIO | 62 | 12.53 |
| Bonds Goldman Sachs Comodity | 0 | 0.00 |
| B. Birds Notes on Nikkei USD | 48 | 9.70 |
| Ctystp 9.5% USD | 27 | 5.45 |
| TOTAL FOREIGN FIXED INCOME | 75 | 15.15 |
| Sgs Soc. Gen. Surveillance-B | 8 | 1.62 |
| Outokumpu | 14 | 2.83 |
| Metaleurop, S.A. | 19 | 3.84 |
| Eridania Beghin | 9 | 1.82 |
| Dassault Aviation | 12 | 2.42 |
| Enterprise Oil Pic | 6 | 1.21 |
| Premier Oil | 16 | 3.23 |
| Somerfield | 12 | 2.42 |
| Boskalis CT | 12 | 2.42 |
| Opg | 10 | 2.02 |
| Vedior | 7 | 1.41 |
| Dimon Incorporated | 13 | 2.63 |
| Codan Forsikring DKK | 9 | 1.82 |
| Beln Sw | 19 | 3.84 |
| Barry Callebaut AG | 11 | 2.22 |
| Holzmann (Philipp) AG | 0 | 0.00 |
| Krones AG Pfd DEM | 8 | 1.62 |
| Schmalbach Lubeca AG | 16 | 3.23 |
| Metsa-Serla OY B ORD | 0 | 0.00 |
| CNP Assurance | 24 | 4.85 |
| UAF | 15 | 3.03 |
| Schweitzer Mauduit Intl. Inc. | 11 | 2.22 |
| Invesco GT Japan Fund-C | 38 | 7.68 |
| Asian Capital Holding | 27 | 5.45 |
| Chile Fund | 9 | 1.82 |
| Fourmi Japan II | 33 | 6.67 |
| TOTAL FOREIGN EQUITIES | 358 | 72.32 |
| TOTAL EXTERNAL PORTFOLIO | 433 | 87.47 |
| TOTAL PORTFOLIO | 495 | 100.00 |
| TOTAL PORTFOLIO (thousands of euros) | 2,975 | 100.00 |
Source: CNMV.
1999: THE LOW POINT
If 1998 was a tough year for the Spanish portfolio, 1999 and the first quarter of 2000 were something else.
During the first three quarters, the markets were very muted. The index fell 0.5% and our fund declined by 3.5%, very bearable losses. 30% of the assets remained linked to Endesa, due to the merger of its subsidiaries. It was not an ideal situation, and we weren't comfortable with it, but we had to wait a few months to unwind the position in Endesa.
We were clearly avoiding large caps and particularly Telefónica and telecommunications, because they were extremely overpriced. The portfolio was made up exclusively of medium and small caps. We started the fourth quarter with liquidity of over 20%, because the previous months had not given us enough time to fully reinvest the cash generated from selling Endesa.
Thus, when the stock market rebounded by a surprise 17.36% in the fourth quarter, our fund fell by 7.65%. A difference of 25%! As I explained earlier, in the first half of 1998 we had lagged the market, but at least our clients had obtained positive returns. This time around it was different, our clients lost money when the stock market went up…
Yet, during this time of great unease, I never lost confidence in the virtues of our strategy. I had already read extensively on the history of markets and I was convinced that the situation would turn around soon. Books such as those by Kindleberger, MacKay, and John Brooks, and specialist articles and analysis, were very useful reminders of past bubbles.
It was widely remarked that telecommunications and the development of the Internet were going to change our way of life, removing any trace of our previous existence, leaving it obsolete, but I was certain that it wasn't going to be a pleasant or profitable process, the inflated investment in this segment of the economy would lead to the typical excesses seen in the past.
Of all the nonsense that was said during this period to justify the boom, there is one piece that is particularly worth recalling, because it came from ‘one of ours’: Barron's. In December the prestigious American weekly Barron's, probably the best among those dedicated to investment, devoted its front page to Warren Buffett,2 criticising his lack of exposure to the TMTs (Telecommunications, Media, and Technology): ‘To be blunt, Buffett, who turns seventy in 2000, is viewed by an increasing number of investors as too conservative, even passé. He may be the world’s greatest investor, but he hasn't anticipated or capitalised on the boom in technology stocks in the past few years’.
If this was happening to Buffett after an incredible 40-year track record, I could sleep easy at night.
Not only was I unwavering, but I believed that an extraordinary and unexpected opportunity was presenting itself, of the type that only crops up in our memories or our wildest dreams. Between 1997 and 1998 I had viewed the investment outlook with concern in the face of sky-high share prices, but the dichotomy that was opening up in 1999 and 2000 between TMT and ‘traditional’ stocks had the makings of an enormous relative return, which is what happened.
Either way, in December, we sent a special letter to our clients trying to convey a sense of composure and asserting that the quality of our stocks would ultimately see out the technology frenzy. We predicted that Telefónica, Terra, etc. would suffer losses of 70–80%, as proved to be the case. It was the first time we had written this type of letter, but it wouldn't be the last. Some nine years later we had to once again resort to special communications with our clients.
Madrid, December 1999
Dear client,
In 1999 the returns obtained by our equity funds – Bestinfond, Bestinver Bolsa, and Bestinver Mixto – were not up to our, nor our shareholders', expectations. The excellent returns of the past are no solace to clients who started investing in these funds in 1999. We may well end the year with slightly negative returns on these funds and there is a reason for this: in our opinion, the group of stocks in which we have invested have the potential for very strong growth and price increases, but this has not yet been reflected in the share price. The market is currently engaged in trading in technology stocks: Telefónica, Terra, etc. We intend to avoid these stocks which can create (as happened 20 years ago with Telefónica) losses of around 70–80% on your investment.
Our primary concern is to maintain the value of money over time, although to do so in some years we may suffer slight losses and we have to avoid getting involved in speculative actions. Our focus is elsewhere and we hope that newer clients will bear with us, so as to be able to enjoy the benefits that this policy offers over the long run.
In any case, now more than ever, we are at your disposal to clarify any queries concerning our funds or our investments, which are – of course – yours.
Yours faithfully,
Francisco García Paramés
Investment Director
As an aside, I should point out that we did actually make a small concession to the bubble. In February 2000, as a sop to some clients who felt they were missing out on the biggest steal in history, we bought a bond for their private portfolios which was 100% guaranteed and linked to the Nasdaq, the technology index. It was a tiny concession, which did not do any harm, given that it was completely guaranteed. There were no losses and everyone came out of the experience happy.
Why Invest for Others? Why Invest at All?
By contrast, I did have some concerns regarding a more existential issue: whether I was happy managing other people's money or not.
There are various pros and cons, but the drawbacks were particularly obvious at that time: you have less to worry about and complete independence if you only manage your own money.
But there is also much to be said for it. Firstly, it is a good business, and if you manage things well, the same level of effort can yield exceptional results. Costs are reasonably stable, meaning that profits move practically in line with revenue. Secondly, there are lots of investors out there who need help. How do you turn them down? While it's true that the market offers a range of alternatives, by default everyone believes that their own strategy and portfolio is the best one out there. If so, how can we refuse to let family members, friends, etc. enjoy the benefits? Thirdly, we have never gone out of our way to actively attract the clients who knock on our door. It requires a certain initiative and interest on their part, meaning that they tend to be people who are very attractive, both on a professional and a personal level. Indeed, many of their contributions have helped refine our management, forming a large family with a single destination (a bit like a nation…). Fourthly, hard times tend not to last long; at least this has been our good fortune, as is being illustrated.
These compelling motives quelled my doubts at that time and I continued to manage other people's savings. Nor can I say that I am plagued by these concerns at present, now that I have had the opportunity to start from scratch and decide how to focus my investment approach, relatively free from past constraints. The four arguments are still valid, although back then the first factor – being a profitable business – was more important to me. Nowadays, the emotional commitment that I have built up with a large number of people over a long time is clearly the driving factor, and it's what gives the work a meaning that it didn't have at the outset. It is extremely satisfying to observe how effective management of people's savings has an impact over the years. I am aware that for many clients I have been a key source of support to them in their lives, allowing them to have greater independence and more alternatives in their personal and professional decisions.
In reality, my thoughts often revolve around the bigger question of why do I do what I do? What drives me to do it? Sometimes I have the sensation that it is fate, how things had to be. When I was very young I was inclined to presume that things would go well for me, I had a degree of certainty in my own capabilities; I didn't know what form it would take nor how, but I couldn't conceive, nor did I want to, of anything else. I envisaged a peaceful life for myself, with a career focused on business – I didn't detect any artistic streak – and a family with children. I have always been intensely independent, but breaking new ground was not part of the plan (though now that I think about it, perhaps I have in some areas).
As I have already mentioned, being an analyst suited by introspective and shy personality, which – nourished by reading – formed a good basis for my personal development. I find the work itself rewarding. It is well known that when you have the sensation of mastering something it creates an affinity, and it's not necessary to have a preconceived idea of destiny. Things just turn out that way.
A path revealed itself to me. One that had to be followed because it emerged out of my upbringing and my personal education. I am not talking about the path that is expected of you, less still a politically correct one, but a path which you believe is right and essential. Inevitable. Unwavering. Each day a step, each step more assured. A career path.
But beyond being interesting work and a good professional career, I also find a certain overarching meaning that overwhelms me and forces me to look outside and consider the impact of my work on those around me.
At the same time, I have always had a desire, almost an urge, to be right, to find the truth; not my own truth but a shared truth, though it may not always be understood as such by others. I am not talking about metaphysical truth, which I have never been able to possess, but more of the tangible variety, despite my aversion to physics.
It comes down to truth and, let's be honest, recognition. I can't deny it. It's not the be all and end all, but ultimately we are talking about humanity; life itself.
In any case, I have always been free to make my own decisions. My family, specifically my wife María Ángeles, have always respected and supported all the decisions I have taken. If I had decided to leave investment behind for something else she would have accepted the change, taking on the new situation with unerring conviction in my principles.
After this digression, I still don't know how to respond to the question. I don't have a meaningful response for why I do what I do, but I know that I will keep doing it until the end.
2000–2002: BACK TO NORMALITY
The frenzy went on for another two months, but in March 2000 the tables turned and the market set off on a downward path that lasted for three years, with an accumulated loss of 40%.
During these difficult times, as already mentioned, our Spanish portfolio was dominated by small and medium caps. Our main positions were in Corporación Mapfre 8%, Aldeasa 8%, CAF 6%, Elecnor 6%, and Mapfre Vida 5%. They were trading at an average of nine times earnings, a P/E ratio of nine, and were some of the stars that enabled our portfolio to post an accumulated return of 49% over three years of bear markets. For example, CAF went up in value from 14 euros in 2000 to 440 in 2010 (see Spanish Portfolio on 31/03/2000 on the following page).
When I am asked whether equities are expensive, I always give the same response: there are cheap and expensive stocks. The stock market is not some uniform mass; it is made up of lots of companies that have to be weighed up to determine whether they are expensive or not at a given time. It's true that there is usually a correlation between stock movements, and when some are expensive the rest usually are too. However, there are continual exceptions to the rule, as occurred in 2000–2002. This is exactly what enabled us to obtain exceptional returns in a bear market.
2000 also marked another turning point, we completed the transformation of the international portfolio to focus on stock selection. By the end of the year our hand-picked stocks accounted for 75% of total assets, with the remainder in Asian funds and liquidity. In a world of doing everything at breakneck speed, we had taken three years to invest the portfolio in our stocks, preferring to take our time and do things right. From then on we always selected our own stocks.
2000 was also a good year for the international portfolio, both in terms of absolute returns and relative to the MSCI index. Gradually we were building up the confidence to take the lead, and even began recommending the fund to our clients. The period of apprenticeship and experimentation had come to an end.
Spanish Portfolio: Bestinver Bolsa (31/03/2000)
| STOCKS | Investment | % Total |
| Government debentures 8% (30-5-4) 11488 | 2 | 0.12 |
| TOTAL OTHER ASSETS FIX. INC. | 2 | 0.12 |
| Government debt 11512 | 69 | 4.17 |
| Government debt 12247 | 0 | 0.00 |
| TOTAL PUR. ASSETS | 69 | 4.17 |
| TOTAL FIXED INCOME | 71 | 4.30 |
| Catalana de Occidente | 106 | 6.41 |
| Corporación Mapfre | 150 | 9.07 |
| Fiponsa | 27 | 1.63 |
| Informes y proyectos | 7 | 0.42 |
| Adolfo Domínguez | 86 | 5.20 |
| Aldeasa | 146 | 8.83 |
| Aumar | 0 | 0.00 |
| Campofrio | 40 | 2.42 |
| C.A.F. | 123 | 7.44 |
| Dinamia | 88 | 5.32 |
| Elecnor | 99 | 5.99 |
| Cepsa | 0 | 0.00 |
| Cevasa | 56 | 3.39 |
| Hidrocantábrico | 77 | 4.66 |
| Hullas del Coto Cortés | 26 | 1.57 |
| Hullera Vasco Leonesa | 11 | 0.67 |
| Iberpapel | 53 | 3.21 |
| Indo | 18 | 1.09 |
| Inacsa | 0 | 0.00 |
| Koipe | 66 | 3.99 |
| Lingotes | 15 | 0.91 |
| Miquel y Costas | 80 | 4.84 |
| Natra | 47 | 2.84 |
| Papelera Navarra | 97 | 5.87 |
| Prim | 42 | 2.54 |
| Uniland | 11 | 0.67 |
| Unipapel | 111 | 6.72 |
| TOTAL EQUITIES | 1,582 | 95.70 |
| TOTAL DOMESTIC PORTFOLIO | 1,653 | 100.00 |
| TOTAL PORTFOLIO | 1,653 | 100.00 |
| TOTAL PORTFOLIO (thousands of euros) | 9,935 | 100.00 |
Source: CNMV.
MY ENCOUNTER WITH HAYEK
I had already read quite a bit about markets and I had seen for myself the regular ups and downs, but I hadn't found a theoretical framework which could give an effective account of them.
When I first read Frederich A. Hayek at the end of 2000, I was intrigued by the boldness and clarity of his ideas. His ideas came at a time between wars, and in the post-war 1940s when liberal (libertarian) economic thinking (and liberty in general) was on its knees. One of his most well-known books, The Road to Serfdom,3 spurred me to dedicate five years of reading to economics books, particularly the ‘Austrian’ school. This is the name given to the school of economics that caught my attention, initially dominated by Austrian and German thinkers.
I was immediately hooked by the fact that they employed the language of my world, with actual, real people taking personal and professional decisions. Here there were no Martian mathematical models, but rather the planet earth – paradise or valley of tears – life and our part in it. My route to discovering them was somewhat unorthodox, going from daily interaction with the markets and applying my own intuition to a logical and compelling theory. I had finally come very close to finding the truth that I sought, and studying these thinkers helped me develop a deeper understanding of my environment from then on.
I crowned my ‘Austrian’ years in 2005 with Ludwig von Mises' Human Action.4 On the way I discovered Murray Rothbard, mainly through his History of Economic Thought,5 Huerta de Soto, Jesús (a particular highlight was Money, Bank Credit and Economic Cycles6), and Hayek himself, with The Fatal Conceit7 and many others.
I was struck by the obviousness of their reasoning, with its common characteristic of being surprisingly well expressed, but, above all, I was attracted by how deeply rooted their ideas were in the concrete world around me, on earth, and not on another planet…
Everything they explained fitted perfectly with what I was seeing with my own eyes, every day on the markets and in the street. And without mathematical formulas to befuddle the understanding.
That is how I came to be acquainted with the Austrian school of economics, and through these authors and their peers I found a ‘theoretical’ framework which has served as an essential additional support to being better prepared for the shocks to come. We will discuss the key ideas of the Austrians in Chapter 4.
THE FINAL TAKE-OFF: 2000–2002
How did we manage to obtain a 49% return in a market losing 40%? The starting point was crucial. At the beginning of 2000 the biggest market divergence in history was taking place; within an expensive market a whole series of stocks were trading at ridiculous prices.
Long-term returns come from reading, studying, and analysing, but they also depend to a large degree on what everyone else is doing and the scale of the blunders being made by the markets (other mere mortals) around us. If the market is behaving rationally, it's difficult to outperform and our returns will be broadly similar. It's much better therefore for volatility to be very elevated, provoking a degree of irrationality, which opens up opportunities that wouldn't emerge in a more stable environment.
1996–2000 was one such period of extreme irrationality, providing a suite of opportunities for independent-minded asset managers.
Perhaps it's true that good things come to those who wait – because a bit of luck is always essential – but it's equally true that these crazy market situations come around sooner or later. Irrationality is always lurking in the wings, waiting to pounce on humanity. You have to be on the alert, because invariably it will attack. We will come back to this in Chapter 9.
Source: AB Asesores Morgan Stanley Dean Witter Research.
Spanish Market Valuation
| 1999 | January 2000 | February 2000 | March 2000 | |
| Growth in EPS (%) | 16.9 | 16.2 | 16.2 | 19.1 |
| Return on own funds (%) | 16.0 | 15.8 | 15.9 | 16.3 |
| Dividend yield (%) | 1.8 | 1.9 | 1.7 | 1.7 |
| Long-term interest (%) | 5.4 | 5.8 | 5.6 | 5.4 |
| P/E ratio | 21.4 | 20.3 | 22.5 | 21.5 |
| IBEX 35 | 11,641 | 11,009 | 12,686 | 11,935 |
| IGBM | 1,008 | 989 | 1,124 | 1,084 |
Source: AB Asesores Morgan Stanley Dean Witter Research.
Sector and Market Returns
| P/E Ratio (x) | Absolute Return (%) | Relative Return (%) | ||||||
| 31/03/00 | 2000J | 1M | 3M | 12M | 1M | 3M | 12M | |
| Banks and Insurers | 23.3 | 19.6 | 2.6 | 5.2 | 18.7 | 6.4 | −2.1 | −5.1 |
| Electricity | 19.0 | 18.2 | 5.7 | 17.2 | 10.3 | 9.6 | 9.0 | −11.8 |
| Media | 38.6 | 37.2 | −12.4 | 7.0 | 86.3 | −9.2 | −0.4 | 49.0 |
| Oil and Chemical Industries | 22.0 | 12.8 | 10.0 | −2.9 | 23.5 | 14.1 | −9.7 | −1.3 |
| Retail trade | 22.7 | 19.2 | −5.4 | −11.5 | −9.9 | −1.9 | −17.7 | −28.0 |
| Contractors | 18.6 | 15.0 | 10.0 | 4.8 | −8.6 | 14.0 | −2.5 | −26.9 |
| Food | 13.1 | 11.4 | 15.5 | 16.2 | −20.5 | 19.7 | −6.0 | −36.4 |
| Real-Estate Properties and Hotels | 20.8 | 19.1 | 6.5 | 10.1 | 0.5 | 10.4 | 2.4 | −19.6 |
| Various | 22.6 | 16.2 | 13.5 | 21.8 | 31.8 | 17.7 | 13.3 | 5.4 |
| Market | 25.2 | 21.0 | −3.5 | 7.5 | 25.1 | −5.1 | 4.8 | −1.0 |
Source: AB Asesores Morgan Stanley Dean Witter.
At the same time, the value market was not as well developed 15 years ago as it is now. There weren't as many asset managers in Europe and Spain scouring the markets for price inefficiencies. The success of certain fund managers has contributed to developing a more independent style of asset management, which at that time was thin on the ground.
All said, at that point in time I was able to apply our analysis to a market distorted by the technology bubble. If this hadn't been the case, our subsequent results would have been much less exciting. This is why I always maintain (and we insisted on this in 2008–2009) that falling prices are good for us in the long term, since we believe that we know how to make the most of them.
However, inefficiencies don't last for ever and bit by bit the market woke up to the overpricing of large companies, especially technology firms, and to the value contained in our stocks, enabling our funds to capitalise.
It was against this backdrop that the events of 11 September 2001 took place; yet another blow against peaceful political and economic development. The brutality of the attacks, which revealed mankind in its worst light, had important political and military implications. However, as we know, the economic impact was limited; Americans responded with admirable resilience, and continued fighting for a better life.
Alongside great suffering, this day was separately a key moment for me. Over lunch with José Manuel Entrecanales, which was interrupted by news of the attack, I received his approval to change the economic conditions governing my relationship with Bestinver.
The year before I had proposed changing my remuneration (and that of future managers) to put my relationship with the company on a sustainable footing, linking my compensation to the company's economic results. I had considered the option of linking it to the returns achieved by the funds, but while this is common practice in the sector it was rather complicated, which is why I thought it would be simpler to link them to the company's results. This meant my interests were clearly aligned with Bestinver shareholders.
You might think that this was an incentive for unfettered growth, with my personal interest driving me to increase assets under management and profits. Perhaps, but bear in mind that first, we didn't do any marketing beyond our annual conference setting out our investment philosophy and dealing with individual clients' concerns and second, our agents were not set sales targets – this had to be clearly articulated when we took on two external sales directors, as it's not very common in a company. Third, our distribution network was almost non-existent, with no fees offered to external distributors. The only increase in assets, and therefore results, that we could have derived from the good results from funds that attracted new clients.
I was told that José Manuel had to go to quite a lot of effort to convince his father and uncle, and thanks to this we reached an agreement which kept me at Bestinver for another 13 years. Despite the later success and growth in assets, the terms of my remuneration remained essentially unchanged from then on, despite being well below the market average.
Returning to management. At the start of the century, our portfolio in Spain remained dominated by small caps, which had been a key feature since 1997. Outside of Spain our portfolio was invested almost entirely in equities, our strong suit, with European companies making up 50% of the portfolio and American companies another 30%, with now only around 10% of the portfolio in Japanese funds.
The focus on European equities went on to be a key characteristic of the global portfolio from that point on. The geographical proximity of European markets, which also tend to be less efficient relative to the American markets, makes it easier and more natural to invest in Europe.
The advantage of proximity is an obvious one. A fund manager once remarked that the probability of a fund obtaining a good return is inversely proportional to the distance travelled by the fund manager in selecting the stocks. Perhaps it is a bit of an overstatement, but there is some logic in this. The closer to home we are, the more insights and criteria we will have to analyse a situation. Nor should we overlook the advantages of being able to travel easily to where a company is located and build good relationships with its managers and shareholders. Just think about the housing markets that we know best. We know our own street perfectly, we have a pretty good idea about our city, things start to become hazy at the country level, and we are completely lost if asked about the opposite side of the planet.
It's not so evident that the European market is less efficient than the American one, but my experience is that it's another clear reason for preferring Europe. It's worth remembering that the investment tradition in the United States goes back a very long way and is very ingrained, with a wide range of actors at all levels. After having had some bad experiences there, nowadays, whenever I find a stock that looks to be trading at an attractive price, I always ask myself what I am seeing that the Americans aren't.
In Europe, the financial sector has traditionally been dominated by the banks, who draw strength from their brand image and distribution capacity through an extensive branch network. It doesn't always yield financial efficiency, but it leaves little room for other actors.
This physical proximity to Europe hasn't prevented us from gaining global exposure; a large proportion of European companies are global, with sales across all markets and currencies. This also provides us with a natural currency hedge, without having to use the standard hedging instruments.
Predicting short-term currency movements is very difficult; it is also expensive – hedging costs are non-negligible – and distracts from the focus, which for us has always been on different companies' long-term competitive advantages.
It is therefore a waste of time going to a lot of effort thinking about possible currency fluctuations. Over the long term, countries tend to copy each other's economic policies, especially in developed countries, and currencies tend to converge towards purchasing power parity: the purchasing power of each currency, or more graphically, the Economist's Big Mac index, which tells you what it costs to produce a burger in each country. I recall our first meeting with BMW, during which the CFO showed us a chart comparing the performance of the dollar against the Deutsche Mark and later the euro. After lots of ups and downs in between, it was at the same place in 2006 as it had been at the start of the 1970s…
After an excellent 2000–2001, with both portfolios posting positive results in a sinking market, 2002 was an exceptional year for our Spanish equity portfolio and a bad year for the global fund. In Spain we delivered our best ever relative performance against the index, +8% compared with −23%, a difference of 31%. This rounded off three superb years of very positive results in absolute and relative terms, nearly 100% outperformance of the index.
Not only this, but at the end of the year we highlighted in our quarterly report that large caps were once again looking appealing, and that it was a good time to buy them and, therefore, buy into the market. By then we already had 10% of the portfolio in IBEX stocks, which represented a major change from 1997 when we did not have any significant positions in large caps.
This forecast proved spot on, and in the four years to come – from 2003 to 2006 – the IGBM rose by 145%. There's no such thing as a crystal ball for markets, but when most stocks are expensive, the market will deliver mediocre returns at best. By contrast, when prices are reasonable, there's room for upside surprises.
In contrast, 2002 was a bad year for our international funds, with a loss of 26.95%; the worst result for any of our funds to that point. It was little consolation that the reference index registered even larger losses of 33.02%. The bulk of the losses took place in a disastrous third quarter, where we suffered a fall of 25%. While we were certainly hurt by dollar depreciation (we still had 30% of assets in the United States), we had also made some errors. This included investing in Flag Telecom, whose insolvency provoked significant losses (sometimes Peter Lynch gets it wrong; my wife worked at Flag and we were supposedly familiar with the business. I hope the same doesn't happen with her current employers, Telefónica!). Either way, the fall meant that we were holding six companies in the portfolio who had more cash than their market capitalisation. Benjamin Graham would have been pleased; it was a good omen.
Fortunately, the international portfolio was still small and there weren't too many of us who got our fingers burnt. Bestinver Internacional had 12 million euros in assets, meaning that a limited number of investors suffered losses. We were still primarily a fund manager in the Spanish stock market.
By way of conclusion, it is worthwhile recapping the state of play in December 2002, after 10 years of managing funds in the Spanish stock market and five years with international equities. The results might be of some reassurance to the multitude of asset managers who have started up in recent years and are struggling to get going.
Over 10 years, from 1993 to 2002, we obtained a return of 570.65% on our Spanish investments compared with 289.39% achieved by the IGBM. We only registered one year of losses, in 1999, and took on significantly less volatility than the market. Even so, we were only managing 148 million euros, with growth of 40 million in 2002. What's more, a significant part of the assets under management belonged to a single family shareholder.
Over five years of international activity, from 1998 to 2002, we posted a 28.03% return compared with a decline in the benchmark MSCI index of 10.2%. At that time, our global funds handled 11.9 million euros.
Overall, our two equity activities amounted to 160 million euros in December 2002. Nothing to be sniffed at, but when other asset managers complain about a lack of growth and difficulties in attracting money, I explain to them that it took years for us to gain investors' approval. For better or worse, time is the only way to tell who's right or wrong, and clients need to be confident in their decisions.
At some point a spark will come along and ignite the fuse, and you will be carried away by a wave of exuberance. This is what happened to us from 2003 onwards.