CHAPTER 6
Passive and/or Active Management
We have made up our mind that investing our savings in equities is the way to go, safe in the knowledge that they offer the best relationship between risk and return. Now we have to tackle the next step in the investment process: deciding how we gain exposure to stocks.
The markets offer a range of options, creating confusion which can only be penetrated on a sporadic basis. But there is no reason to be pessimistic, because the problem can be simplified. If we focus on what's available, we can see that there are four options on offer for investing in equities:
- Passive management (via Index Funds [IF] or Exchange-Traded Funds [ETF]).
- Active management:
- fundamental index funds
- active managers
- direct investment in shares.
Mutual funds cover three of the four options for investing in equities, but despite this, in my home country of Spain, 60% of people don't even know what a mutual fund is. So, for the sake of clarity, a mutual fund is a collective investment undertaking which brings together funds from different investors to invest in a variety of financial instruments. The responsibility for the latter is normally delegated to a fund manager. There are thousands of funds available across the world, catering to all types of investors.
Professional money management is currently at something of a cross-roads. Investors are tired of paying high fees for products offering little value-added – only 7% of funds beat the indexes in the United States and the United Kingdom – while the availability of information makes it possible to carry out a more detailed analysis of the different alternatives on offer.
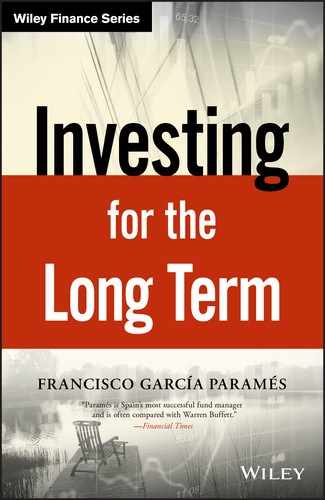
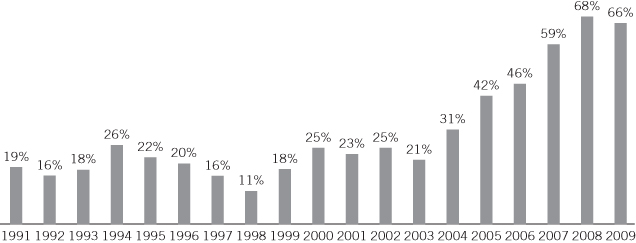
Accordingly, over the last 15 years passive management – investment in an index in return for paying low fees – has expanded to represent 35% of global assets, reaching nearly 40% in the United States. This type of management was almost non-existent at the turn of the century.1

Source: EPFR Global, ICI, Bernstein.
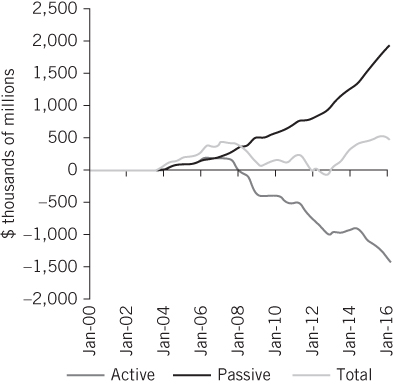
This trend, which is taking place in other sectors – Walmart, low-cost airlines, etc. – seems unstoppable. The development of a new type of passive fundamental index – which I will refer to as semi-passive – could push up these proportions much further still. Even the regulators and other public bodies are reviewing the costs associated with active management, penalising high costs and forcing them lower. The evolution of Vanguard's costs, the pioneer in passive management, are a good illustration of this. This is very welcome news, since a large number of so-called value-added managers don't, in fact, add any.
Source: Vanguard.
However, sooner or later this type of growth will hit a ceiling. There will come a point when the inefficiencies arising from an essentially ‘brainless’ method of investing will create excessive distortions in the market, attracting new capital to active management. Eventually, passive management will find its appropriate place in the market.
PASSIVE MANAGEMENT
Passive management means investing in funds which replicate an index. In recent times, there has been a particular surge in interest in a specific type of index fund, exchange-traded funds (ETFs). Both types of funds are similar, although ETFs trade on regulated markets and can be bought and sold over the course of a day, like shares, whereas normal index funds are assigned a net asset value at the end of every session.
Generally, passive index funds are created in proportion to the sizes of the companies that make up the index, with some exceptions – such as the Dow Jones, which is based on share prices. So Apple or General Electric will have a greater weight than a small company – in proportion to their relative size.
The main advantage of index funds is that they lower management costs, with fees of below 25 basis points (0.25%), while over the long term sustaining and improving the purchasing power of savings. Indeed, the results discussed in Chapter 5 comparing equities with other assets are based on the performance of the US stock exchange indexes.
However, deciding to invest passively is in itself an active decision. Firstly, it assumes that the market is efficient and thus a good alternative for people who don't want to go to much effort and, secondly, a choice still has to be made among the myriad of possible indexes. There are a lot of indexes out there, meaning careful deliberation is needed, though products based on the American S&P 500, the IBEX 35 in Spain, or the MSCI for a global portfolio readily tick the boxes of being low cost and pretty automated. Either way, it is not a complete cop-out from having to think a little.
However, for an investor with a long-term perspective, the main virtue of ETFs – being able to invest over the course of the day – is not critical. Indeed, it carries with it the added uncertainty that providing such liquidity could lead to valuation problems, in turn complicating future developments. Some assets lack the necessary liquidity to be able to provide near-instantaneous valuations, which has led some ETF experts to warn of potential problems in future large-scale crises.
The pioneer and biggest player in the passive world is the Vanguard Group, which also benefits from having a mutual company structure, meaning that profits are invested in reducing fees. Its founder and forefather is John Bogle, a fervent proponent of passive management. He has written various books, the most famous of which is probably Common Sense on Mutual Funds.2
Bogle's advice focuses on extolling the virtues of passive management:
- Select low-cost funds.
- Choose expensive advisors wisely.
- Analyse the fund's performance in detail and use the results of the analysis appropriately. It is important to understand what happened.
- Be sceptical about guru investors.
- Etc.
In other words: a lot of common sense, bearing in mind that it is extremely hard to beat the market, since the market is all of us and not everybody can be better than average.
In sum, passive management is a suitable approach for investors who are convinced of the case for investing in a certain type of asset (there are also funds for bonds and other assets) and are aware of the difficulties involved in beating the market while bearing moderate costs.
ACTIVE MANAGEMENT
As we explained in Chapter 4, the market always trends towards efficiency but almost never gets there, since information is not only changing but being created every second. Everybody is creating relevant new information for those around them through their everyday decisions. Not everybody is aware of this new information, sometimes we aren't even aware of it ourselves.
Some economists have attempted to prove that the market is efficient and that it captures all available information, rendering any attempt to obtain above-market returns pointless. But such static efficiency is impossible. Even if it were possible, it wouldn't give us relevant information, since it would not reflect the dynamic nature of information: no market can hold information that is only known to the person creating it, and even this person may be barely conscious of it.
(This section continues with some concepts which may be difficult to understand for the uninitiated, so the reader has the option to jump directly to the final two concluding paragraphs, which contain a revealing quote from Warren Buffett.)
The most well-known model for applying efficient markets to the valuation of financial market assets is the Capital Asset Pricing Model (CAPM). It has its origins in Harry Markowitz's so-called modern portfolio theory, which maintains that the best alternative investment is the market index. The latter can only be beaten if we take on leverage, which at the same time implies greater volatility. My summary of the theory is going to be brief, because from analysing the starting hypotheses it rapidly becomes clear that there is little point devoting much time to it. The hypotheses are that:
- Individuals cannot affect prices; they have known and homogenous expectations for expected return, volatility, and correlations. (After having determined that the essence of human action is in the subjective intentions of individuals, it should already be clear that the premises underpinning this assumption are absurd – enough said).
- All individuals plan to invest over the same time horizon, of one year (words fail me…).
- The return on assets corresponds to a bell-shaped normal distribution, the statistically most frequent, where the majority of observations lie in the centre. Returns are explained by mathematical expectation and volatility by standard deviation. (It has already been proven that there are a myriad of exceptions to the normal distribution;3 to add salt to the wounds, a basic error is made in confusing volatility with risk.)
- Individuals can lend and borrow unlimited amounts of a risk-free asset. The asset market is perfect; individuals can buy any fraction of an asset. (Once again, unrealistic assumptions, risk is confused with volatility and the view of financial markets is extremely rose-tinted.)
- Information is free and available to all. (Yet again I'm flabbergasted, literally speechless…).
With such unrealistic assumptions, it is hardly surprising that the CAPM doesn't get us very far. The main conclusions, according to Pablo Fernández,4 are that all investors:
- Will always combine a risk-free asset with the market portfolio.
- Will have the same portfolio of risky assets: the market portfolio.
- Will agree on the expected return and expected variance of the market portfolio and of every asset.
- Will agree on the market risk premium and on the Beta of every asset.
- Will agree that the market portfolio (on a chart of expected return–variance) is on the minimum variance frontier and is efficient.
- Will expect returns on their assets according to the stocks' Betas.
As Fernández observes, the CAPM is an absurd model because it is based on absurd hypotheses. Obviously, these conclusions are not fulfilled in real life.
The underlying problem is the impossibility of modelling human behaviour, with its ever-changing ends and means, which sometimes the actors themselves don't comprehend. And it is especially unrealistic when applied using a static analysis and nonsensical assumptions. Furthermore, the model is extremely dangerous, because it can appear as though it is helping to mitigate investment risks, increasing exposure to assets to levels above where they would normally be if the model were not being used. It provides a false sense of security, which – together with massive recourse to debt – led to the Long-Term Capital Management hedge fund debacle in 1998, which had an extremely negative long-term impact on the markets.
The biggest empirical blow to the model comes from a study by Fama and French.5 They show that for the period 1963–1990, the correlation between the return on stocks and their Betas was very small, while the relationships between return and size and results and price-to-book value were much more significant.
Main Findings of the French and Fama article
| Company size | Average Beta | Annual Average Return | Company Beta | Average Beta | Annual Average Return | Company Price/Book Value | Average Beta | Annual Average Return |
| 1 (biggest) | 0.93 | 10.7% | 1 (high) | 1.68 | 15.1% | 1 (high) | 1.35 | 5.9% |
| 2 | 1.02 | 11.4% | 2 | 1.52 | 16.0% | 2 | 1.32 | 10.4% |
| 3 | 1.08 | 13.2% | 3 | 1.41 | 14.8% | 3 | 1.30 | 11.6% |
| 4 | 1.16 | 12.8% | 4 | 1.32 | 14.8% | 4 | 1.28 | 12.5% |
| 5 | 1.22 | 14.0% | 5 | 1.26 | 15.6% | 5 | 1.27 | 14.0% |
| 6 | 1.24 | 15.5% | 6 | 1.19 | 15.6% | 6 | 1.27 | 15.6% |
| 7 | 1.33 | 15.0% | 7 | 1.13 | 15.7% | 7 | 1.27 | 17.3% |
| 8 | 1.34 | 14.9% | 8 | 1.04 | 15.1% | 8 | 1.27 | 18.0% |
| 9 | 1.39 | 15.5% | 9 | 0.92 | 15.8% | 9 | 1.29 | 19.1% |
| 10 (smallest) | 1.44 | 18.2% | 10 (low) | 0.80 | 14.4% | 10 (low) | 1.34 | 22.6% |
French and Fama conclude that: ‘Our tests do not support the most basic prediction of the CAPM Sharpe–Lintner–Black model, that average stock returns are positively related to their market Betas’.
If you haven't followed much of the above, don't worry. As Buffett says: ‘Half of the attendees at the Berkshire Hathaway annual general meeting don't know what Beta is, the other half couldn't care less’.
The main conclusion here is that financial markets are not as efficient as some people make out, providing a window of opportunity to those who believe they can obtain better returns.
We will see how.
Fundamental Index Funds: Passive or Semi-passive Management Using Criteria
The first step towards active management is not particularly active. In reality, it is semi-passive – as we shall see.
The passive funds or ETF indexes discussed in the previous section are based on underlying indexes – S&P 500, IBEX 35, MSCI World Index, etc. – whose component parts are determined according to their size. In other words, large companies have a proportionately greater weight than smaller companies, in accordance with their relative size. This creates a perverse effect – when a business flounders, its price falls and it is ultimately expelled from the index – and in a passive index we accompany it throughout this downward journey to expulsion. Normally, this business is then substituted for one that has grown a lot and therefore has increased its capitalisation, something we have not taken part in. Put simply, we end up buying stocks that have already risen and selling them once they have fallen. Completely the wrong way round.
Therefore, if passive management doesn't convince us and we want to do something more in the belief that the market may not always be efficient and that we can do better, then the next option is a variation on index or exchange-traded funds: passive funds which have a predefined strategy able to beat the index. This is also known as factor investing or investing with fundamental index funds (FIFs). This could include funds that invest in companies with a low P/E ratio or a high dividend yield.
These FIFs make sense if they are able to obtain a better return than the market or the passive capitalisation indexes. And this can arise because of mean reversion, which is one of the least understand phenomena in human behavioural analysis. We will discuss this in more detail in Chapter 9.
Various authors have demonstrated that share prices experience mean reversion: after a bad spell, they improve and outperform the market and vice-versa, bubbles deflate. Stocks which trade with low multiples perform better than average, while high-multiple stocks perform worse, both trending towards the mean.6
James P. O'Shaughnessy has extensively and clearly analysed a multitude of investment strategies over the last 50 years, enabling us to verify which have been the most successful in dealing with mean reversion.
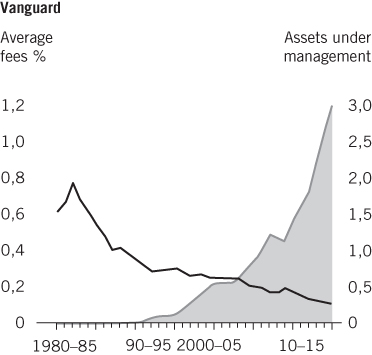
As can be seen from the table on the next page, lots of strategies beat the market on a regular basis. Over the period from 1964 to 2009, a strategy including all American stock obtained an 11.2% annual return. A pretty attractive return, but various alternative approaches could have fared better through building portfolios focused on a series of criteria:
- Low P/E ratio.
- Low EV/EBITDA (EBITDA is essentially an estimate of operating profit and EV is the enterprise value, the sum of debt plus stock market capitalisation).
- Low price/sales ratio.
- High dividend yield.
- Etc.
For example, a strategy which includes the group of shares with the lowest EV/EBITDA ratio would have obtained an annual return of 16.58% (by contrast, stocks with the highest ratio would have posted a measly 5.33% return).
He also considers various combinations of strategies, which deliver even better results. For example, he includes the following criteria in what he calls the ‘Value Factor Three’ strategy:
- Price/book value.
- P/E ratio.
- Price/sales.
- EBITDA/EV.
- Price/cash flow.
- Share buyback.
The Value Factor Three strategy, which employs the best combination of these factors – low P/E ratio, low price/sales, etc. – would have obtained an annual return of 17.39%.
Source: O'Shaughnessy (2012).
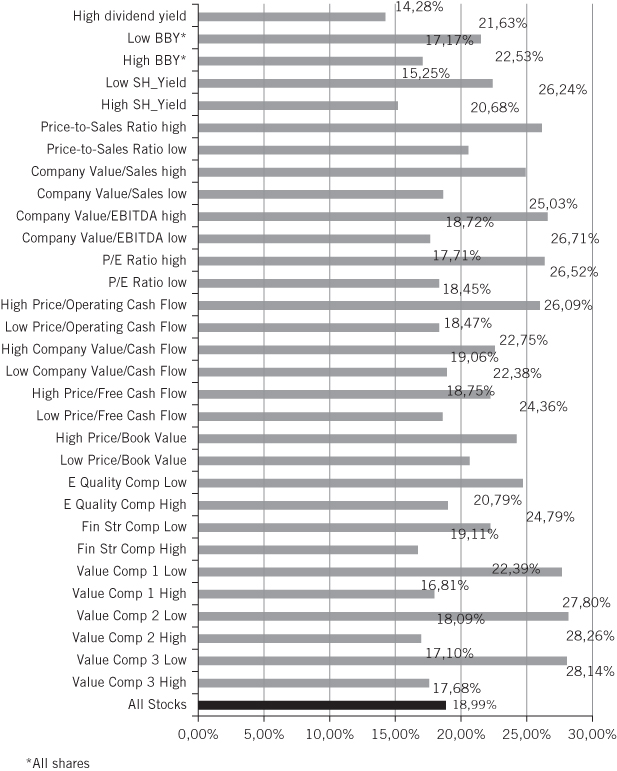
Source: O'Shaughnessy (2012).
Thus it would appear that it is in fact possible to improve on the results of capitalisation indexes using indexes of different criteria.
And surprisingly, if we add the concept of ‘price momentum’ to these ‘value’-based strategies, the results are even better: among all value stocks, the best performers over the last six months post a higher return during the following year. Some of the strategies calculated on this basis would have obtained a 23% annual return.
The fund managers at the hedge fund AQR have reached the same conclusion: value plus price momentum is the way to go.7
The logic behind ‘price momentum’ is that if you buy a stock which is already starting to rise then the opportunity cost is lower, reducing the time spent waiting for the rest of the market to wake up to the opportunity. This waiting time is the biggest problem for value investors, because we have a natural impulse to buy too soon and sell too early. In any case, for somebody accustomed to buying shares when they are on the way down, it feels counterintuitive to buy what is rising, making it a challenge to apply this ‘price momentum’ strategy.
O'Shaughnessy8 provides a detailed ranking of strategies, alongside the associated risks. It could be argued that such studies – which analyse the past – are a case of ‘data mining’, but in reality there is a logic to these results, underpinned by the concept of mean reversion.
The bigger challenge is choosing among the endless options. Even so, choosing one of these approaches makes a lot of sense, given that they can significantly outperform the indexes by between 5% and 10% a year. In reality, all active managers – especially us value investors – are constantly shuffling between the most attractive strategies. We are all on the lookout for cheap companies, using a variety of criteria to analyse them. When we post good results, they come from repeatedly applying these strategies, albeit sometimes intuitively or unwittingly.
Semi-passive or fundamental strategies, like passive approaches, save on management costs, but also help guard against character flaws that can prevent us from taking the right decisions. The more automatic the decision, the easier it will be. The downside is that when markets are performing poorly and the strategy itself is not working – and this can happen for lengthy periods of time – there is no shoulder to cry on. We are out in the wilderness on our own with no one to reassure us. This can be tough.
Obviously, there are not enough funds to cater for every possible form of semi-passive management, but the main alternatives are covered. In this regard, it's worth highlighting Dimensional Funds, which work directly with academics – especially Fama and French – to offer strategies that could obtain above-market returns. Not only have they developed some of the value strategies discussed here, but they also offer other types. AQR invest along these lines. Wisdom Tree is another asset manager specialised in this type of management, although the heavyweights, Blackrock and the like, also now offer semi-passive options.
Active Managers
The next step is to consider whether an active manager can do any better than these high-performing strategies. The answer is far from obvious, as can be seen in O'Shaughnessy:
Source: O'Shaughnessy (2012).
Over the years, only 30% of American asset managers have managed to beat the indexes. Furthermore, according to the S&P Dow Jones Indices, in the last 10 years, 80% of European funds (France, Spain, Denmark, Switzerland, and Holland) failed to outperform the indexes. The success rate is even worse in Spain.9 (There are several studies on this topic, with different results, but always with a minority of managers beating the indexes.)
But the problem runs deeper still. Although some active managers have obtained good results, there is scant chance that they will continue to do so in the future. Research by two Morningstar analysts, Alex Bryan and James Li,10 shows that we have the same probability of outperforming the market in the future by investing with the worst-performing investors as we do with those who have the best track record (although for a horizon of less than a year, a certain persistence remains due to the ‘price momentum’ of certain stocks). Indeed, the CNMV – Spain's securities market regulator – requires all funds to provide a mandatory warning that past performance is no guarantee of future results.
Furthermore, if there are semi-passive strategies with proven track records of beating the indexes, why would we need an active manager?
Truth be told, there isn't much need. If we don't know anyone whose approach or results inspire us with confidence, it's clearly better to stay within the confines of passive or semi-passive management.
That said, I could certainly recommend some managers whose approach I find convincing and who have the results to substantiate it. I could also refer to a 1970s study by Buffett on his investment friends, who posted exceptional results by taking the right approach.11
The Superinvestors of Graham-and-Doddsville
| No. years | Index performance | Investor performance | |
| Walter Jl. Schloss | 28 1/4 | 8.4% | 16.1% |
| Tweedy, Browne Inc. | 15 3/4 | 7.0% | 16.0% |
| Buffett Partnership, Ltd | 13 | 7.4% | 23.8% |
| Sequoia Fund. Inc. | 14 | 10.0% | 17.2% |
| Charles Munger | 14 | 5.0% | 13.7% |
| Pacific Partners, Ltd | 19 | 7.8% | 23.6% |
| Perlmeter Investments | 18 | 7.0% | 19.0% |
Source: Buffett (1984).
But nothing guarantees that future returns will replicate former glories, as the regulators rightly require us to point out to clients.
However, we can sustain an argument that most investors who have obtained excellent results did so by applying the previously mentioned value criteria. Furthermore, despite the cost of fees and the lack of certainty on results, there are still some reasons for investing with active managers:
- Some managers capitalise on market inefficiency and may continue doing so in the future. It's undeniable. Look no further than Buffett.
- We may not know how to choose or even find the right semi-passive or fundamental fund for us.12 With a good asset manager we delegate the choice of strategy to them to apply: low P/E ratio, high dividend yield, low price/book value, etc. The best active managers are constantly shuffling between multiple strategies to find attractive stocks (whether consciously or otherwise), and this is exactly why they obtain good results. We could go so far as to say that some active managers are closet selectors of semi-passive strategies.
It's true that it comes at a price, as they charge high fees, but sometimes it is worthwhile paying (bear in mind that unless we do the work ourselves, the person helping us find the right semi-passive fund will also charge).
- The right strategy can vary from year to year, meaning that the portfolio needs ongoing adjustment. This is part of the job of being an active manager, but it's not easy for a private investor to do.
- We are talking about our life savings and being in close contact with a fund manager that we trust can be a tremendous reassurance. Especially a manager who has a clear and consistent strategy, delivers good results, and to whom we can ‘put a face’. It is not easy to mentally prepare oneself for a passive and anonymous strategy, even if that may be the best approach for our future well-being. While a degree of automatism helps protect us from our own character flaws, it is also true that good advice from our asset manager can help during times of doubt or market difficulties, which are very frequent occurrences.
The ‘emotional side of finance’ suggests that we need help to overcome anxiety brought on by investment. Meir Statman also points to other factors, such as status-seeking or the desire to have the ear of a recognised authority, which can drive us to seek out ‘prestigious’ investors.13
- Another psychological benefit is the illusion of control or of having been responsible for success. If we choose an asset manager who is sufficiently responsive, we can have the sense of controlling decisions, as if we were the ones calling the shots. It's the closest thing possible to taking the decision to invest in a particular stock.
Berkshire Performance vs. S&P 500
| Year | Percentage Annual Change | |||
| In Book Value per Berkshire Share | In Book Value per Berkshire Share | In Book Value per Berkshire Share | ||
| 1965 | 23.8 | 49.5 | 10.0 | |
| 1966 | 20.3 | (3.4) | (11.7) | |
| 1967 | 11.0 | 13.3 | 30.9 | |
| 1968 | 19.0 | 77.8 | 11.0 | |
| 1969 | 16.2 | 19.4 | (8.4) | |
| 1970 | 12.0 | (4.6) | 3.9 | |
| Year | Percentage Annual Change | |||
| In Book Value per Berkshire Share | In Market Value per Berkshire Share | In S&P 500 with Dividends Included | ||
| 1971 | 16.4 | 80.5 | 14.6 | |
| 1972 | 21.7 | 8.1 | 18.9 | |
| 1973 | 4.7 | (2.5) | (14.8) | |
| 1974 | 5.5 | (48.7) | (26.4) | |
| 1975 | 21.9 | 2.5 | 37.2 | |
| 1976 | 59.3 | 129.3 | 23.6 | |
| 1977 | 31.9 | 46.8 | (7.4) | |
| 1978 | 24.0 | 14.5 | 6.4 | |
| 1979 | 35.7 | 102.5 | 18.2 | |
| 1980 | 19.3 | 32.8 | 32.3 | |
| 1981 | 31.4 | 31.8 | (5.0) | |
| 1982 | 40.0 | 38.4 | 21.4 | |
| 1983 | 32.3 | 69.0 | 22.4 | |
| 1984 | 13.6 | (2.7) | 6.1 | |
| 1985 | 48.2 | 93.7 | 31.6 | |
| 1986 | 26.1 | 14.2 | 18.6 | |
| 1987 | 19.5 | 4.6 | 5.1 | |
| 1988 | 20.1 | 59.3 | 16.6 | |
| 1989 | 44.4 | 84.6 | 31.7 | |
| 1990 | 7.4 | (23.1) | (3.1) | |
| 1991 | 39.6 | 35.6 | 30.5 | |
| 1992 | 20.3 | 29.8 | 7.6 | |
| 1993 | 14.3 | 38.9 | 10.1 | |
| 1994 | 13.9 | 25.0 | 1.3 | |
| 1995 | 43.1 | 57.4 | 37.6 | |
| 1996 | 31.8 | 6.2 | 23.0 | |
| 1997 | 34.1 | 34.9 | 33.4 | |
| 1998 | 48.3 | 52.2 | 28.6 | |
| 1999 | 0.5 | (19.9) | 21.0 | |
| 2000 | 6.5 | 26.6 | (9.1) | |
| Year | Percentage Annual Change | |||
| In Book Value per Berkshire Share | In Market Value per Berkshire Share | In S&P 500 with Dividends Included | ||
| 2001 | (6.2) | 6.5 | (11.9) | |
| 2002 | 10.0 | (3.8) | (22.1) | |
| 2003 | 21.0 | 15.8 | 28.7 | |
| 2004 | 10.5 | 4.3 | 10.9 | |
| 2005 | 6.4 | 0.8 | 4.9 | |
| 2006 | 18.4 | 24.1 | 15.8 | |
| 2007 | 11.0 | 28.7 | 5.5 | |
| 2008 | (9.6) | (31.8) | (37.0) | |
| 2009 | 19.8 | 2.7 | 26.5 | |
| 2010 | 13.0 | 21.4 | 15.1 | |
| 2011 | 4.6 | (4.7) | 2.1 | |
| 2012 | 14.4 | 16.8 | 16.0 | |
| 2013 | 18.2 | 32.7 | 32.4 | |
| 2014 | 8.3 | 27.0 | 13.7 | |
| 2015 | 6.4 | (12.5) | 1.4 | |
| Compound annual return 1965-2015 | 19.2% | 20.8% | 9.7% | |
| Total return | 798,981% | 1,598,284% | 11,355% | |
Source: Berkshire Hathaway Annual Report, 2015.
None of these motives are conclusive; we haven't resolved the problem and some readers will doubtless remain unconvinced. But there are reasons for considering investing through an active manager, so long as we trust them. If we come across somebody or a particular team whose track record is reassuring to us, then it may make sense to invest. If not, we can stick to passive strategies and we won't be putting our foot in it.
But it is worth emphasising that the search cannot be superficial. It is vital to have an in-depth understanding of the manager or team: their approach to business, investment, and, of course, their outlook on life. I find it a real struggle to recommend other managers, as I don't have the time to carry out a rigorous appraisal, but when I do so it is after getting to know them in as much detail as possible. If we are able to meet the asset manager in person, so much the better.
And having a good track record is not enough; it's crucial to know how it was constructed. All of us are subject to the whims of luck, and it's important to determine the role played by underlying logic in the results.
It's no easy task, but there are good active managers out there in the financial markets. At times the market becomes entranced by undeniable irrationality, and investors who are able to make the most of it will obtain very positive results.
Direct Investment in Shares
The last option is investing directly in stocks, analysing and buying the most attractive options. And why not? I know some superb private investors who have a long-term approach, enjoying the total freedom from only being accountable to themselves. Nowadays we have the tools to be able to perform our own analysis and execute our investments in stocks. The only thing that's needed is time and desire.
The best way for these potential investors to obtain good results is by focusing on stocks identified from the previously mentioned strategies; doing so consistently, without wavering. It's difficult, but not impossible. One starting point is to search for and analyse the stocks selected by investors with a respectable track record, who have spent a lot of time thinking about them. Part of the work in selecting stocks has already been done for us. From then on it's a question of developing one's own criteria and sticking to them consistently.
The next chapters are aimed at such audacious investors, but they may also be useful to anyone seeking an active management fund. We will get into the detail of how to overcome the problem. It can be done!
A final word before we go wild and start buying. Taxes are the main problem with direct investing. The tax burden on individual investors from buying shares directly is greater than when investing in a fund. This is at least the case in Europe, where investors in regulated funds generally pay next to no taxes – for capital gains or dividends associated with shares – so long as they maintain their savings in these funds. This helps to significantly delay any possible tax bill. Furthermore, in Spain, transfers between funds are tax-exempt, meaning that if we keep our savings within the funds loop we may end up never paying those taxes.
That is why I personally refrain from investing directly in equities. Obviously it's a big help managing my own mutual funds, since I can invest my savings in the funds we manage.
CONCLUSION
There are a lot of different ways to gain exposure to equities, which are the best asset to invest in. It's no easy task choosing between them, and the best option may well be a combination of them all: indexes, whether passive or fundamental, some active managers who appeal to us, and a few personal stock picks to keep us ‘on our toes’.
There is no magic formula for determining the exact proportion. For me there's no option but to invest 100% of my savings directly in equities – investing in my funds is equivalent to buying direct. However, I would recommend readers to start their analysis with index funds, gradually building up confidence to move towards more active alternatives as they get a better grip on the markets.
The right proportion for each reader will depend on their individual circumstances and, especially, the time they are willing to dedicate to the decision. The more effort we put in, the further we move away from passivity – almost by definition. But regardless of the ultimate mix, we can be sure that choosing to invest in equities will put us on the right path to maintain the purchasing power of our savings.
However, it's worth reiterating that there's no room to be frivolous by buying stocks without giving sufficient thought to it. This is a recipe for losing money. If we want to invest, each decision demands the same amount of time as if we were buying a car, a house, or deciding on a doctor for a complicated illness. If we are not prepared to make the time commitment, it's better to seek a good professional who can recommend us passive, semi-passive, or active management, ensuring we also select the right advisor.
APPENDIX
There follows an example from Barron's, illustrating the extent to which choosing between ‘passive’ products can end up becoming an ‘active’ business: The Pros' Picks.
Our Experts Share How They are Investing in Today's Confounding Market
| ETF/Ticker | Recent Price | Market Valuation (billions) | Comment |
| JOHN FORLINES' PICKS | |||
| iShares International High-Yield Bund/HVXU | $48.27 | $0.2 | Owns primarily junk bonds issued by European companies, but also has some Canadian and UK-based bonds |
| iShares U.S. Preferred Stock ETF/PFF | $38.88 | $15.2 | Preferred shares are largely issued by financial companies; the ETF yields 5.6% |
| iShares MSCIEAFE Minimum Volatility/EFAV | $66.73 | $6.7 | An international stock index that weeds out the market's most volatile stocks |
| iShares MSCI USA Minimum Volatility/USMV | 44.08 | 12.5 | Same as above in strategy. This ETF has been one of the most popular this year in terms of attracting new money |
| iShares MSCI Canada/EWC | 24.15 | 2.7 | A single-country ETF comprised mainly of financial and energy companies; should rise if oil prices rally further |
| iShares MSCI Australia/EWA | 19.51 | 1.6 | Australia is a commodity producer that exports heavily to China; this ETF is a way to avoid the risks of owning Chinese stocks directly |
| DAVID CLEARY'S PICKS | |||
| iShares Global Materials/MXI | $49.29 | $0.2 | Includes materials-sector companies around the globe, such as miners and chemical companies |
| iShares Latin America 40/ILF | 25.37 | 0.7 | Regional ETF that loads up on Brazil and Mexico; another diversified play on recovering commodity prices |
| PowerShares Fundamental High-Yield Corporate Bond Portfolio/PHB | 18.15 | 0.8 | An index-tracking fund that screens for debt issued by companies, based on cash flow and other measures, and excludes those with the lowest credit ratings |
| VanEck Vectors Fallen Angel High-Yield Bond/ANGL | 26.77 | 0.2 | Aims to squeeze yields from bonds issued by companies that have been recently downgraded |
| FRITZ FOLT'S PICKS | |||
| iShares Gold Trust/IAU | $12.34 | $8.0 | Large ETF that tracks the price of gold bullion; has a lower expense ratio than the SPDR Gold Shares (GLD) |
| VanEck Vectors Gold Miners/GDX | 24.18 | 6.9 | A basket of well-known miners including Barrick Gold and Newmont Mining, which tend to rise and fall faster than gold prices |
| iShares MSCI Brazil Capped/EWZ | 27.64 | 3.3 | The largest Brazil-themed ETF on the market, it trades in high volumes |
| EGShares India Infrastructure/INXX | 10.30 | 0.04 | An index tracker focused on a small group of Indian industrial and materials companies |
| PowerShares QQQ/QQQ | 105.02 | 34.3 | One of the oldest ETFs, it tracks the Nasdaq-100, synonymous with growth and tech stocks |
| Vanguard Small-Cap Value/VBR | 102.48 | 6.4 | A low-cost index of small US stocks with relatively lower valuations |
| WILL MCGOUGH'S PICKS | |||
| iShares Core MSCI Emerging Markets/IEMG | $40.12 | $10.6 | A low-cost emerging market index that includes small caps and counts South Korea as an ‘emerging’ country |
| SPDR MSCI Emerging Markets Quality Mix/QEMM | 47.94 | 0.1 | A low-cost, broad emerging-market ETF that blends stocks with profitability, low volatility, and value |
| iShares Core High Dividend/HDV | 78.75 | 5.1 | Dividend-themed, it aims to capture stocks with fundamentals that support better dividend and earnings potential than its peers |
| iShares Core MSCI EAFE/IEFA | 53.20 | 11.1 | Owns share of European, Australian, and Japanese stocks, but excludes US and Canadian stocks |
Source: Barron's, 7 May 2016.