11
Fog Computing Realization for Big Data Analytics
Farhad Mehdipour Bahman Javadi Aniket Mahanti and Guillermo Ramirez‐Prado
11.1 Introduction
Internets of Things (IoT) deployments generate large quantities of data that need to be processed and analyzed in real time. Current IoT systems do not enable low‐latency and high‐speed processing of data and require offloading data processing to the cloud (example applications include smart grid, oil facilities, supply chain logistics, and flood warning). The cloud allows access to information and computing resources from anywhere and facilitates virtual centralization of application, computing, and data. Although cloud computing optimizes resource utilization, it does not provide an effective solution for hosting big data applications [1]. There are several issues, which hinder adopting IoT‐driven services, namely:
- Moving large amounts of data over the nodes of a virtualized computing platform may incur significant overhead in terms of time, throughput, energy consumption, and cost.
- The cloud may be physically located in a distant data center, so it may not be possible to service IoT with reasonable latency and throughput.
- Processing large quantities of IoT data in real time will increase as a proportion of workloads in data centers, leaving providers facing new security, capacity, and analytics challenges.
- Current cloud solutions lack the capability to accommodate analytic engines for efficiently processing big data.
- Existing IoT development platforms are vertically fragmented. Thus, IoT innovators must navigate between heterogeneous hardware and software services that do not always integrate well together.
To address these challenges data analytics could be performed at the network edge (or the fog) – near where the data are generated – to reduce the amount of data and communications overhead [2–6]. Deciding what to save and what to use is as important as having the facility to capture the data. Rather than sending all data to a central computing facility such as the cloud, analytics at the edge of the physical world, where the IoT and data reside introduces an intermediate layer between the ground and the cloud. The main question is which data needs to be collected, which data needs to be cleaned and aggregated, and which data needs to be used for analytics and decision making. We proposed a solution called fog‐engine (FE) that addresses the above challenges through:
- On‐premise and real‐time preprocessing and analytics of data near where it is generated
- Facilitating collaboration and proximity interaction between IoT devices in a distributed and dynamic manner
Using our proposed solution, IoT devices are deployed in a fog closer to the ground that can have a beneficial interplay with the cloud and with each other. Users can use their own IoT device(s) equipped with our fog‐engine to easily become a part of a smart system. Depending on the scale of user groups, several fog‐engines can interplay and share data with peers (e.g. via Wi‐Fi) and offload data into the associated cloud (via the Internet) in an orchestrated manner.
The rest of this chapter is organized as follows. Section 11.2 provides background on big data analytics. Section 11.3 describes how our proposed fog‐engine can be deployed in the traditional centralized data analytics platform and how it enhances existing system capabilities. Section 11.4 explains the system prototype and the results of the evaluation of the proposed solution. Two case studies describing how the proposed idea works for different applications are described in Section 11.5. Section 11.6 discussed related work. Section 11.7 provides future research directions and Section 11.8 presents the conclusions.
11.2 Big Data Analytics
Companies, organizations, and research institutions capture terabytes of data from a multitude of sources including social media, customer emails and survey responses, phone call records, Internet clickstream data, web server logs, and sensors. Big data refers to the large amounts of unstructured, semistructured, or structured data flowing continuously through and around organizations [7]. The concept of big data has been around for years; most organizations nowadays understand that they can apply analytics to their data to gain actionable insights. Business analytics serves to answer basic questions about business operations and performance, while big data analytics is a form of advanced analytics, which involves complex applications with elements such as predictive models, statistical algorithms, and what‐if analyses powered by high‐performance analytics systems. Big data analytics examines large amounts of data to uncover hidden patterns, correlations, and other insights. Big data processing can be performed either in a batch mode or streamline mode. This means for some applications data will be analyzed and the results generated on a store‐and‐process paradigm basis [8]. Many time‐critical applications generate data continuously and expect the processed outcome on a real‐time basis such as stock market data processing.
11.2.1 Benefits
Big data analytics have the following benefits:
- Improved business. Big data analytics helps organizations harness their data and use it to identify new opportunities, which facilitates smarter business decisions, new revenue opportunities, more effective marketing, better customer service, improved operational efficiency, and higher profits.
- Cost reduction. Big data analytics can provide significant cost advantages when it comes to storing large amounts of data while doing business in more efficient ways.
- Faster and better decision making. Businesses are able to analyze information immediately, make decisions, and stay agile.
- New products and services. With the ability to gauge customer needs and satisfaction through analytics comes the power to give customers what they want.
11.2.2 A Typical Big Data Analytics Infrastructure
The typical components and layers of the big data analytics infrastructure are as follows [9].
11.2.2.1 Big Data Platform
The big data platform includes capabilities to integrate, manage, and apply sophisticated computational processing to the data. Typically, big data platforms include Hadoop 1 as an underlying foundation. Hadoop was designed and built to optimize complex manipulation of large amounts of data while vastly exceeding the price/performance of traditional databases. Hadoop is a unified storage and processing environment that is highly scalable to large and complex data volumes. You can think of it as big data's execution engine.
11.2.2.2 Data Management
Data needs special management and governance to be high‐quality and well‐governed before any analysis. With data constantly flowing in and out of an organization, it is important to establish repeatable processes to build and maintain standards for data quality. A significant amount of time might be spent on cleaning, removing anomalies, and transforming data to a desirable format. Once the information is reliable, organizations should establish a master data management program that gets the entire enterprise on the same page.
11.2.2.3 Storage
Storing large and diverse amounts of data on disk is more cost‐effective, and Hadoop is a low‐cost alternative for the archival and quick retrieval of large amounts of data. This open source software framework can store large amounts of data and run applications on clusters of commodity hardware. It has become a key technology to doing business due to the constant increase of data volumes and varieties, and its distributed computing model processes big data fast. An additional benefit is that Hadoop's open source framework is free and uses commodity hardware to store large quantities of data. Unstructured and semi‐structured data types typically do not fit well into traditional data warehouses that are based on relational databases focused on structured data sets. Furthermore, data warehouses may not be able to handle the processing demands posed by sets of big data that need to be updated frequently – or even continually, as in the case of real‐time data on stock prices, the online activities of website visitors or the performance of mobile applications.
11.2.2.4 Analytics Core and Functions
Data mining is a key technology that helps examine large amounts of data to discover patterns in the data – and this information can be used for further analysis to help answer complex business questions. Hadoop uses a processing engine called MapReduce to not only distribute data across the disks but to apply complex computational instructions to that data. In keeping with the high‐performance capabilities of the platform, MapReduce instructions are processed in parallel across various nodes on the big data platform, and then quickly assembled to provide a new data structure or answer set. Just as big data varies with the business application, the code used to manipulate and process the data can vary. For instance, for identifying the customers' satisfaction level on a particular product that they have bought, a text‐mining function might scrape through the users' feedback data and extract the expected information.
11.2.2.5 Adaptors
It is vital to ensure that existing tools in an organization can interact and exchange data by the big data analytics tool with the skill sets available in‐house. For example, Hive 2 is a tool that enables raw data to be restructured into relational tables that can be accessed via SQL‐based tools such as relational databases.
11.2.2.6 Presentation
Visualizing data using existing tools or customized tools allows the average business person to view information in an intuitive, graphical way, and extract insights for the process of decision‐making.
11.2.3 Technologies
The size and variety of data can cause consistency and management issues, and data silos can result from the use of different platforms and data stored in a big data architecture. In reality, there are several types of technology that work together to realize big data analytics. Integrating existing tools such as Hadoop with other big data tools into a cohesive architecture that meets an organization's needs is a major challenge for platform engineers and analytics teams, which have to identify the right mix of technologies and then put them together [10].
11.2.4 Big Data Analytics in the Cloud
Early big data systems were mostly deployed on‐premises, whereas Hadoop was originally designed to work on clusters of physical machines. With the currently available public clouds, Hadoop clusters can be set up in the cloud. An increasing number of technologies facilitate processing data in the cloud. For example, major Hadoop suppliers such as Cloudera 3 and Hortonworks 4 support their distributions of the big data framework on the Amazon Web Services (AWS) 5 and Microsoft Azure 6 clouds. The future state of big data will be a hybrid of on‐premise solution and the cloud [11].
11.2.5 In‐Memory Analytics
Hadoop's batch scheduling overhead and disk‐based data storage have made it unsuitable for use in analyzing live, real‐time data in the production environment. Hadoop relies on a file system that generates a lot of input/output files, and this limits performance of MapReduce. By avoiding Hadoop's batch scheduling, it can start up jobs in milliseconds instead of tens of seconds. In‐memory data storage dramatically reduces access times by eliminating data motion from the disk or across the network. SAS and Apache Ignite provide the Hadoop distributions featuring in‐memory analytics.
11.2.6 Big Data Analytics Flow
Big data analytics describes the process of performing complex analytical tasks on data that typically include grouping, aggregation, or iterative processes. Figure 11.1 shows a typical flow for big data processing [7]. The first step is to perform collection/integration of the data coming from multiple sources. Data cleaning is the next step that may consume large processing time, although it may significantly reduce the data size that leads to less time and effort needed for data analytics. The raw data are normally unstructured such that neither has a predefined data model nor is organized in a predefined manner. Thus, the data are transformed to semistructured or structured data in the next step of the flow. Data cleaning deals with detecting and removing errors and inconsistencies from data to improve its quality [12]. When multiple data sources need to be integrated (e.g., in data warehouses), the need for data cleaning significantly increases. This is because the sources often contain redundant data in different representations.

Figure 11.1 Typical data analytics flow.
One of the most important steps in any data processing task is to verify that data values are correct or, at the very least, conform to a set of rules. Data quality problems exist due to incorrect data entry, missing information, or other invalid data. For example, a variable such as gender would be expected to have only two values (M or F), or a variable representing heart rate would be expected to be within a reasonable range. A traditional ETL (extract, load, and transform) process extracts data from multiple sources, then cleanses, formats, and loads it into a data warehouse for analysis [13]. A rule‐based model determines how the data analytic tools handle data.
A major phase of big data processing is to perform discovery of data, which is where the complexity of processing data lies. A unique characteristic of big data is the way the value is discovered. It differs from conventional business intelligence, where the simple summing of known value generates a result. The data analytics is performed through visualizations, interactive knowledge‐based queries, or machine learning algorithms that can discover knowledge [14]. Due to the heterogeneous nature of the data, there may not be a single solution for the data analytics problem and thus, the algorithm may be short‐lived.
The increase in the volume of data raises the following issues for analytic tools:
- The amount of data increases continuously at a high speed, yet data should be up‐to‐date for analytics.
- The response time of a query grows with the amount of data, whereas the analysis tasks need to produce query results on large datasets in a reasonable amount of time [15].
11.3 Data Analytics in the Fog
Fog computing is a highly virtualized platform that provides compute, storage, and networking services between end devices and traditional cloud computing data centers, typically, but not exclusively located at the edge of the network. The fog is composed of the same components as in the cloud, namely, computation, storage, and networking resources. However, the fog has some distinctive characteristics that make it more appropriate for the applications requiring low latency, mobility support, real‐time interactions, online analytics, and interplay with the cloud [11, 16]. While data size is growing very fast, decreasing the processing and storage costs, and increasing network bandwidth make archiving the collected data viable for organizations. Instead of sending all data to the cloud, an edge device or software solution may perform a preliminary analysis and send a summary of the data (or metadata) to the cloud. For example, Google uses cloud computing to categorize photos for its Google Photos app. For a picture taken and uploaded to Google Photos, the app automatically learns and classifies with respect to the photo's context. A dedicated chip referred to as Movidius 7 with the capability of machine learning on the mobile devices, allows processing the information in real time, instead of in the cloud [17]. It is critical to decide what should be done near the ground, in the cloud, and in‐between.
11.3.1 Fog Analytics
Collecting and transferring all the data generated from IoT devices and sensors into the cloud for further processing or storage poses serious challenges on the Internet infrastructure and is often prohibitively expensive, technically impractical, and mostly unnecessary. Moving data to the cloud for analytics works well for large volumes of historical data requiring low‐bandwidth, but not for real‐time applications. With the emergence of the IoT, which enables real‐time, high data‐rate applications, moving analytics to the source of the data and enabling real‐time processing seems a better approach. Fog computing facilitates processing data before they even reach the cloud, shortening the communication time and cost, as well as reducing the need for huge data storage. In general, it is an appropriate solution for the applications and services that come under the umbrella of the IoT [18, 19].
With the fog providing low latency and context awareness, and the cloud providing global centralization, some applications such as big data analytics benefit from both fog localization and cloud globalization [11]. The main function of the fog is to collect data from sensors and devices, process the data, filter the data, and send the rest to the other parts for local storage, visualization, and transmission to the cloud. The local coverage is provided by the cloud, which is used as a repository for data that has a permanence of months and years, and which is the basis for business intelligence analytics.
Fog computing is still in its early stages and present new challenges such as fog architecture, frameworks and standards, analytics models, storage and networking resource provisioning and scheduling, programming abstracts and models, and security and privacy issues [20]. Fog analytics requires standardization of device and data interfaces, integration with the cloud, streaming analytics to handle continuous incoming data, and a flexible network architecture where real‐time data processing functions move to the edge. Less time‐sensitive data can still go to the cloud for long‐term storage and historical analysis. Other capabilities such as machine learning to enable performance improvement of IoT applications over time, and data visualization functions are the important features for the future.
Tang et al. [9] proposed an architecture based on the concept of fog for big data analytics in smart cities, which is hierarchical, scalable, and distributed, and supports the integration of a massive number of things and services. The architecture consists of four layers, where layer‐4 with numerous sensors is at the edge of the network, layer‐3 processes the raw data with many high‐performance and low‐power nodes, layer‐2 identifies potential hazards with intermediate computing nodes, and layer‐1 represents the cloud that provides global monitoring and centralized control. In [10], FogGIS a framework based on the fog computing was introduced for mining analytics from geospatial data. FogGIS had been used for preliminary analysis including compression and overlay analysis, and the transmission to the cloud had been reduced by compression techniques. Fog computing is also becoming more popular in healthcare as organizations introduce more connected medical devices into their health IT ecosystem [21]. Cisco has introduced Fog Data Services 8 that can be used to build scalable IoT data solutions.
11.3.2 Fog‐Engines
An end‐to‐end solution called the fog‐engine (FE) [22] provides on‐premise data analytics as well as the capabilities for IoT devices to communicate with each other and with the cloud. Figure 11.2 provides an overview of a typical FE deployment. The fog‐engine is transparently used and managed by the end user and provides the capability of on‐premise and real‐time data analytics.

Figure 11.2 Deployment of FE in a typical cloud‐based computing system.
Fog‐engine is a customizable and agile heterogeneous platform that is integrated to an IoT device. The fog‐engine allows data processing in the cloud and in the distributed grid of connected IoT devices located at the network edge.
It collaborates with other fog‐engines in the vicinity, thereby constructing a local peer‐to‐peer network beneath the cloud. It provides facilities for offloading data and interacting with the cloud as a gateway. A gateway enables devices that are not directly connected to the Internet to reach cloud services. Although the term gateway has a specific function in networking, it is also used to describe a class of device that processes data on behalf of a group or cluster of devices. Fog‐engine consists of modular Application Programming Interfaces (APIs) for supplying the above functionalities. Software‐wise, all fog‐engines utilize the same API, which is also available in the cloud to ensure vertical continuity for IoT developers.
11.3.3 Data Analytics Using Fog‐Engines
Figure 11.3 shows on‐premise data analytics being performed near the data source using fog‐engines before the data volume grows significantly. In‐stream data are analyzed locally in the FE while data of the FE is collected and transmitted to the cloud for offline global data analytics. In a smart grid, for example, a fog‐engine can help a user decide on the efficient use of energy. Whereas, the data of a town with thousands of electricity consumers are analyzed in the cloud of an energy supplier company to decide policies for energy use by the consumers. The analytics models employed in fog‐engines are updated based on the policies decided and communicated by the cloud analytics.

Figure 11.3 Data analytics using a fog‐engine before offloading to the cloud.
As the data are preprocessed, filtered, and cleaned in the fog‐engine prior to offloading to the cloud, the amount of transmitted data is lower than the data generated by IoT. Also, the analytics on fog‐engine is real‐time while the analytics on the cloud is offline. Fog‐engine provides limited computing power and storage compared with the cloud, however, processing on the cloud incurs higher latency. The fog‐engine offers a high level of fault tolerance as the tasks can be transferred to the other fog‐engines in the vicinity in the event of a failure.
Fog‐engine may employ various types of hardware such as multi‐core processor, FPGA, or GPU with fine granularity versus a cluster of similar nodes in the cloud. Each fog‐engine employs fixed hardware resources that can be configured by the user, whereas the allocated resources are intangible and out of user's control in the cloud. An advantage of fog‐engine is the capability of integration to mobile IoT nodes such as cars in an intelligent transportation system (ITS) [23]. In this case, multiple fog‐engines in close proximity dynamically build a fog in which fog‐engines communicate and
exchange data. Cloud offers a proven model of pay‐as‐you‐go while fog‐engine is a property of the user. Depending on the IoT application, in the case of a limited access to power sources, fog‐engine may be battery‐powered and needs to be energy‐efficient while the cloud is supplied with a constant source of power. Table 11.1 compares fog‐engines with cloud computing.
Table 11.1 Data analytics using a fog‐engine and the cloud.
| Characteristic | Fog‐engine | Cloud |
| Processing hierarchy | Local data analytics | Global data analytics |
| Processing fashion | In‐stream processing | Batch processing |
| Computing power | GFLOPS | TFLOPS |
| Network Latency | Milliseconds | Seconds |
| Data storage | Gigabytes | Infinite |
| Data lifetime | Hours/Days | Infinite |
| Fault‐tolerance | High | High |
| Processing resources and granularity | Heterogeneous (e.g., CPU, FPGA, GPU) and Fine‐grained | Homogeneous (Data center) and coarse‐grained |
| Versatility | Only exists on demand | Intangible servers |
| Provisioning | Limited by the number of fog‐engines in the vicinity | Infinite, with latency |
| Mobility of nodes | Maybe mobile (e.g. in the car) | None |
| Cost Model | Pay once | Pay‐as‐you‐go |
| Power model | Battery‐powered/Electricity | Electricity |
11.4 Prototypes and Evaluation
We have developed and prototyped the hardware and software parts of FE architecture which we describe in the following sections. We have also conducted extensive experiments considering different deployments of the fog‐engine in the system pipeline.
11.4.1 Architecture
As the fog‐engine is integrated with the IoT, which mainly employs low‐end devices, we need to ascertain that (i) it is agile and transparent, and (ii) adding fog‐engine up to the IoT devices has no negative impact on the existing system. The fog‐engine is composed of three units:
- An analytics and storage unit for preprocessing data (i.e. cleaning, filtering, etc.), data analytics, as well as data storage.
- A networking and communication unit consisting of the network interfaces for peer‐to‐peer networking and communication to the cloud and the IoT.
- An orchestrating unit to keep fog‐engines synchronized with each other and the cloud.
Figure 11.4(a) shows a general architecture of the fog‐engine. Figure 11.4(b) shows the detailed FE structure. It uses several common interfaces for acquiring data through universal serial bus (USB), Wi‐Fi for mid‐range, and Bluetooth for small‐range communication with other devices, Universal Asynchronous Receiver/Transmitter (UART), Serial Peripheral Interface (SPI) bus, and general‐purpose input/output (GPIO) pins. The data may be obtained from sensor devices, other IoT devices, web, or local storage. The raw or semistructured data go through preprocessing units such as cleaning, filtering, and integration as well as extract, load, and transform (ETL). A library keeps the rules, which are used for data manipulation. For example, for the data generated by a smart meter on the energy consumption of a house, only positive values less than a few kilowatts per hour is acceptable. The preprocessed data can be transmitted or interchanged with a peer engine via peer‐to‐peer networking interface unit. In a cluster of fog‐engines, one with higher processing capacity may act as a cluster head onto which other fog‐engines offload the data. The orchestrating unit handles cluster formation and data distribution across a cluster of fog‐engines. The cloud interface module is a gateway that facilitates communication between the fog‐engine and cloud. The FE scheduler and task manager moderate all the above‐mentioned units.

Figure 11.4 (a) General architecture of fog‐engine; (b) A detailed architecture for the communication unit.
11.4.2 Configurations
The fog‐engine is employed in different settings with various configurations as follows:
11.4.2.1 Fog‐Engine as a Broker
Figure 11.5(a) shows how a fog‐engine is configured to behave as a broker that receives data from a sensor, filters, and cleans the input, and then transmits the data to the cloud. The interface to the sensor is based on inter‐integrated circuit (I2C) protocol. The data captured by the sensor is read by the I2C interface of the fog‐engine. While, in a traditional scenario, the data are transmitted directly to the cloud without further processing.

Figure 11.5 Various configurations of fog‐engine: (a) as a broker; (b) as a primary data analyzer; (c) as a server.
11.4.2.2 Fog‐Engine as a Data Analytics Engine
By involving the data analytic unit of fog‐engine (Figure 11.5(b)), the data are analyzed and stored in a local storage until storage limit exceeds or any false data are detected. In this unit, a model is initially fitted for the first chunk of data (e.g., 100 samples), and this model is then used for identifying and removing outliers. The model is regularly updated (e.g., for every 100 samples) with the newer chunks of data. In this case, there is no need for streaming data between a fog‐engine and the cloud, which requires a constant channel with the cloud that incurs more cost and steady network connectivity. Instead, data can be offloaded at regular time intervals. Furthermore, the data are locally analyzed in the fog‐engine, which reduces the complexity of analytics on the cloud that requires handling the data generated by many sources.
11.4.2.3 Fog‐Engine as a Server
In the third configuration, multiple fog‐engines form a cluster while one of them is a cluster head. The cluster head receives data from all sensors, analyzes the data, and transmits the data to the cloud. In this case, all three communication units of fog‐engine are engaged (Figure 11.5(c)). As an advantage of this configuration, there is no need for establishing multiple independent channels between fog‐engines and the cloud as the cluster head fog‐engine manages the only channel with the cloud. In this scenario, like above cases, besides having a smaller volume of data with fog‐engine, an additional advantage of using a fog‐engine is that the data collected from multiple sensor devices can be aggregated and transmitted to cloud in a single message by the fog‐engine as a cluster head.
This configuration will save storage space and energy consumption on devices as well. In a clustered structure, it is possible to minimize the number of messages and use the maximum allowed message size, which reduces the number of message transmissions, hence causing a reduction in the cloud costs.
11.4.2.4 Communication with Fog‐Engine versus the Cloud
We have conducted several experiments to examine the functionality and performance of the fog‐engine. In these experiments, as depicted in Figure 11.6, we have implemented two versions of the fog‐engine on a Raspberry Pi 3 board, i.e., fog‐engine (Rpi), and on a desktop computer, i.e., fog‐engine (PC). All the FE modules are implemented with Python. Two different MQTT brokers are used for the sending/receiving data packets including Mosquitto 9 and VerneMQ. 10 Correspondingly, the brokers are located on the IoT board or on the desktop computer. We have utilized three different clouds, including The Hive Cloud 11 , Eclipse Cloud 12 , and CloudMQTT. 13 The transmission time is the time required for sending a packet and receiving an acknowledgment. The packet size differs from a few bytes to more than 4 MB. The experiments have been repeated 100 times for each packet size, and the average time is measured.

Figure 11.6 Fog‐engine collects data and communicates with the cloud.
Figure 11.7 shows that the transmission time from fog‐engine to the cloud exponentially increases with increasing packet sizes. We observe that the transmission time for packets larger than 64 KB for Eclipse Cloud and larger than 200 KB for Hive Cloud and CloudMQTT substantially increases. Also, fog‐engine to FE communication is much faster compared to fog‐engine‐cloud, particularly for large packet sizes (i.e. larger than 64 KB). For packets smaller than 64 KB or 200 KB, this time is less than a second while peer communication between fog‐engines has still lower latency. Also, the fog‐engine implemented on a desktop PC with more powerful computing and networking resources than the Rpi board performs faster. Among the evaluated clouds, since Hive does not allow packets larger than 2 MB, the packets larger than 2 MB is sent in multiple steps. We observe that exchanging packets larger than 32 MB between fog‐engines is not possible, which is most likely due to hardware and memory limitations of the IoT boards. Consequently, a clustered structure of devices with a fog‐engine as the cluster head is a better option in terms of the reduced number of messages transmitted to the cloud resulting in reduced costs, and the increased number of devices that can be supported for a certain available bandwidth.

Figure 11.7 Data transmission time between FEs and cloud for various packet sizes up to 4 MB.
11.5 Case Studies
In this section, we will provide two case studies to show how the proposed fog‐engine can be utilized in different applications.
11.5.1 Smart Home
In this case study, we developed a smart home application including a heart rate monitoring and activity monitoring system. Figure 11.8 shows the deployment of a fog‐engine in the system while it operates as an interface between the user and the cloud. We have implemented a prototype of fog‐engine on a Raspberry Pi 3 board with Python. All modules communicate over a Wi‐Fi network. Fog‐engine can play different roles as follows.

Figure 11.8 The deployment of fog‐engines in the system pipeline.
11.5.1.1 Fog‐Engine as a Broker
In this setting, a sensor captures heart rate of a monitored patient who is residing at home. The data are read by the I2C interface of the fog‐engine. It is then converted to the numeric format and goes through a filtering function. The heart rate sampling rate is 50 samples per second. The 20 msec time interval is sufficient for performing required processing on the collected data. According to the experiments, around 40% of heart rate data is discarded due to replication or being out of range which still leaves enough number of samples per time unit. The data are finally transmitted to Thingspeak Cloud 14 using their API. Using the fog‐engine reduces the size of data; hence, less usage of network and processing resources as well as less latency.
Considering that the pricing for the cloud is typically based on the number of messages processed and stored in a period, we evaluate the efficiency of the system with and without fog‐engine. We assume the maximum bandwidth provided is 1 MB/s. Each sample size (e.g. heart rate data) is 10 bytes that includes an index for the sensor, timestamp, and a value of the heart rate. In the current scenario, a separate channel is created for each sensor, so the data transfer rates are similar with and without fog‐engine. However, the size of data that is transferred via fog‐engine is 40% less. For the provided bandwidth of 1MB/s, the maximum number of devices (channels) that can be covered with and without fog‐engine is 2000 and 3330, respectively.
11.5.1.2 Fog‐Engine as a Data Analytic Engine
By involving the data analytic unit of fog‐engine (Figure 11.5(b)), the data are analyzed and stored in a local storage until storage limit exceeds or any misbehavior in the heart rate is detected. In this unit, a model is initially fitted for the first chunk of data (with around 100 samples), and this model is then used for identifying and removing outliers. The model is regularly updated (every 100 samples) with the newer chunks of data. Data can be offloaded to the cloud at regular time intervals. Furthermore, the data are locally analyzed in the fog‐engine that reduces the complexity of analytics on the hospital cloud that needs to handle data of many patients. Referring to the assumptions already given, the system with and without fog‐engine performs similarly, and the size of transferred data is 40% lesser with the fog‐engine.
11.5.1.3 Fog‐Engine as a Server
In the third configuration, multiple fog‐engines form a cluster while one of them is a cluster head. We have used Arduino Nano boards for acquiring data from the heart rate sensors and sending to the cluster head, which is implemented on a more powerful board (Raspberry Pi 3). The cluster head receives data from all sensors, analyzes, and transmits the data to the cloud. In this case, all the three communication units of fog‐engine are engaged (Figure 11.5(c)). An advantage of this configuration is that there is no need for establishing multiple independent channels between fog‐engines and the cloud, as the cluster head fog‐engine manages the only channel with the cloud.
In this scenario, besides having a smaller volume of data with fog‐engines, an additional advantage of using fog‐engines is that the data collected from multiple sensor devices can be aggregated and transmitted to the cloud in a single message by the fog‐engine as a cluster head. In a clustered structure, it is possible to minimize the number of messages and use the maximum allowed message size. This reduces the number of message transmissions, and consequently reducing the cloud costs. For the given 1 MB data bandwidth, if 100 sensors are clustered with a fog‐engine, whole data generated in one second, which is 3 KB, can be transmitted in a single or in more number of packets. While in the case without fog‐engine, the data should be directly sent through in much smaller packet sizes (e.g. 10 bytes) that leads to a larger number of messages. This requires 50 message/sec transmission rate that increases the cost of using the cloud. With a cluster of 3330 devices, the collected data can be packed into a single 1 MB packet in the fog‐engine. Table 11.2 compares different FE configurations in terms of different parameters such as the ratio of data size managed, the maximum number of devices that can be supported in each case, etc.
Table 11.2 Comparison of various schemes with and without a fog‐engine, where bandwidth, sample rate, and sample size are 10 MB/s, 50 samples/s, and 10 bytes, respectively.
| No FE | FE as broker | FE as data analytic engine | FE as server | |
| Ratio of data size (with FE/without FE) | 1 | 0.6 | 0.6 | 0.6 |
| Max. no. of devices supported (with FE, without FE) | 2,000 | 3,330 | 3,330 | 3,330 |
| Filtering/analytic | No | Yes | Yes | Yes |
| Offline processing/transmission | No | No | Yes | Yes |
| Maximum packet size | No | No | No | Yes |
11.5.2 Smart Nutrition Monitoring System
In the second case study, we devise a smart nutrition monitoring system that utilizes IoT sensors, fog‐engines, and hierarchical data analytics to provide an accurate understanding of the dietary habits of adults, which can be used by users themselves as a motivator for change behavior and by dieticians to provide better guidance to their patients [24]. The proposed architecture is depicted in Figure 11.9. The proposed smart nutrition monitoring system is composed of a kiosk where diverse sensors are installed. This kiosk will be equipped with various IoT sensors and fog‐engine to collect weight, volume, and structure (e.g., molecular pattern) of the food. The only action required from users is to authenticate with the kiosk (via a mobile app) and deposit the food in the kiosk for a couple of seconds while relevant information is obtained by the sensors. Once data are obtained, users can cease interaction with the kiosk and can proceed with their daily activities. Therefore, the data collection will be done with a noninvasive technique where the user does not need to enter any information about the food. There are cameras located in the kiosk to capture photos from the food from different angles and transmit them to the cloud servers to generate a 3D model of the food, which is used for food volume estimation. The kiosk has a fog‐engine to process and communicate the collected data with other components of the system.

Figure 11.9 Architecture of the smart nutrition monitoring system.
The data analytics module is responsible for statistical analysis and machine learning activities in the architecture. This is used to generate reports and analyses that are relevant to users and dieticians and to identify the food that has been presented by users. The input and output for this module are datastore with two databases to store raw collected data as well as the nutritional value of the food. The visualization module displays charts showing consumption of different nutrients over time and other forms of complex data analysis that are carried out by the data analytics module.
To demonstrate the viability and feasibility of our approach, we have developed a prototype of the smart nutrition monitoring system as shown in Figure 11.10. The prototype version of the data collection points, e.g., the Kiosk, utilizes Raspberry Pi 3 Model B boards (Quad Core 1.2GHz CPU, 1GB of RAM) as fog‐engine to interact with sensors and the rest of the architecture. There are five cameras with 8‐megapixel resolution, each of which is augmented to one Raspberry Pi. As the sensor device, we used the SITU Smart Scale 15 that is a smart food scale that communicates with other devices via Bluetooth. The fog‐engine is used to connect to the scale, receive the photos from the Raspberry Pis connected to cameras, and to interface with the architecture. To better integrate with the scale, the fog‐engine in our prototype had its Operating system replaced by emteria.OS 16 (Android‐compatible Operating System that is optimized to run on Raspberry Pi 3). The process of information capture is triggered by users via a mobile app we developed. In this method, previously registered users of the system deposit the food dish in the kiosk, authenticate with the app and tap a button on the app, which sends a message to a process running on the fog‐engine, indicating that the data collection process should start. The fog‐engine then collects the reading from the scale and from the other Raspberry Pis and sends all the relevant information to the smart nutrition monitoring engine via a WiFi connection. The fog‐engine sends the food images taken by five cameras to a private cloud, where there is AgiSoft PhotoScan Pro 17 software to generate the 3D models. This will be used to estimate food volume in the smart nutrition monitoring engine in the public cloud.
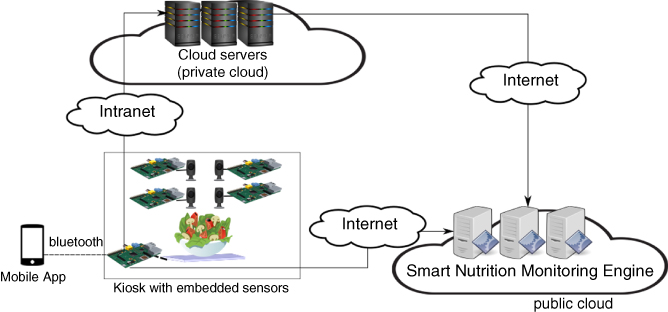
Figure 11.10 Prototype of the smart nutrition monitoring system.
Besides data obtained from sensors in the kiosk, another source of FE data is the external food nutrient database as depicted in Figure 11.9. Our prototype utilizes the FatSecret database 18 , which is accessed via a RESTful API. The interaction with FatSecret is triggered when the data analytics module returns to the collections management module a string with a food name (which can be the result of an analysis about the likely content of the food presented by the user). This name is used for a
search in the FatSecret database (via the API) to determine nutrition facts about the food. This information is then stored in the datastore. All the nutrition data collected and stored in the database are used to generate daily, weekly, and monthly charts of intake of different nutrients and calories, for dieticians and users. Dieticians can only access data from users that are their patients (not patients from other dieticians).
11.6 Related Work
Recently, major cloud providers have introduced new services for IoT solutions with different features and characteristics. Table 11.3 shows the list of IoT solutions from five well‐known cloud providers. Data collection is one of the basic aspects of these solutions, which specify the communication protocols between the components of an IoT software platform. Since IoT systems might have millions of nodes, lightweight communication protocols such as MQTT have been provided to minimize the network bandwidth. Security is another factor in these solutions where a secure communication is needed between IoT devices and the software system. As one can see in this table, link encryption is a common technique to avoid potential eavesdropping in the system.
Table 11.3 List of IOT solutions from five major cloud providers.
| AWS | Microsoft | IBM | Alibaba | ||
| Service | AWS IoT | Azure IoT Hub | IBM Watson IoT | Google IoT | AliCloud IoT |
| Data collection | HTTP, WebSockets, MQTT | HTTP, AMQP, MQTT and custom protocols (using protocol gateway project) | MQTT, HTTP | HTTP | HTTP |
| Security | Link encryption (TLS), authentication (SigV4, X.509) | Link encryption (TLS), authentication (Per‐device with SAS token) | Link encryption (TLS), authentication (IBM Cloud SSO), identity management (LDAP) | Link Encryption (TLS) | Link Encryption (TLS) |
| Integration | REST APIs | REST APIs | REST and real‐time APIs | REST APIs, gRPC | REST APIs |
| Data analytics | Amazon machine learning model (Amazon QuickSight) | Stream analytics, machine learning | IBM Bluemix data analytics | Cloud dataflow, BigQuery, Datalab, Dataproc | MaxCompute |
| Gateway architecture | Device gateway (in Cloud) | Azure IoT gateway (on‐premises gateway, beta version) | General gateway | General gateway (on‐premises) | Cloud gateway (in cloud) |
Integration is the process of importing data to the cloud computing systems, and as mentioned in Table 11.3, REST API is a common technique to provide access to the data and information from cloud platforms. After collecting data from IoT devices, data must be analyzed to extract knowledge and meaningful insights. Data analytics can be done in several ways and each cloud provider has various packages and services including machine learning algorithms, statistical analysis, data exploration, and visualizations.
The last row in Table 11.3 is the gateway architecture, which is the main scope of this chapter. The gateway is the layer between IoT devices and cloud platform. Most providers only provide general assumptions and specifications about the gateway that will be located on the cloud platform. There are some early‐stage developments for an on‐premises gateway from Microsoft and Google, but none of them have implemented that completely with appropriate integration. As mentioned earlier, fog‐engine can be a solution as the gateway that provides on‐premise data analytics as well as capabilities for the IoT devices to communicate with each other and with the cloud.
On‐premise data analytics is another type of service that has recently received lots of attention. Microsoft Azure Stack [25] is a new hybrid cloud platform product that enables organizations to deliver Azure services from their own data center while maintaining control of data center for hybrid cloud agility. CardioLog Analytics 19 offers on‐premise data analytics that runs on user‐side servers. Oracle [26] delivers Oracle infrastructure as a service on premises with capacity on demand that enables customers to deploy Oracle engineered systems in their data centers. IBM Digital Analytics for on‐premises is the core, web analytics software component of its digital analytics accelerator solution. However, the analytic software is installed on high‐performance IBM application servers. IBM PureData system for analytics is a data warehouse appliance powered by Netezza technology [27].
Cisco ParStream 20 has been engineered to enable the immediate and continuous analysis of real‐time data as it is loaded. Cisco ParStream features scalable, distributed hybrid database architecture to analyze billions of records at the edge, and has patented indexing and compression capabilities that minimize performance degradation and process data in real time. ParStream can be integrated with machine learning engines to support advanced analytics. It makes use of both standard multicore CPUs and GPUs to execute queries and uses time‐series analytics to combine analyzing streaming data with massive amounts of historical data. It uses alerts and actions to monitor data streams, create and qualify easy‐to‐invoke procedures that generate alerts, send notifications, or execute actions automatically. It derives models and hypotheses from large amounts of data by applying statistical functions and analytical models using advanced analytics.
Fog computing has received much attention in the academic community. Researchers have proposed various applications of fog computing in diverse scenarios such as health monitoring, smart cities, and vehicular networks [28]. As fog computing gains more traction, there have been efforts to improve the efficiency of this computing paradigm. Yousefpour et al. [29] proposed a delay‐minimizing policy for fog devices. They developed an analytical model to evaluate service delay in the interplay between IoT devices, the Fog, and the cloud. The analytical model was supported by simulation studies. Alturki et al. [30] discussed analysis methods that can be distributed and executed on fog devices. Experiments conducted using Raspberry Pi boards showed that data consumption was reduced, although it led to lower accuracy in results. The authors highlighted the need to have a global view of the data to improve the accuracy of results. Jiang et al. [31] presented design adaptations in the cloud computing orchestration framework to fit into the fog computing scenario. Liu et al. [32] presented a framework for fog computing that encompasses resource allocation, latency reduction, fault tolerance, and privacy.
Liu et al. [32] highlighted the importance of security and privacy in fog computing. They suggested that biometrics‐based authentication would be beneficial in fog computing. They also raised the issue of challenges in implementing intrusion detection in large‐scale and mobile fog environments. They emphasized the need for running privacy‐preserving algorithms such as homomorphic encryption between the fog and the cloud to safeguard privacy. Mukherjee et al. highlighted the need for new security and privacy solutions for the fog because existing solutions for the cloud cannot be directly applied to the Fog. They identified six research challenges in fog security and privacy, namely, trust, privacy preservation, authentication and key agreement, intrusion detection systems, dynamic join and leave of fog nodes, and cross‐issue and fog forensic.
There have been some efforts at realizing an infrastructure to better integrate the Fog, the cloud, and IoT devices. Chang et al. [33] proposed the Indie Fog infrastructure that utilizes consumers' network devices for providing fog computing environment for IoT service providers. The Indie Fog can be deployed in various ways. A clustered Indie Fog would perform preprocessing of data collected from sensors and other devices. The infrastructure Indie Fog would be deployed in static sensor devices and provide the infrastructure for various services such as prompt data acquisition and processing. Vehicular Indie Fog would facilitate Internet of Vehicles, while Smartphone Indie Fog servers deployed on smartphones could process data on the phones. The Indie Fog system would consist of three parts, namely, the client, the server, and the registry.
Fog computing provides several interesting applications in the healthcare field. Traditional cloud‐based healthcare solutions suffer from longer latency and responses times. Fog computing can potentially reduce this delay by utilizing edge devices to perform analysis, communication, and storage of the healthcare data. Cao et al. [34] employed a fall detection monitoring application for stroke patients using fog computing where the fall detection task is split between edge devices (e.g., smartphones) and the cloud. Sood and Mahajan [35] designed a fog and cloud‐based system to diagnose and prevent the outbreak of Chikungunya virus, which is transmitted to humans via the bite of mosquitoes. Their system is composed of three layers: data accumulation (for collecting health, environment, and location data from the users), fog layer (for data classification into infected and other categories and alert generation), and cloud layer (for storing and processing data that cannot be managed or processed by the fog layer). Through experimental evaluation, the system was found to have high accuracy and low response times. Dubey et al. [21] presented a service‐oriented fog computing architecture for in‐home healthcare service. They utilized Intel Edison board as the fog computing deployment for their experiments. The first experiment involved analyzing speech motor disorders. The fog device processed the speech signals and the extracted patterns are sent to the cloud. The second experiment involved processing electrocardiogram (ECG) data. The authors concluded that their fog system reduced logistics requirements for telehealth applications, cloud storage, and transmission power of edge devices. Vora et al. [36] presented a fog‐based monitoring system for monitoring patients with chronic neurological diseases using clustering and cloud‐based computation. A wireless body area network collected vital health information and sent the data to a cloudlet. 21 The cloudlet cleans and segments the data and helps in decision making. Data is also sent to the cloud for classification and results are sent back to the cloudlet to detect anomalies in the processing at the fog. Performance evaluation showed that fog computing achieved higher bandwidth efficiency and lower response times. Guibert et al. [37] propose using content‐centric network approach combined with fog computing for communication and storage efficiency. Their simulation results showed that delays reduced in case of fog‐based content‐centric networks compared to traditional content‐centric networks.
There has been limited work on implementation of fog computing. For instance, a simple gateway for E‐health has been implemented in a desktop PC [38]. They investigated the possibility of using the system for signal processing to decrease the latency. In [39] a gateway model for to improve the QoS in online gaming is implemented. They revealed that using the fog computing model could improve the response time by 20% for the game users. While realization of fog computing is in the early stage, fog‐engine has been designed and implemented to be adapted in various applications for big data analytics. This realization has an excellent potential to be explored and developed further for other business and commercial applications.
11.7 Future Research Directions
There are some challenges against adopting fog‐engines in big data analytics that should be considered. The benefits of the proposed solution ought to be weighed against its costs and risks, which will vary from one use case to another. Although sensors and IoT devices are normally inexpensive, the solution involving fog‐engines could be expensive if many of them are involved in a wide area. Thus, further research is required with respect to the scalability and the cost of the solution.
Security is another issue, as adding fog as a new technology layer introduces another potential point of vulnerability. In addition, data management may need adjustments to address privacy concerns. Therefore, fog‐engines should be part of a holistic data strategy so there are clear answers to fundamental questions such as what data can be collected, and how long the data should be retained.
Although fog‐engines can be configured as redundant resources, reliability is still an important issue where we have failures in different components of the system. Given that fog‐engines might be adapted for different applications, reliability mechanism should be changed based on the application requirements. As mentioned in Table 11.1, fog‐engine can be battery operated so energy optimization will be a major challenge. Executing data analytics in the fog‐engine is a power consuming task, so energy efficiency must be implemented, especially when there is a large number of them deployed.
Finally, resource management is a challenging task for fog‐engine. A resource manager should be hierarchical and distributed where the first level of big data analytics is conducted in the fog‐engine and the rest will be done in the cloud. Therefore, provisioning of resources in fog‐engines for big data analytics with the requested performance and cost will be a trade‐off to solve by a resource manager.
11.8 Conclusions
Data analytics can be performed near where the data are generated to reduce data communications overhead as well as data processing time. This will introduce a new type of hierarchical data analytics where the first layer will be in the fog layer and the cloud will be the last layer. Through our proposed solution, fog‐engine, it is possible to enable IoT applications with the capability of on‐premise processing that results in multiple advantages such as reduced size of data, reduced data transmission, and lower cost of using the cloud. fog‐engine can play various roles depending on its purpose and where in the system it is deployed. We also presented two case studies where fog‐engine has been adapted for the smart home as well as smart monitoring nutrition system. There are several challenges and open issues, including resource scheduling, energy efficiency, and reliability, which we intend to investigate in the future.
References
- 1 A.V. Dastjerdi, H. Gupta, R. N. Calheiros, S.K. Ghosh, and R. Buyya. Fog computing: Principles, architectures, and applications. Book Chapter in the Internet of Things: Principles and Paradigms, Morgan Kaufmann, Burlington, Massachusetts, USA, 2016.
- 2 M. Satyanarayanan, P. Simoens, Y. Xiao, P. Pillai, Z. Chen, K. Ha, W. Hu, and B. Amos. Edge analytics in the Internet of Things. IEEE Pervasive Computing, 14(2): 24–31, 2015.
- 3 W. Shi, J. Cao, and Q. Zhang, Y. Li, and L. Xu. Edge computing: Vision and challenges. IEEE Internet of Things Journal, 3(5): 637–646, 2016.
- 4 L. M. Vaquero and L. Rodero‐Merino. Finding your way in the fog: Towards a comprehensive definition of fog computing. SIGCOMM Comput. Commun. Rev., 44(5): 27–32, 2014.
- 5 S. Yi, C. Li, Q. Li. A survey of fog computing: concepts, applications and issues. In Proceedings of the 2015 Workshop on Mobile Big Data. pp. 37–42. 2015.
- 6 S. Yi, C. Li, and Q. Li. A survey of fog computing: concepts, applications and issues. In Proceedings of the Workshop on Mobile Big Data (Mobidata '15). 2015.
- 7 F. Mehdipour, H. Noori, and B. Javadi. Energy‐efficient big data analytics in datacenters. Advances in Computers, 100: 59–101, 2016.
- 8 B. Javadi, B. Zhang, and M. Taufer. Bandwidth modeling in large distributed systems for big data applications. 15th International Conference on Parallel and Distributed Computing, Applications and Technologies (PDCAT), pp. 21–27, Hong Kong, 2014.
- 9 B. Tang, Z. Chen, G. Hafferman, T. Wei, H. He, Q. Yang. A hierarchical distributed fog computing architecture for big data analysis in smart cities. ASE BD&SI '15 Proceedings of the ASE BigData and Social Informatics, Taiwan, Oct. 2015.
- 10 R.K. Barik, H. Dubey, A.B. Samaddar, R.D. Gupta, P.K. Ray. FogGIS: Fog Computing for geospatial big data analytics, IEEE Uttar Pradesh Section International Conference on Electrical, Computer and Electronics Engineering (UPCON), pp. 613–618, 2016.
- 11 F. Bonomi, R. Milito, J. Zhu, and S. Addepalli. Fog computing and its role in the Internet of Things. In Proceedings of the first edition of the MCC workshop on mobile cloud computing, pp. 13–16, Helsinki, Finland, August 2012.
- 12 E. Rahm, H. Hai Do. Data cleaning: Problems and current approaches. IEEE Data Eng. Bull., 23(4): 3–13, 2000.
- 13 Intel Big Data Analytics White Paper. Extract, Transform and Load Big Data with Apache Hadoop, 2013.
- 14 B. Di‐Martino, R. Aversa, G. Cretella, and A. Esposito. Big data (lost) in the cloud, Int. J. Big Data Intelligence, 1(1/2): 3–17, 2014.
- 15 M. Saecker and V. Markl. Big data analytics on modern hardware architectures: a technology survey, business intelligence. Lect. Notes Bus. Inf. Process, 138: 125–149, 2013.
- 16 A.V. Dastjerdi and R. Buyya. Fog computing: Helping the Internet of Things realize its potential. Computer, 49(8) (August): 112–116, 2016.
- 17 D. Schatsky, Machine learning is going mobile, Deloitte University Press, 2016.
- 18 F. Bonomi, R. Milito, J. Zhu, and S. Addepalli. Fog computing and its role in the Internet of Things. MCC, Finland, 2012.
- 19 A. Manzalini. A foggy edge, beyond the clouds. Business Ecosystems (February 2013).
- 20 M. Mukherjee, R. Matam, L. Shu, L> Maglaras, M.A. Ferrag, N. Choudhury, and V. Kumar. Security and privacy in fog computing: Challenges. IEEE Access, 5: 19293–19304, 2017.
- 21 H. Dubey, J. Yang, N. Constant, A.M. Amiri, Q. Yang, and K. Makodiya. Fog data: Enhancing telehealth big data through fog computing. In Proceedings of the ASE Big Data and Social Informatics, 2015.
- 22 F. Mehdipour, B. Javadi, A. Mahanti. FOG‐engine: Towards big data analytics in the fog. In Dependable, Autonomic and Secure Computing, 14th International Conference on Pervasive Intelligence and Computing, pp. 640–646, Auckland, New Zealand, August 2016.
- 23 H.J. Desirena Lopez, M. Siller, and I. Huerta. Internet of vehicles: Cloud and fog computing approaches, IEEE International Conference on Service Operations and Logistics, and Informatics (SOLI), pp. 211–216, Bari, Italy, 2017.
- 24 B. Javadi, R.N. Calheiros, K. Matawie, A. Ginige, and A. Cook. Smart nutrition monitoring system using heterogeneous Internet of Things platform. The 10th International Conference Internet and Distributed Computing System (IDCS 2017). Fiji, December 2017.
- 25 J. Woolsey. Powering the Next Generation Cloud with Azure Stack. Nano Server and Windows Server 2016, Microsoft.
- 26 Oracle infrastructure as a service (IaaS) private cloud with capacity on demand. Oracle executive brief, Oracle, 2015.
- 27 L. Coyne, T. Hajas, M. Hallback, M. Lindström, and C. Vollmar. IBM Private, Public, and Hybrid Cloud Storage Solutions. Redpaper, 2016.
- 28 M.H. Syed, E.B. Fernandez, and M. Ilyas. A Pattern for Fog Computing. In Proceedings of the 10th Travelling Conference on Pattern Languages of Programs (VikingPLoP '16). 2016.
- 29 A. Yousefpour, G. Ishigaki, and J.P. Jue. Fog computing: Towards minimizing delay in the Internet of Things. 2017 IEEE International Conference on Edge Computing (EDGE), Honolulu, USA, 2017, pp. 17–24.
- 30 B. Alturki, S. Reiff‐Marganiec, and C. Perera. A hybrid approach for data analytics for internet of things. In Proceedings of the Seventh International Conference on the Internet of Things (IoT '17), 2017.
- 31 Y. Jiang, Z. Huang, and D.H.K. Tsang. Challenges and Solutions in Fog Computing Orchestration. IEEE Network, PP(99): 1–8, 2017.
- 32 Y. Liu, J. E. Fieldsend, and G. Min. A Framework of Fog Computing: Architecture, Challenges, and Optimization. IEEE Access, 5: 25445–25454, 2017.
- 33 C. Chang, S.N. Srirama, and R. Buyya. Indie Fog: An efficient fog‐computing infrastructure for the Internet of Things. Computer, 50(9): 92–98, 2017.
- 34 Y. Cao, P. Hou, D. Brown, J. Wang, and S. Chen. Distributed analytics and edge intelligence: pervasive health monitoring at the era of fog computing. In Proceedings of the 2015 Workshop on Mobile Big Data (Mobidata '15). 2015.
- 35 S.K. Sood and I. Mahajan. A fog‐based healthcare framework for chikungunya. IEEE Internet of Things Journal, PP(99): 1–1, 2017.
- 36 J. Vora, S. Tanwar, S. Tyagi, N. Kumar and J.J.P.C. Rodrigues. FAAL: Fog computing‐based patient monitoring system for ambient assisted living. IEEE 19th International Conference on e‐Health Networking, Applications and Services (Healthcom), Dalian, China, pp. 1–6, 2017.
- 37 D. Guibert, J. Wu, S. He, M. Wang, and J. Li. CC‐fog: Toward content‐centric fog networks for E‐health. IEEE 19th International Conference on e‐Health Networking, Applications and Services (Healthcom), Dalian, China, 2017, pp. 1–5.
- 38 R. Craciunescu, A. Mihovska, M. Mihaylov, S. Kyriazakos, R. Prasad, S. Halunga. Implementation of fog computing for reliable E‐health applications. In 49th Asilomar Conference on Signals, Systems and Computers, pp. 459–463. 2015.
- 39 B. Varghese, N. Wang, D.S. Nikolopoulos, R. Buyya. Feasibility of fog computing. arXiv preprint arXiv:1701.05451, January 2017.