13
Fog Computing-Based Communication Systems for Modern Smart Grids
Miodrag Forcanand Mirjana Maksimović
Faculty of Electrical Engineering, University of East Sarajevo, 71123 East Sarajevo, Bosnia and Herzegovina
13.1 Introduction
Traditional and aging power grids are not able to successfully deal with the present increasing demands for the delivery of high-quality power in a secure, safe, reliable, and affordable manner. Growing energy demands, depletion of primary energy resources and increased utilization of renewable energy sources, sustainability, secure supply, and competitive energy prices are major driving forces for the conventional electric power grid evolution [1]. The recent technology development has influenced the traditional power grid, at both the transmission levels and distribution levels, making it smarter than ever before and capable of overcoming the existing challenges. This results in the appearance of the energy network integrated with the information and communication technologies (ICTs), known as Smart Grid (SG), that revolutionize generation, delivery, and use of electricity [2, 3].
The conventional electrical power grid is established on the communication infrastructure that transmits data gathered from a variety of sensing devices to a central control place for its processing and storage. This refers to the supervisory control and data acquisition (SCADA) system. The main drawback of existing SCADA systems is the lack of real-time control for the power distribution network. In the majority of distribution networks around the world, the concept of distribution system state estimation (DSSE) is not even deployed. Moving from the traditional power grid, where the demand predictions and supply monitoring mainly rely on historical data, toward the SG, which relies on the utilization of real-time data, demands a dynamic architecture, intelligent algorithms, and efficient mechanisms [4]. Hence, the SG is established on a huge number of a variety of smart devices, intelligent sensing, control methods, and integrated communications [5]. Combination of two-way of electricity flow with the fast and fully integrated bidirectional or two-way communication makes SG more secure, resistant, reliable, manageable, efficient, and sustainable than existing outdated and overburdened power grids (Figure 13.1).
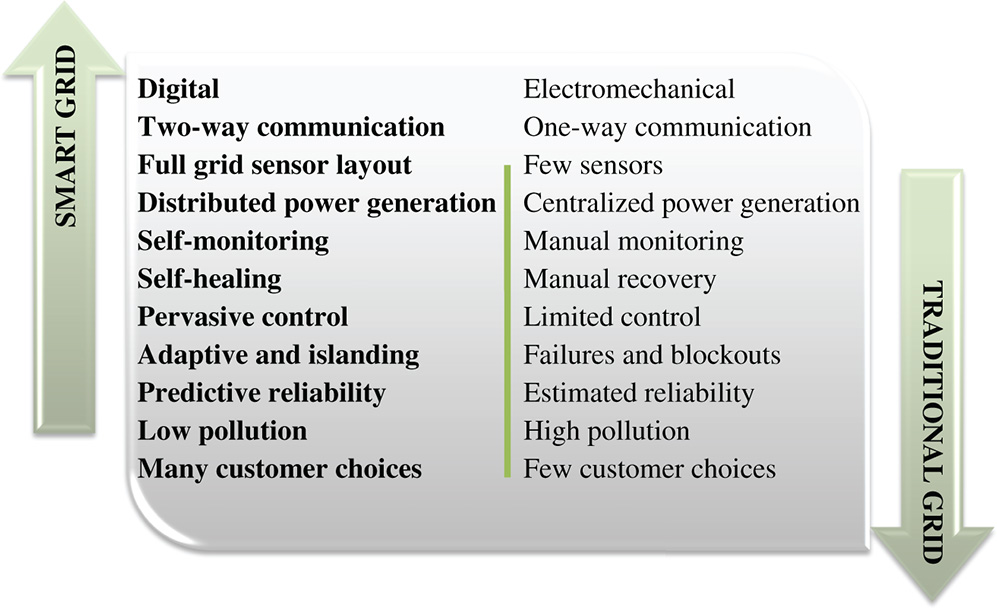
Figure 13.1 Comparison between the Smart Grid and the traditional grid.
The SG consists of the smart energy system (power grid, transmission grid, distribution grid, micro grid), smart information system (smart sensors, smart meters, phasor measurement units [PMUs], information metering, and measurement), and smart communication system. Compared to the traditional grid, the SG has an immense number of sensing and controlling devices deployed. Numerous sensing and monitoring devices deployed at the generation, transmission, distribution, and consumers' sides, produce an immense quantity of a heterogeneous and dynamic data in near real time, which must be processed and analyzed in an appropriate manner to obtain valuable insights and knowledge on which basis accurate and timely actions and predictions related to the power generation, supply, and demand can be performed. The SG can be looked at like a network of micro grids connected to each other via a cloud that, based on the collected and processed data, can run, disconnect, or self-heal [6, 7]. Hence, the successful operation of SGs that consists in decreased energy use, optimal work and coordination between all SGs' elements [8] depends on real-time, bidirectional, reliable, secure, and adaptive communication.
In other words, the advanced ICTs play a key role in the SG deployment and applications and are essential for the better understanding of the numerous aspects of SG and the overall energy sector. To achieve SG communication demands, there is a need to successfully overcome certain challenges such as bandwidth issues, storage capacity, information flow rate, advanced data analytics, security, etc.
This chapter presents an attempt to highlight existing communication technologies deployed in power grids and to introduce a new idea of the feeder-based communication system using fog/cloud computing for distribution management system (DMS). In the first section, an overview of communication technologies in SG is given and Internet of Things (IoT) application perspective is considered. The second section introduces the proposed feeder-based DMS using fog/cloud computing. The proposed communication scheme is tested for near real-time applications in the third section. Finally, useful remarks are given in the conclusion.
13.2 An Overview of Communication Technologies in Smart Grid
The goal of the SG is to enable nonstop, safe, and efficient delivery of high-quality power. This goal is achievable by using numerous smart devices (sensors and meters) and smart and secure communication networks. The communication infrastructure of the SG includes:
- Advanced Metering Infrastructure (AMI) – provides near real-time monitoring of power usage through an automated communication system between smart meters and a utility company. The data collected in AMI of the SG is huge, and its transmission to the utility center for processing and storage is quite challengeable. Some functionalities of AMI are near real-time monitoring and control of power quality, energy efficiency improvement, power pricing adaption, the energy consumption management, self-healing, improving the reliability, outages management/alert, etc. AMI doesn't have a standardized architecture, but it usually consists of smart meters, data concentrators, a utility center and bidirectional communication infrastructure [9], including web application with updated online data of consumers and mobile applications. In other words, AMI comprises Wide Area Measurement Systems (WAMSs), Sensor and Actuator Networks (SANETs) that can be grouped under a hierarchical structure on the basis of Home Area Networks (HANs), Neighborhood Area Networks (NANs), and Wide Area Networks (WANs) [4].
- Wide Area Measurement Systems (WAMS) – connect PMUs with larger and dynamic coverage, hence providing real-time, continuous, and synchronous monitoring and control of the electrical power grid [4].
- Sensor and Actuator Networks (SANETs) – is a network composed of the various devices able to sense and react to their SG environment. Sensors and actuators, controllers, and communication networks are the key components of SANET [4].
- Home Area Networks (HANs)/Industrial Area Networks (IANs)/Business Area Networks (BANs) – include home automation and building automation. These networks are deployed and operated within a small area (1–100 m), enable the connections of electrical appliances and other integrated devices/systems to the smart meters (mainly using ZigBee, Power Line Communications [PLC], Bluetooth, or Wi-Fi), supporting data rates up to 100 kbps [9–11].
- Neighborhood Area Networks (NANs) – cover transmission and distribution domains (100 m–10 km), enabling the two-way communication between a number of individual smart meters and a data concentrator/substation at data rates from 100 kbps to 10 Mbps [10]. Many technologies and networks, such as Worldwide Interoperability for Microwave Access (WiMAX), cellular communications, PLC, digital subscriber line (DSL), and optical communications, can be used in NAN [9].
- Wide Area Networks (WANs) – enable the communication of a number of data concentrators to a utility center. Utility centers consist of meter data management systems (MDMS), geographic information systems (GIS), configuration systems, etc. and their role is to collect, process, and store data from smart meters and interface with the suppliers [9]. WAN covers several hundred kilometers with the typical data rate from 10 to 100 Mbps [10], thus requiring long-range and high-bandwidth communication technologies, such as cellular communications, optical communications, and satellite communications.
The realization of communication tasks in SG is quite complex since the SG can be looked at as the large-scale network of heterogeneous systems. As an essential element of an efficient SG, ICTs must enable interconnection and real-time data exchange between the power utility and consumers, between the power utility and suppliers as well within the power utility. Hence, communication technologies must be chosen in a manner that enables reliable and secure bidirectional flow of near real-time information by satisfying required bandwidth, data rate, transmission range, security, latency, and reliability issues, adaptivity, etc.
The basic categorization of communication technologies is into wired technologies and wireless technologies. Comparison of communication technologies for the SG is shown in Table 13.1.
Table 13.1 Comparison of communication technologies for the SG [10–13].
| Technology | Max. theoretical data rate | Coverage | Applications | Advantages | Disadvantages |
| PLC | 500 kbps (NB-PLC) 200 Mbps (BB-PLC) |
150 km and more (NB-PLC) 1.5 km (BB-PLC) |
NAN, WAN (NB-PLC) HAN, NAN (BB-PLC) |
|
|
| Fiber optic | 40 Gbps | Up to 80 km | WAN |
|
|
| DSL | 100 Mbps | Up to 5 km | NAN |
|
|
| ZigBee | 250 kbps | Up to 100 m | HAN, NAN |
|
|
| Wi-Fi | 600 Mbps | Up to 100 m | HAN, NAN |
|
|
| Bluetooth | 1 Mbps | Up to 100 m | HAN |
|
|
| WiMAX | 75 Mbps | Up to 50 km | NAN, WAN |
|
|
| Cellular | >1 Gbps (5G) | Up to 50 km | NAN, WAN |
|
|
| Satellite | 1 Mbps | Up to 6000 km | WAN |
|
|
The wired communication technologies mainly used in the SG are:
- Power Line Communications (PLC) – enables two-way communication flow using existing power lines. PLC provides low-cost communication, and ubiquitous solutions, it is scalable and stable without impact on the environment. PLC is being used by several SG applications, such as substation automation, automatic meter reading (AMR) and AMI, remote monitoring, a vehicle to grid communications. The main challenges of PLC are related to security issues, near real-time communication, coexistence, and standardization [14]. PLCs are classified into [10, 12, 15]:
- Narrowband PLC – uses multicarrier schemes with frequencies in 3–500 kHz band, has a communication range of 150 km and more, and has low data rate (up to 10 kbps) or high data rate (up to 500 kbps), and
- Broadband PLC – operates in 2–250 MHz frequency band, has communication range up to 1.5 km, and data rate up to 10 Mbps for long-range communication and up to 200 Mbps for short-range communication.
- Optical Communications – are used between substation and utility companies control centers due to their high data rate (tens of Gbps) over longer distances, low latency, and immunity to interference. The main disadvantage of optical communications is the high cost of equipment, installation, and maintenance [10]. Optical networks can be:
- Active Optical Networks (AONs) – use active splitting points, and supports maximal distance of 80 km.
- Passive Optical Networks (PONs) – use passive splitting points and support maximal distance of 10–20 km. PONs are further classified into broadband passive optical network (BPON), Ethernet passive optical network (EPON), and gigabit passive optical network (GPON).
- Digital Subscriber Line (DSL) – is a low-cost solution based on data transmission over the traditional telephone lines. It provides maximum speed up to 100 Mbps and has been used for communication from homes to the utilities [16]. Achievement of higher data rates of longer distances is a major challenge DSL faces. There are two categories of DSL [10]:
- Asymmetric DSL with the higher download speed than upload speed.
- Symmetric DSL with equal upload and download speed.
On the other side are wireless communication technologies that have lower installation costs, and higher flexibility and scalability compared to the wired communication technologies. In the SG environment, the following wireless technologies can be used:
- ZigBee – is a short-range wireless communication technology based on IEEE 802.15.4 standard. It is a low-cost, self-organizing, secure, and fast communication technology with low power consumption and less interference. ZigBee operates at 868 MHz, 915 MHz, and 2.4 GHz, provides data rates 20–250 kbps, has coverage range up to 100 m, and is applicable for home automation, controlling and monitoring of a variety of loads, in AMI, etc. [17]. The main challenges the ZigBee faces are a limited lifetime, storage, data rates, processing capabilities, and interference issues [8].
- Wi-Fi – is a wireless communication technology based on IEEE802.11 standards that operates in license-free industrial scientific medical (ISM) frequency bands with low-cost radio interfaces. The highest data rate of Wi-Fi achieves 600 Mbps. Wi-Fi is generally utilized in HAN/local area network (LAN), and in the SG vision plays a key role in connecting smart devices with the Internet and for their energy usage management [10].
- Bluetooth – is a low-cost and short-range (typically 10 m but goes up to 100 m) wireless communication technology based on IEEE 802.15.1 standard. Bluetooth operates in ISM frequency band, it consumes low power and achieves data rates of 1 Mbps. In the SG applications, Bluetooth is used for power system monitoring and management, user-vehicle-charging system, etc. [15].
- Worldwide Interoperability for Microwave Access (WiMAX) – is a low-cost wireless broadband communication technology based on IEEE 802.16 standard. WiMAX operates at two frequency bands: 2–11 GHz (for non-line-of-sight applications), and 11–66 GHz (for line-of-sight applications), has large coverage area (up to 50 km), and high data rate (up to 75 Mbps). In the SG environment, WiMAX is suitable for NAN and WAN technology [8, 10, 15].
- Cellular communications – are widely employed in the SG environment due to well-established infrastructure and low maintenance, high data rates, greater bandwidth, and wider coverage area. The existing cellular communications technologies, such as global system for mobile communications (GSMs), general packet radio service (GPRS), 2G, 3G, 4G (and soon 5G) have been used for data transmission between different components in the SG, in AMI, automated demand response (ADR), outage management, etc. [8, 10].
- Satellite communication – with the help of satellites placed in low Earth orbits (LEOs), medium Earth orbits (MEOs), and geostationary Earth orbits (GEOs) enable communication in remote areas where other communication means are not applicable. Traditionally, satellite communication has been used for SCADA systems. High costs and very high latency are the main disadvantages of satellite communications. The satellite communications can be used as a backup in the SG environment [10].
It is also important to highlight some novel and promising technologies that have the potential to be used in the SG. Some of them are [10]:
- Cognitive Radio (CR) – will enhance the spectral efficiency, and network security, and improve long-range and large-scale data transmission,
- Smart Utilities Networks (SUNs) – hold a potential to be implemented in several SG applications, such as AMR, remote control, outage detection, monitoring reliability, and quality.
- TV White Spaces (TVWS) – with the potential to be used for smart metering applications, and transport telematics.
Other emerging technologies suitable for the realization of the IoT are also suitable for the low power wide area networks (LPWANs) that demand the transmissions of a few kb over long distances at low speeds in the most power-efficient way. As such these networks are suitable for smart metering applications in the SG environment [16]. These technologies are:
- SigFox – is a narrowband (or ultra-narrowband) technology that uses the 868 MHz band, and has very low noise effect.
- LoRaWAN – operates in the 433, 868, and 915 MHz bands, and supports data rates up to 50 kbps.
- NB-IoT – a narrowband IoT radio technology deployable in the GSM spectrum, capable of supporting numerous low throughput devices.
The IoT plays a key role in the realization of the SG vision as it has the potential to enable robust communication that is always available, scalable, secure, and interoperable. As an immense number of devices and components, such as sensors, smart meters, customer devices, mobile data terminals, substations, are building blocks of the SG, the data they produce are voluminous, heterogeneous, and dynamic. The data generated in the SG can be classified as [18]: meter usage data, event message data, operational data, non-operational data, and metadata. The effectiveness of the SG based on dynamic and optimized management and control of the energy demanded, consumed, and delivered [6] depends on the two-way flow of near real-time data and timely and adequate data processing. Adequate near real-time monitoring, control, and maintenance of a huge number of smart devices applied in the SG depend on the fast and accurate data collection, transmission, and analysis. This is the point where the concept of Big Data comes in. Artificial intelligence and a variety of data mining techniques enable the extraction of useful information and valuable knowledge from a massive amount of fast-generated and heterogeneous data. The processing of these data can be realized as batch processing (for static and non-real-time applications), stream processing (for real-time applications), and hybrid processing (suitable for real-time and non-real-time applications) [18, 19].
Generally, cloud computing solves many problems related to managing Big Data. In the large-scale systems, such as SG, sending and storing huge amounts of data on the cloud is not practical due to latency and bandwidth issues. When there is a need for a fast response fog computing is a far better approach as it enables decentralized and intelligent processing closer to the place where data are produced and sends only the resulting information to the cloud for further processing and storage. The fog-based architecture of the SG consists of smart meters, fog servers, and cloud data centers. Therefore, fog computing is not a replacement for cloud computing, it only deals with fewer data than the cloud that simplifies analysis and extraction of valuable information. This directly increases response time, reduces the congestion and latency, and successfully deals with the loss of connectivity or poor connection with the cloud [20]. Fog computing in the SG environment shows its power in successfully dealing with the massive amount of data related to energy management, information management, and security [21]. It is important to underline that load balancing and resource utilization between cloud data centers and fog layers is crucial for efficient data analysis and decision making. The inclusion of osmotic computing at the fog layers contributes to faster responses as it enables better distribution, management, and execution of computation tasks at the edge of the network or within cloud data centers.
Communication in the IoT-supported SG environment includes information flow from smart meters and IoT devices, and information flow between smart meters and utility control centers [19]. In the fog-based SG, near real-time bidirectional communication between utilities and consumers is established, enabling customers to monitor and control their electricity through a device connected to the edge of the network [21]. In the fog-based architecture in the SG environment, four types of communication can be defined: smart device to smart device (i.e. via ZigBee or Bluetooth), smart device to fog server (i.e. through Ethernet), fog server to fog server and fog server to cloud server (i.e. through Wi-Fi or cellular communications) [22].
13.3 Distribution Management System (DMS) Based on Fog/Cloud Computing
A DMS is a collection of applications designed to monitor and control the entire distribution network efficiently and reliably [23]. DMS concept emerged as an extension of energy management system (EMS) proposed for transmission networks in the 1970s. The term EMS is closely related to the SCADA computer system widely used in transmission networks for collecting information about power system status via measurements provided by remote terminal units (RTUs). In the early days of DMS, in the 1990s, the metering infrastructure supporting its functions was mainly limited to distribution equipment located in combined transmission and distribution substations [24]. There were no periodic measurements in distribution substations and along the distribution feeders meaning that the observability of distribution networks was very low at the time and very expensive to improve. Improving observability requires the installation of the new measurement units along the entire distribution network and establishing the new communication networks. Today, the fast development of communication systems is taking place, which could provide efficient solutions for wide DMS applications in the near future with lower costs. Integration of renewable energy sources in existing distribution networks increases significance and pushes forward new solutions for DMS [25].
The major functions used in DMS are distribution system state estimation (DSSE), load flow (LF), and Volt-Var Optimization (VVO). Time triggering of the major functions is presented in Figure 13.2 according to the concept from Atanackovic and Dabic [26]. DSSE is used to improve system observability, check for and detect errors in both system measurements and network parameters, and to mitigate against measurement and communication system noise [27]. LF is the procedure used for obtaining the steady state voltages of electric power systems at the fundamental frequency [28]. In advanced DMS, LF will be used on a more frequent basis [29]. VVO is a well-known application for minimization of reactive power losses and for maintaining an optimal voltage profile. According to the concept from Figure 13.2, DSSE calculations should be performed every time new input data is available, while LF calculations should be triggered only when a network topology change is detected. VVO should be also initiated periodically according to the established timetable, but less often than DSSE calculations. Network topology processing (NTP) and observability analysis (OA) are initial prefunctions necessary for the application of previous major functions.
Observabilities of the majority of existing distribution networks in the world are very low. Most of the available input data at the distribution level are measurements (or pseudo-measurements) of power or current injections [27]. Telemetered values from measurement devices located at distribution feeders outside of substations are very rare. Some advanced distribution network utilities, such as BC Hydro (Province of British Columbia), already started implementation of SCADA at the distribution system level [26]. Similar projects can be found around the world; all are based on wired communication technologies (i.e. optical communications), in spite of installation and maintenance high costs. In such systems, DMS is controlled by distribution system operator (DSO), which gathers all available measurements and performs the calculation of DSSE and LF. For large distribution networks with hundreds of substations and even more feeders, it could be very challenging to install communication wires. Collecting and analyzing such Big Data at DSO locations is not a simple task. Since at distribution system level communication latency is not a priority, application of modern wireless communication technologies could be a good alternative. The deployment of smart meters and intelligent electronic devices (IEDs) equipped with two-way communications is increasing [30]. These modern devices are capable to wirelessly send and receive data, therefore increasing observability of the distribution network. An innovating feeder-based communication scheme for DMS using fog/cloud computing is presented in Figure 13.3.
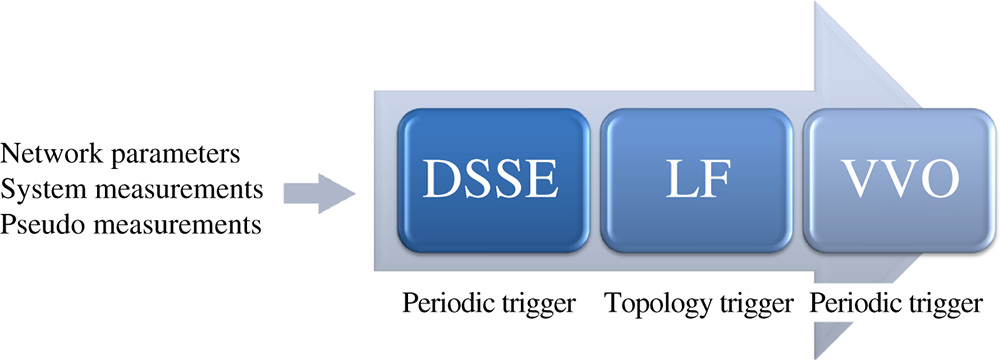
Figure 13.2 Time triggering of the major functions used in DMS.
Proposed communication schemes use fog servers as data concentrators for distribution feeders. The precondition necessary for deployment of this scheme is the availability of telemetered values along every feeder, which is expected in future SG. Measurements from a low voltage level could be provided by smart meters, while measurements from high voltage levels could be provided by PMUs and IEDs. It is expected that these near real-time measurements enable high observability of the distribution network, which later will improve DMS. Calculation of basic DMS functions, such as NTP, OA, DSSE, and LF, are all performed at the fog server, thus significantly lowering data transmission rates necessary for cloud-based DSO, as can be seen in Figure 13.3. Smart meters, IEDs, and PMUs send data to feeder-based fog servers wirelessly. Measurements from smart meters are available every few minutes, thus helping to determine load profiles and lowering uncertainty of pseudo-measurements. Measurements from IEDs and PMUs could be available at every few seconds, thus enabling near real-time calculations of DMS functions at fog servers.
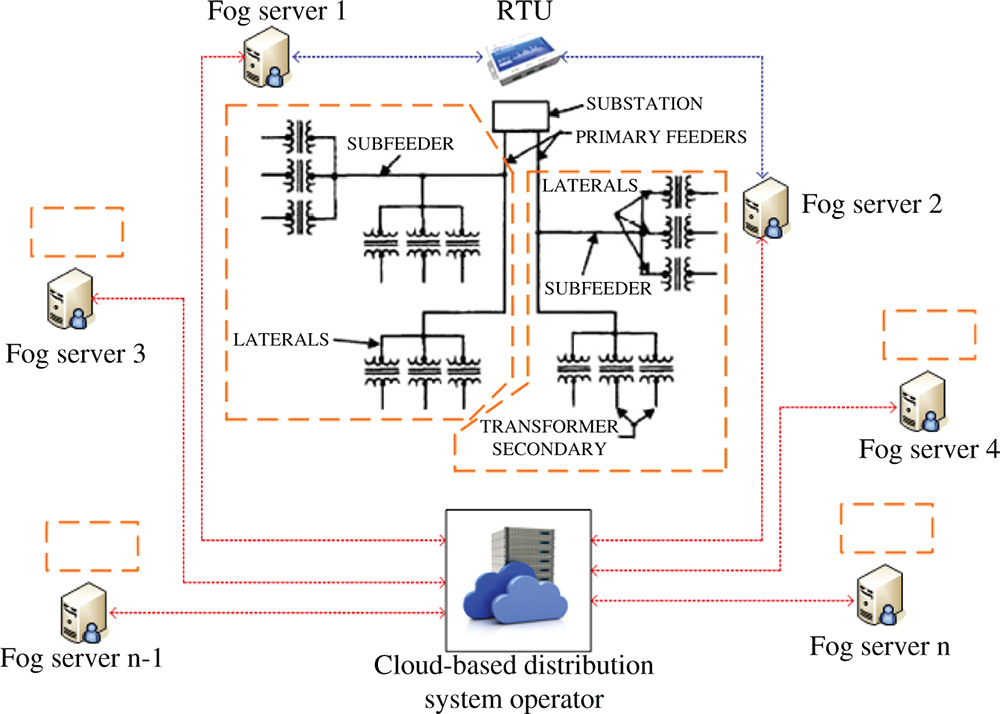
Figure 13.3 Feeder-based communication scheme for DMS using fog/cloud computing. (See color plate section for the color representation of this figure)
An important advantage of the proposed communication scheme is that periodical Big Data calculations required for DMS are avoided at cloud servers representing DSO. Cloud-based DSO receives calculation results from feeder-based fog servers instead of Big Data from all feeders. Calculations of DMS functions could be performed directly at the cloud server by sending a request to fog servers if necessary in some occasions. Communication between fog servers of distribution feeders at the same substation and existing RTU is also provided. In this way, the transmission system operator (TSO) could request data directly from feeders physically grouped at one substation. The proposed communication scheme is bidirectional, which means that control actions could be transmitted to equipment from fog servers or DSO directly. By enabling fog to fog bidirectional communication micro grid concept could be also deployed.
13.4 Real-time Simulation of the Proposed Feeder-based Communication Scheme Using MATLAB and ThingSpeak
To illustrate the benefits of the proposed feeder-based communication scheme a real-time DMS is simulated using MATLAB [31] and the open source IoT platform ThingSpeak [32]. ThingSpeak platform is used to model fog server communicating with the well-known MATLAB-based model of IEEE 13 Node Test Feeder [33]. This approach is chosen for the real-time simulation of the SG environment as it allows a two-way information flow between the user and the simulated system, and hence makes possible real-time sharing data and remote control.
ThingSpeak IoT platform is secured by usernames and passwords and enables graphical representations of several channels and their fields. Each channel has its own ID, can be public (seen by other users) or private (seen by specific users), and can contain up to eight fields of data (data can be both numeric and alphanumeric), and therefore enables presentation of several parameters at the same time. It is important to highlight that the channels receive sensor data every 15 seconds. Alongside eight fields of data, there are four other fields dedicated for location details: Description, Latitude, Longitude, and Elevation. In addition, every private channel has two keys: API (application programming interface) read key and API write key. These keys are randomly created with a unique alphanumeric string used for authentication [34], enabling the channel to store or retrieve data from the things via the Internet or LAN [35]. ThingSpeak IoT platform enables the data importing, exporting, and saving in the csv or xlsx file format. The access to collected, processed, visualized, saved, and historical data can be realized by using any device that has Internet connectivity (i.e. computers or smartphones), through the user authentication using the username and password. In this way, secure and quick access to accurate, complete, and up-to-date information is enabled [36].
Distribution feeder test cases were designed to evaluate and benchmark algorithms in solving unbalanced three-phase radial systems. Each of these represents reduced-order models of an actual distribution circuit [37]. In this analysis, 13-bus feeder, operating at 4.16 kV, has been used. A detailed three-phase model of the previous feeder with network and consumption data is available in [38]. Communication between the feeder model and ThingSpeak IoT platform is established using MATLAB Simulink Desktop Real-time Toolbox. A simplified communication scheme is presented in Figure 13.4.
The first step in the simulation of DMS is making the feeder model fully observable. Three-phase measurement blocks are placed at every feeder node, while pseudo-measurements are neglected due to simplicity. It is assumed that DMS functions NTP and OA are already performed at the fog server (ThingSpeak IoT platform). To successfully and periodically perform DSSE function, measurements of node voltage magnitudes and phase angles are being sent to ThingSpeak at every 20 seconds in real time. For every node voltage measurement, one ThingSpeak channel with six fields is assigned (two fields for every phase), which makes 12 channels and 72 fields in total. Distribution feeder topology with channel assignments for node voltage measurements is presented in Figure 13.5.
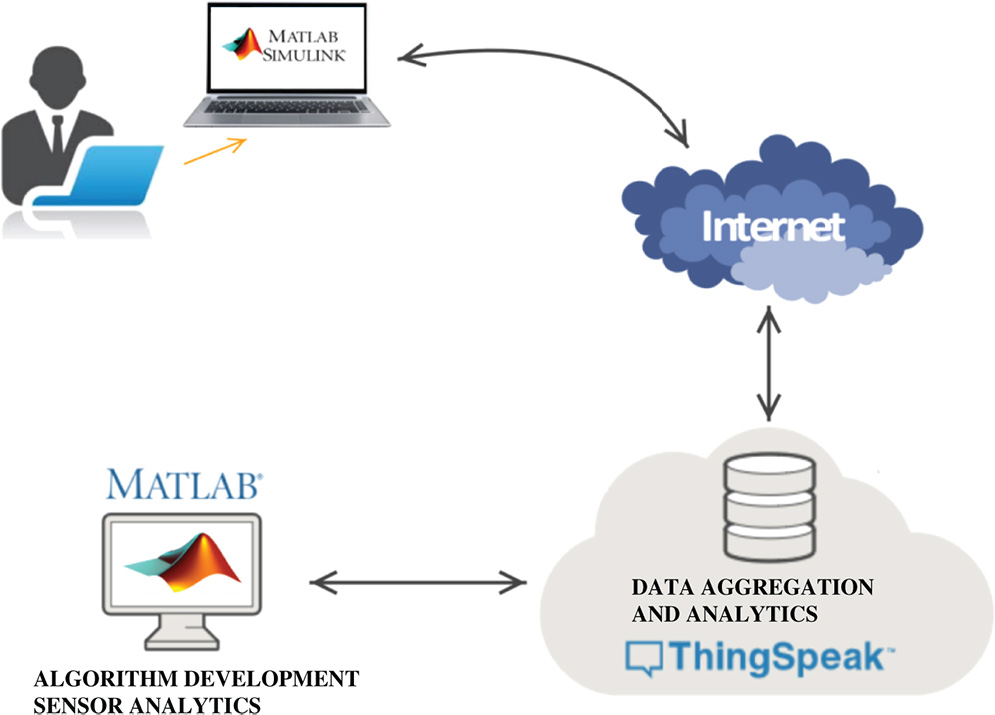
Figure 13.4 Simplified communication scheme connecting MATLAB/Simulink and ThingSpeak IoT platform used for DMS simulation. (See color plate section for the color representation of this figure)
It can be seen that distribution feeder topology is phase-unbalanced. The majority of network branches are in three-phase, but there are also two- and one-phase branches. Every measurement block sends voltage data to its corresponding ThingSpeak channel, which is determined by the channel's ID number. Data is stored and visualized in real time in ThingSpeak IoT platform, thus enabling real-time monitoring of the voltage profile along the feeder. Voltage profile monitoring is an essential part of DSSE function. DSSE is determined by knowing all node voltage magnitudes or RMS values and phase angles. LF function calculations are performed directly in Simulink and not in ThingSpeak IoT platform in this analysis due to simplicity.
In the first simulation test, the voltage profile of the distribution feeder model is monitored in real time during 200 seconds time interval. Three-phase tripping of network branch 671–692 is simulated after 100 seconds, as can be seen in Figure 13.6.

Figure 13.5 Distribution feeder topology with ThingSpeak channel assignments for node voltage measurements.
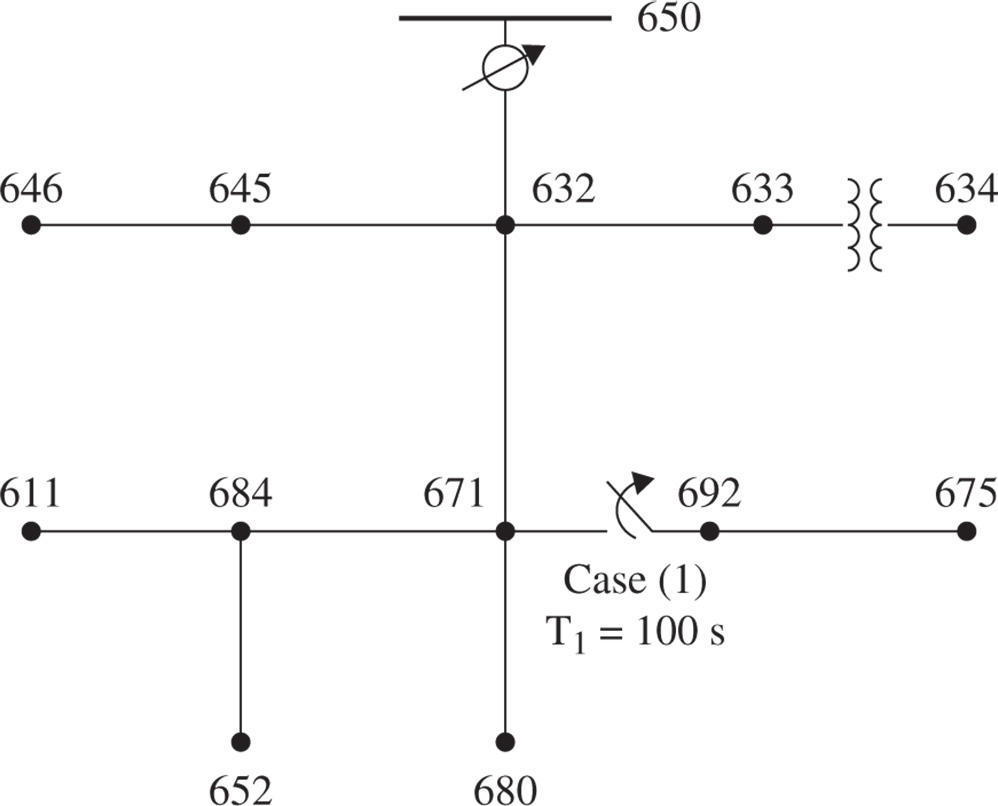
Figure 13.6 Simulation test 1 – Three-phase tripping of network branch 571–692 and real-time monitoring of feeder voltage profile.
Feeder voltage profile is visualized using online MATLAB Visualization Tool integrated into ThingSpeak IoT platform and corresponding results are presented in Figure 13.7. Voltage RMS values are presented only for the most important nodes in this analysis: 671, 684, 611, 652, 692, and 675. According to default feeder model settings, the voltage of node 632 is predefined and kept constant during simulation, meaning that events downstream from the node 632 will not affect voltages of nodes 633, 634, 645, and 646.
According to plots (a), (b), (c), and (d) in Figure 13.7, it can be noticed that RMS values of voltages of “heavily” loaded phases a and c increased after tripping of branch 571–692, while RMS value of the voltage of “low” loaded phase b decreased. From plots (e) and (f) in the same figure, it can be seen that RMS values of node voltages 692 and 675 dropped to zero in all phases, which is a direct consequence of simulated tripping event. According to previous information, the fog server becomes aware of the new voltage profile. Real-time monitoring function successfully detected a change in voltage profile during simulation time. Tolerated phase voltage limits are ±10% and presented in magenta color. Obtained voltage profile should not be sent periodically to cloud-based DSO at every 20 seconds, but only in the cases of change or request.
LF calculations have been performed before and after of the tripping event to monitor per-phase active and reactive powers from node 650 to node 632 (feeder power consumption). Before the tripping event calculated powers were: Pa = 1.23 MW, Qa = 0.61 Mvar, Pb = 0.98 MW, Qb = 0.34 Mvar, Pc = 1.31 MW, Qc = 0.59 Mvar. After the tripping event corresponding calculated powers were: Pa = 0.7 MW, Qa = 0.45 Mvar, Pb = 0.91 MW, Qb = 0.5 Mvar, Pc = 0.89 MW, Qc = 0.52 Mvar.
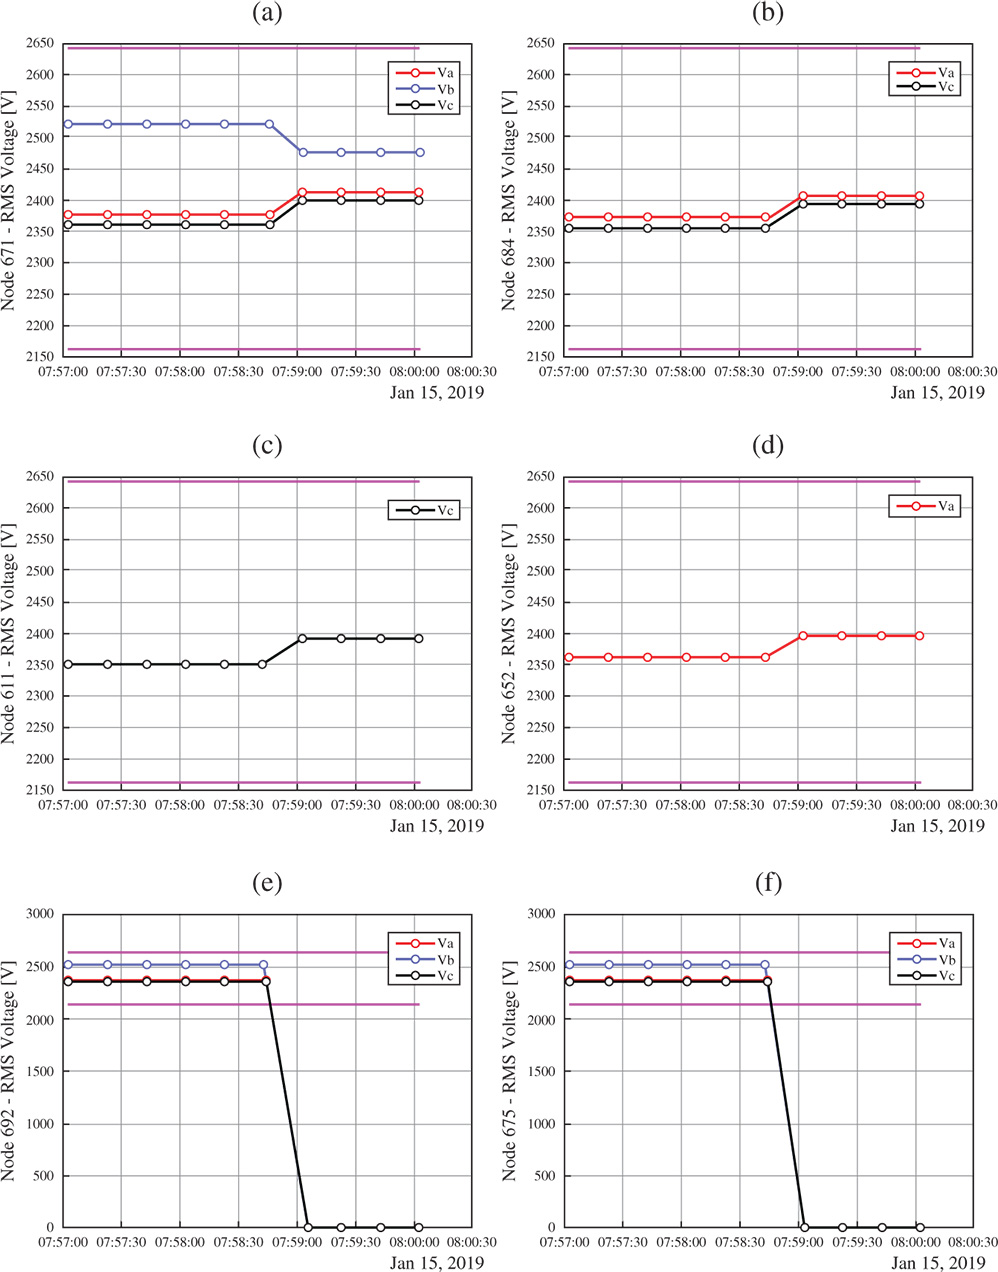
Figure 13.7 Three-phase voltage profile of distribution feeder downstream from the node 632 in the case of simulation test 1: (a) node 671; (b) node 684; (c) node 611; (d) node 652; (e) node 692; (f) node 675.
In the second simulation test, the voltage profile of the distribution feeder model is monitored in real-time during 200 seconds time interval with online Volt-Var control implemented. Phase voltages are compared with corresponding limits in real time. In the case of lower voltage limit violated Volt-Var control is programmed to switch on the battery for reactive power compensation. At first, “heavy” inductive load is switched on at node 675, after 100 seconds from the start of the simulation, as can be seen in Figure 13.8. Later, a control signal for switching the battery on at the same node is anticipated in the case of voltage lower limit violation.
As can be seen in Figure 13.8, “heavy” inductive load is modeled as nonbalanced with per-phase inductive powers: QLA = 2.85 Mvar, QLB = 0.9 Mvar and QLC = 3.18 Mvar, while battery model capacitive power is QC = 3 Mvar in phases A and C (phase B is not compensated). Similar to the first simulation case, the feeder voltage profile is visualized by using the online MATLAB visualization tool; corresponding results are presented in Figure 13.9. Voltage RMS values of nodes 671, 684, 611, 652, 692, and 675 are monitored in real time.
According to the results from plots in Figure 13.9, it can be noticed that the insertion of a “heavy” inductive load causes a voltage drop in phases A and C. Violation of lower voltage limit is detected by a Volt-Var control tool and the signal for switching the battery on is sent from ThingSpeak to the feeder model in near real time. The program is executed and the battery is switched on, 40 seconds from the detection of voltage drop. The voltage level is then successfully restored within acceptable limits.
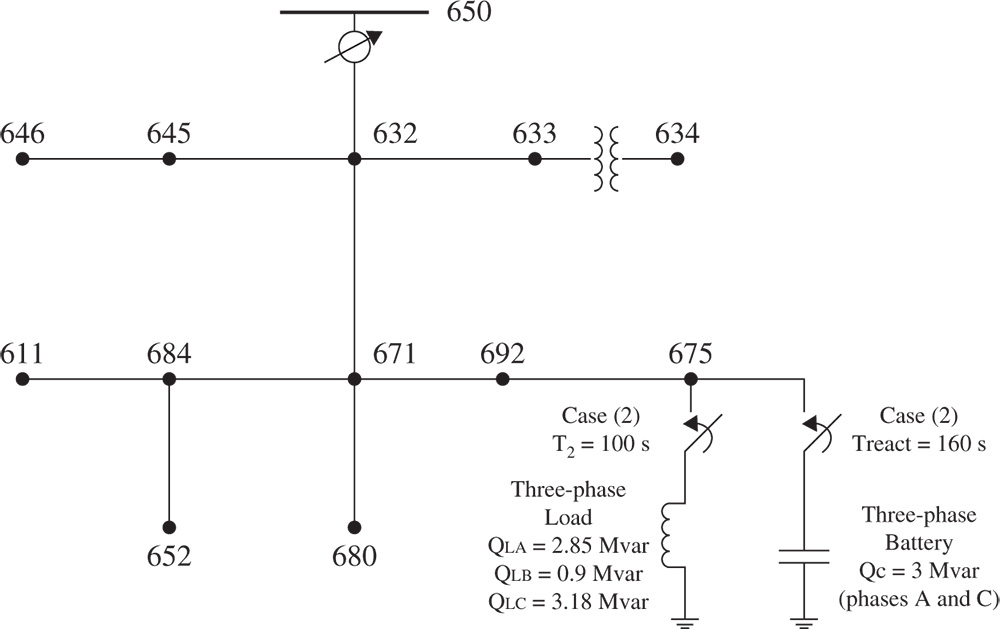
Figure 13.8 Simulation test 2 – “Heavy” loading of the distribution feeder, real-time monitoring of feeder voltage profile and executing real-time Volt-Var control.
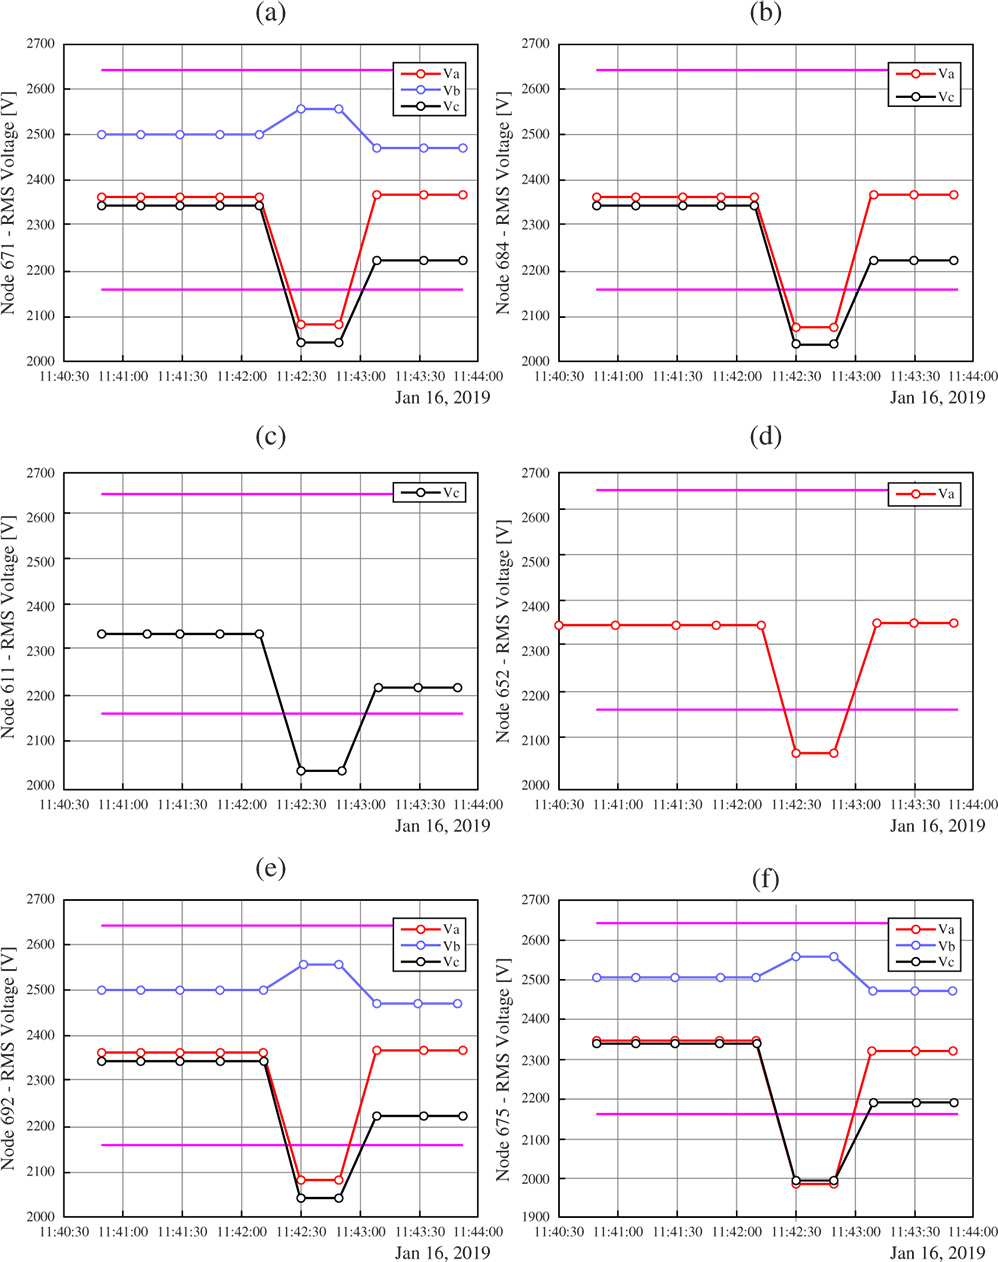
Figure 13.9 Three-phase voltage profile of distribution feeder downstream from the node 632 in the case of simulation test 2: (a) node 671; (b) node 684; (c) node 611; (d) node 652; (e) node 692; (f) node 675.
Simulation test 2 represents a valuable example illustrating real-time monitoring and control of voltage profile using the proposed communication scheme. LF calculations have been also performed for cases with “heavy” inductive load before and after reactive power compensation. Total reactive power consumed by the feeder before the compensation was Qtotal = 7.74 Mvar. While, after the compensation, total measured reactive power is reduced to value Qtotal = 2.8 Mvar, thus lowering feeder voltage drops.
Calculations of LF in a distribution network should be performed at fog servers. Telemetered measurements from every feeder required for calculations of LF are collected by individual fog servers (one fog server per one feeder concept). With this approach, potential Big Data issues are lower when compared with centralized communication schemes. In simulation tests, LF calculations are performed by the local processor, which also performs calculations related to the feeder model. ThingSpeak supports complex calculations using MATLAB tools and it is planned in future research to implement LF algorithms directly on the cloud.
13.5 Conclusion
Existing communication technologies deployed in the power system need to be reconsidered and newly analyzed to determine possibilities of their usage in modern SG. Near real-time data transmission and analysis are required by the new concept. Another challenge to overcome, related to distribution networks, is the requirement of higher observability, which can be achieved by the deployment of SMs, IEDs, and PMUs.
Wired communication technologies are always related to high costs and it is not an easy task to install them in large distribution networks with hundreds of feeders and tens of substations. Wireless communication technologies could be an efficient and cheaper alternative if they properly meet transmission rates and communication latency requirements. One of the key questions is where to perform calculations of Big data related to DMS. Sending large amounts of data directly to cloud-based DSO could impose difficulties in communication systems, especially when it comes to near real-time data transmission.
In this chapter, a new communication scheme is proposed using fog servers as feeder-based calculation units necessary for DMS. The main advantage of the proposed scheme is a significant reduction of data sent to cloud-based DSO. DSO receives data from fog servers only if measurement changes are detected or by sending the request, while fog servers receive data periodically from smart meters, IEDs, and PMUs along the feeder. The majority of the required calculations for DMS functions is performed at fog servers and only results representing feeders near real-time snapshots are sent to the cloud-based DSO. The proposed scheme could be easily connected with existing RTUs at substations, thus enabling, on request, communication with TSO. By expanding the proposed scheme and enabling mutual communication between fog servers micro grids could be formed.
Capability testing of the proposed communication scheme is performed using MATLAB and open source IoT platform ThingSpeak. Two near real-time simulation tests are defined: (1) three-phase tripping of network branch and real-time monitoring of feeder voltage profile, and (2) heavy loading of the distribution feeder, real-time monitoring of feeder voltage profile and executing real-time Volt-Var control. According to obtained results, communication scheme proved to be capable and efficient for supporting major DMS functions, such as DSSE and LF. A second simulation test revealed another important capability of the scheme to support near real-time control actions related to reactive power compensation (Volt-Var control).
References
- 1 Heirman, D. (2012). What makes Smart Grid – smart – and who is in the game? IEEE Electromagnetic Compatibility Magazine 1: 95–99.
- 2 Department of Energy of USA, Communication requirements of Smart Grid, 2010. [Online]: https://www.energy.gov/sites/prod/files/gcprod/documents/Smart_Grid_Communications_Requirements_Report_10-05-2010.pdf
- 3 Z. Jiang, F. Li, W. Qiao et al., (2009) A vision of smart transmission grids, IEEE Power & Energy Society General Meeting - PES '09, Canada, 2009.
- 4 Kayastha, N., Niyato, D., Hossain, E., and Han, Y. (2014). Smart Grid sensor data collection, communication, and networking: a tutorial. Wireless Communications 14 (11): 1055–1087.
- 5 Xi, F., Satyajayant, M., Guoliang, X., and Dejun, Y. (2012). Smart Grid – the new and improved power grid: a survey. IEEE Communications Surveys & Tutorials 14 (4): 6–9.
- 6 Maksimović, M. and Forcan, M. (2019). Internet of Things and Big Data Recommender Systems to support Smart Grid. In: Big Data Recommender Systems: Recent trends and Advances (eds. O. Khalid, S.U. Khan and A.Y. Zomaya), 145–172. London: The Institution of Engineering and Technology.
- 7 Vijayapriya, T. and Kothari, D.P. (2014). Smart grid: an overview. Smart Grid and Renewable Energy 2 (4).
- 8 Baimel, D., Tapuchi, S., and Baimel, N. (2016). Smart Grid communication technologies: overview, research challenges and opportunities. In: IEEE International Symposium on Power Electronics, Electrical Drives, Automation and Motion (SPEEDAM), 116–120. Italy.
- 9 A. Chasempour, Optimizing the Advanced Metering Infrastructure Architecture in Smart Grid. PhD Thesis. Utah State University, 2016. [Online]: https://digitalcommons.usu.edu/cgi/viewcontent.cgi?article=6061&context=etd
- 10 Alam, S., Sohail, M.F., Ghauri, S.A. et al. (2017). Cognitive radio based Smart Grid communication network. Renewable and Sustainable Energy Reviews 72: 535–548.
- 11 Kuzlu, M., Pipattanasomporn, M., and Rahman, S. (2014). Communication network requirements for major Smart Grid applications in HAN, NAN and WAN. Computer Networks 67: 74–88.
- 12 Kabalci, Y. (2016). A survey on smart metering and Smart Grid communication. Renewable and Sustainable Energy Reviews 57: 302–318.
- 13 Mahmood, A., Javaid, N., and Razzaq, S. (2015). A review of wireless communications for Smart Grid. Renewable and Sustainable Energy Reviews 41: 248–260.
- 14 Yigit, M., Gungor, V.C., Tuna, G. et al. (2014). Power line communication technologies for Smart Grid applications: a review of advances and challenges. Computer Networks https://doi.org/10.1016/j.comnet.2014.06.005.
- 15 Zafar, R., Mahmood, A., Razzaq, S. et al. (2018). Prosumer based energy management and sharing in Smart Grid. Renewable and Sustainable Energy Reviews 82: 1675–1684. https://doi.org/10.1016/j.rser.2017.07.018.
- 16 Andreadou, N., Olariaga Guardiola, M., and Fulli, G. (2016, 2016). Telecommunication technologies for Smart Grid projects with focus on smart metering applications. Energies 9: 375. https://doi.org/10.3390/en9050375.
- 17 R. Zafar, U. Naeem, W. Ali, and A. Mahmood, Applications of ZigBee in Smart Grid Environment: a review,in Proceedings of the 2nd International Conference on Engineering & Emerging Technologies (ICEET). Lahore, PK: Superior University, 2015.
- 18 Daki, H., El Hannani, A., Aqqal, A. et al. (2017). Big Data management in Smart Grid: concepts, requirements and implementation. Journal of Big Data 4 (13).
- 19 Y. Saleem, N. Crespi, M. H. Rehmani, and R. Copeland, Internet of Things-aided Smart Grid: technologies, architectures, applications, prototypes, and future research directions, 2017 [online]: https://arxiv.org/ftp/arxiv/papers/1704/1704.08977.pdf
- 20 F. Y. Okay and S. Ozdemir, A fog computing based Smart Grid model, International Symposium on Networks, Computers and Communications (ISNCC), Tunisia, 2016.
- 21 Vinueza Naranjo, P.G., Shojafar, M., Vaca-Cardenas, L. et al. (2016). Big Data over Smart Grid – a fog computing perspective. In: Proceedings of the 24th International Conference on Software, Telecommunications and Computer Networks (SoftCOM), 1–6. Split, Croatia.
- 22 Vatanparvar, K. and Al Faruque, M.A. (2015). Energy management as a service over fog computing platform. In: Proceedings of the ACM/IEEE Sixth International Conference on Cyber-Physical Systems (ICCPS '15), 248–249. New York, NY, USA: ACM.
- 23 Huang, Y.F., Werner, S., Huang, J.J. et al. (2012). State estimation in electric power grids: meeting new challenges presented by the requirements of the future grid. IEEE Signal Processing Magazine 29 (5): 33–43.
- 24 Cassel, W.R. (1993). Distribution management systems: functions and payback. IEEE Transactions on Power Systems 8 (3): 796–801.
- 25 Schwerdfeger, R. and Westermann, D. (2013). Design of an energy distribution management system for the vertical management of volatile infeed. In: 2013 IEEE Power & Energy Society General Meeting, 1–5. Vancouver, BC.
- 26 Atanackovic, D. and Dabic, V. (2013). Deployment of real-time state estimator and load flow in BC Hydro DMS - challenges and opportunities. In: 2013 IEEE Power & Energy Society General Meeting, 1–5. Vancouver, BC.
- 27 Hayes, B. and Prodanovic, M. (2014). State estimation techniques for electric power distribution systems. In: 2014 European Modelling Symposium, 303–308. Pisa.
- 28 Herraiz, S., Sainz, L., and Clua, J. (2003). Review of harmonic load flow formulations. IEEE Transactions on Power Delivery 18 (3): 1079–1087.
- 29 Borlase, J.S. (2009). The evolution of distribution. IEEE Power and Energy Magazine 7 (2): 63–68.
- 30 Primadianto, A. and Lu, C. (2017). A review on distribution system state estimation. IEEE Transactions on Power Systems 32 (5): 3875–3883.
- 31 MATLAB, The MathWorks, Inc., Natick, MA, US, 2017.
- 32 ThingSpeak, 2019 [Online]: https://thingspeak.com
- 33 Schneider, K.P. et al. (2018). Analytic considerations and design basis for the IEEE distribution test feeders. IEEE Transactions on Power Systems 33 (3): 3181–3188.
- 34 M. A. Gómez Maureira, D. Oldenhof, and L. Teernstra, ThingSpeak – an API and web service for the Internet of Things, 2014. [Online]: https://staas.home.xs4all.nl/t/swtr/documents/wt2014_thingspeak.pdf
- 35 Mohamad, A.A.H., Mezaal, Y.S., and Abdulkareem, S.F. (2018). Computerized power transformer monitoring based on Internet of Things. International Journal of Engineering & Technology 7 (4): 2773–2778.
- 36 Shekhar, J., Abebaw, D., Abebe Haile, M. et al. (2018). Temperature and heart attack detection using IOT (Arduino and ThingSpeak). International Journal of Advances in Computer Science and Technology 7 (11): 75–82.
- 37 IEEE PES, 2019, [Online]: http://sites.ieee.org/pes-testfeeders/resources
- 38 Mathworks, 2019, [Online]: https://www.mathworks.com/help/physmod/sps/examples/ieee-13-node-test-feeder.html