
CHAPTER 1
Big Data and Artificial Intelligence
Chapter 1 provides an overview of some of the hot trends in the industry around Big Data and Artificial Intelligence. We will see how the world is being transformed through digitization, leading to the Big Data phenomenon—both in the consumer and industrial spaces. We see data volumes increasing exponentially, from terabytes to exabytes to zettabytes. We see the processing power of computers increase in magnitudes of tens and hundreds. We will talk about software getting smarter with the application of Artificial Intelligence—whether it's IBM's Watson beating human champions at Jeopardy! or Facebook automatically tagging friends in your photos, or even Google's self‐driving car. Finally, the chapter discusses the types of analytics and covers a simple example of building a system driven by analytics to deliver outcomes.
Data Is the New Oil and AI Is the New Electricity
We are living in the Internet age. Shopping on Amazon to booking cabs through Uber to binge‐watching TV shows on Netflix—all these outcomes are enabled by the Internet. These outcomes involve huge volumes of data being constantly uploaded and downloaded from our computing devices to remote servers in the Cloud. The computing devices themselves are no longer restricted to personal computers, laptops, and mobile phones. Today, we have many more smart devices or “things” connected to the Internet, like TVs, air conditioners, washing machines, and more every day. These devices are powered with microprocessors just like in a computer and have communication interfaces to transfer data to the Cloud. These devices can upload their data to the Cloud using communication protocols like Wi‐Fi, Bluetooth, and cellular. They can also download up‐to‐date content from remote servers, including the latest software updates.
The Internet of Things (IoT) is here to change our lives with outcomes that would easily fit in a science fiction novel from 10 years ago. We have fitness wristbands that suggest exercise routines based on our lifestyle, watches that monitor for heart irregularities, home electronics that listen to voice commands, and of course, the famous self‐driving cars and trucks. These Internet‐connected devices are smart enough to analyze complex data in the form of images, videos, and audio, understand their environments, predict expected results, and either take a recommended action or prescribe one to a human.
My Fitbit checks if I have not done enough exercise in a day and “asks” me politely to get up and start exercising. We have sensors that sense any absence of motion and shut off lights automatically if the room is empty. The Apple watch 4 has a basic EKG feature to measure your heart condition. Consumers of Tesla cars get new features delivered directly over the air through software updates. No need to visit the service shop. The modern IoT devices are not only connected but have the smarts to achieve some amazing outcomes, which were described only in science fiction novels just a few years back.
So great is the impact of this IoT revolution that we are now getting used to expecting such results. This technology is here to stay. The other day, my 4‐year‐old asked our Amazon Echo device, “Alexa, can you do my homework?” (See Figure 1.1.) The modern consumer is now expecting devices to provide these new outcomes. Anything less is becoming unacceptable!
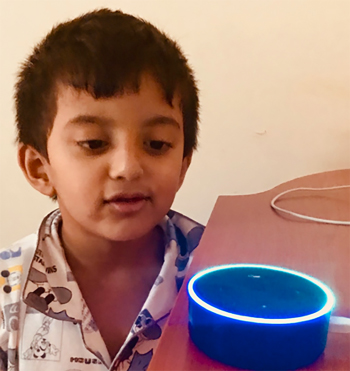
Figure 1.1: Alexa, can you do my homework?
Despite the diverse outcomes there is a common pattern to these IoT devices or “things.” They have sensors to “observe” the environment and collect data. This data may be simple sensor readings like temperature measurements, to complex unstructured datatypes like sound and video. Some processing is done on the device itself, which is called edge processing. IoT devices usually have a very limited processing and storage capability due to their low cost. For larger processing and comparing to historical data, these devices upload data to a remote server or the Cloud. Newer advanced IoT devices have built‐in connectivity to the Cloud with options like Wi‐Fi, Bluetooth, or cellular. Low‐power (and low‐cost) devices usually use a gateway to connect and upload data to the Cloud. At the Cloud, the data can be processed on bigger, faster computers often arranged into large clusters in data centers. Also, we can combine the device data with historical data from the same device and from many other devices. This can generate new and more complex outcomes not possible at the edge alone. The results generated are then downloaded back to the device using the same connectivity options. These IoT devices may also need to be managed remotely with timely software updates and configuration—that is also done through the Cloud. Figure 1.2 shows a very high‐level overview with the scale of data handled at each level.

Figure 1.2: Data volumes on the consumer Internet
We are putting billions of smart connected devices on the Internet. We have smartphones capturing, storing, and transferring terabytes of photos and videos. Security cameras collect video feeds 24×7. GPS devices, RFID tags, and fitness trackers continuously monitor, track, and report motion. We have moved our library off the shelves and into hundreds of eBooks on our Kindles. We moved from tapes and CDs to MP3s to downloaded music libraries on apps. Netflix consumes 15% of the world's Internet bandwidth. And all this is only the consumer Internet.
Rise of the Machines
There is a parallel data revolution happening in the industrial world with even bigger outcomes. This is a whole new Internet being championed by companies like General Electric, Siemens, Bosch, etc., especially for industrial applications. It's known as the Industrial Internet or Industry 4.0 in Europe. Instead of smaller consumer devices, heavy machinery like gas turbines, locomotives, and MRI machines are transformed into smart devices and connected to the Internet. These machines are upgraded with advanced sensors, connectivity, and processing power to enable edge analytics and connectivity to the industrial Cloud. Industrial machines generate terabytes and petabytes of data every day, probably much more than consumer devices. This needs to be processed in real‐time to understand what the machine is telling us and how we can improve its performance. We need to be able to, by observing sensor data, determine that an aircraft is due for service and should not be sent on a flight. Our MRI scanners should have extremely high accuracy to be able to capture images that can provide enough evidence for a doctor to diagnose a condition.
You can clearly see from Figure 1.3 that the scales of data increase in the industrial world along with the criticality of processing the data and generating outcomes in time. We can wait a couple of seconds for our favorite Black Mirror episode to buffer up. But a few seconds' delay in getting MRI results to a doctor may be fatal for the patient!

Figure 1.3: Data volumes on the industrial Internet
Exponential Growth in Processing
This is the Big Data revolution and we are all a part of it. All this data is of little use, unless we have a way to process it in time and extract value out of it. We are seeing an unprecedented growth in processing power of computing devices and a similar rise in storage capacity. Moore's Law of electronics states that the processing power of a computing device doubles every two years due to improvements in electronics. Basically, we can pack twice the number of transistors in the same form factor and double the processing power. Modern computing technology is making this law pretty much obsolete. We are seeing a growth of 10–100 times each year in processing power using advanced processors like NVIDIA GPU, Google TPU, and specialized FPGAs integrated using the System‐on‐Chip (SoC) technology. When we think of a computer, it is no longer a bulky screen with a keyboard and a CPU tower sitting on a table. We have microprocessors installed in televisions, air conditioners, washing machines, trains, airplanes, and more. Data storage volumes are rising from terabytes to petabytes and exabytes and now we have a new term introduced to describe Big Data, the zettabyte. We are getting good at improving processing on the device (edge) and moving the more intensive storage and processing to the Cloud.
This growth in data and processing power is driving improvements in the type of analysis we do on the data. Traditionally, we would program the computing devices with specific instructions to follow and they would diligently run these algorithms without question. Now we expect these devices to be smarter and use this large data to get better outcomes. We don't just want predefined rules to run all the time—but we want to achieve outcomes we talked of earlier. These devices need to think like a human. We are expecting computers to develop a visual and audio perception of the world through voice and optical sensors. We expect computers to plan our schedules like a human assistant would—to tell us in advance if our car will have issues based on the engine overheating and respond to us like a human with answers to questions we ask.
A New Breed of Analytics
All this needs a whole new paradigm shift in the way we conceptualize and build analytics. We are moving from predefined rule‐based methods to building Artificial Intelligence (AI) in our processing systems. Our traditional algorithmic methods for building analytics cannot keep up with the tremendous increase in the volume, velocity, and variety of data these systems handle. We now need specialized applications that were so far thought only possible by the human brain and not programmed in computers. Today, we have computers learning to do intelligent tasks and even out‐performing humans at them. Dr. Andrew Ng, Stanford Professor and the founder of Coursera, famously said, “AI is the new electricity.” During the Industrial Revolution, just as electricity touched every industry and every aspect of human life and totally transformed it—we are seeing AI doing the exact same thing. AI is touching so many areas of our lives and enabling outcomes that were considered impossible for computers. Big Data and AI are transforming all aspects of our lives and changing the world!
Examples of AI performing smart tasks are recognizing people in photos (Google Photos), responding to voice commands (Alexa), playing video games, looking at MRI scans to diagnose patients, replying to chat messages, self‐driving cars, detecting fraudulent transactions on credit cards, and many more. These were all considered specialized tasks that only humans could do. But we now have computer systems starting to do this even better than humans. We have examples like IBM's Watson, an AI computer beating the chess grandmaster. Self‐driving trucks can take cross‐country trips in the United States. Amazon Alexa can listen to your command, interpret it, and respond with an answer—all in a matter of seconds. The same holds for the industrial Internet. With many recent examples—like autonomous trucks and trains, and power plants moving to predictive maintenance and airlines able to anticipate delays before takeoff—we see AI driving major outcomes in the industrial world. See Figure 1.4.

Figure 1.4: AI for computer vision at a railway crossing
AI is starting to play a role in areas that no one would have thought of just 2 or 3 years ago. Recently there was news about a painting purely generated by AI that sold for a whopping $432,500. The painting sold by Christie's NY was titled “Edmond de Belamy, from La Famille de Belamy.” This painting was generated by an AI algorithm called Generative Adversarial Networks (GAN). You will see examples and code to generate images with AI in Chapter 6. Maybe you can plan your next painting with AI and try to fetch a good price!
Another interesting AI project was done by the NVIDIA researchers to take celebrity face images and generate new ones. The result was some amazing new images that looked absolutely real, but did not belong to any celebrity. They were fakes! Using random numbers and patterns learned by “watching” real celebrity photos, the super‐smart AI was able to create indistinguishable fakes. We will see cool AI examples like these in Chapter 6.
What Makes AI So Special
Imagine a security camera system at a railway crossing. It captures terabytes of video feeds from multiple cameras 24×7. It synchronizes feeds from several cameras and shows them on a screen along with timing information from each video. Now a human can look at this feed live or play back a specific time to understand what happens. In this case, the computer system handles the capturing and storing of data in the right format, synchronizing several feeds and displaying them on a common dashboard. It performs these tasks extremely efficiently without getting tired or complaining.
A human does the actual interpretation of the videos. If we want to check if there are people crossing the track as a train is about to approach, we rely on a human to check this in the feed and report back. Similar surveillance systems are used to detect suspicious behavior in public spaces or fire hazards on a ship or unattended luggage at an airport. The final analysis needs to be done by the human brain to pick up the patterns of interest and act on them. The human brain has amazing processing power and built‐in intelligence. It has the intelligence to process hundreds of images per second and interpret them to look for items of interest (people, fires, etc.). The drawback is that humans are prone to fatigue over time and tend to make errors. Over time, if a security guard continuously watches live feeds, he or she is bound to get tired and may miss important events.
Artificial Intelligence is all about building human‐like intelligence into computing systems. With the security feed example, along with displaying the synchronized video feeds, the system can also recognize significant activities, which builds an AI system. To do this, the system needs more than just large data and processing power. It needs some smart algorithms that understand and extract patterns in data and use these to make predictions on new data. These smart algorithms constitute the “brain” of our AI system and help it perform human‐like activities.
Normal computer systems are very good at performing repetitive tasks. They need to be explicitly programmed with the exact instructions to perform actions on data and they will continuously run these actions on any new data that comes in the system. We program these instructions in code and the computer has no problem executing this code over and over millions of times. Modern computing systems can also handle parallel processing by running multiple jobs simultaneously on multi‐core processors. However, each job is still a predetermined sequence programmed in it. This is where the earlier activity of processing video feeds and showing on a display fit perfectly. You can feed the system with footage from hundreds of cameras simultaneously and it will keep formatting the video, store it, and display it on‐screen without any loss—as long as the computing resources (CPU, memory, and storage) are adequate. We can have hundreds of video feeds coming into the system and it will do an excellent job storing them, synchronizing them, and displaying them on‐screen for us.
However, in order to understand these videos and extract valuable knowledge from them, it needs a totally different capability. This capability that we as humans have taken for granted is known as intelligence…and is a pretty big deal for computers. Intelligence helps us look at videos and understand what is happening inside them. Intelligence helps us read hundreds of pages of a book and summarize the story to a friend in a few words. Intelligence helps us learn to play a game of chess and over time get good at it. If we can somehow push this intelligence into computers then we have a lethal combination of speed and intelligence, which can help us do some amazing things. This is what Artificial Intelligence is all about!
Applications of Artificial Intelligence
AI has found many applications in our lives. As we speak, more AI applications are being developed by smart engineers to improve different aspects of our lives.
A very popular application of AI is in knowledge representation. This involves trying to replicate the human brain's super‐ability to store large volumes of information in a manner that's easy to retrieve and correlate with so as to answer a question. If I ask you about your first day at your first ever job you probably remember it pretty well and hopefully have fond memories. You may not do so well remembering, say, the 15th day, unless something major happened then. Our brain is very good at storing large volumes of information that is relevant along with a context for it. So, when needed it can quickly look up the right information based on the context and retrieve it. Similarly, an AI system needs to convert volumes of raw data into knowledge that can be stored with context and easily retrieved to find answers. A good example of this is IBM's Watson, which is a supercomputer that is able to learn by reading millions of documents over the Internet and storing this knowledge internally. Watson was able to use this knowledge to answer questions and beat human experts at the game of Jeopardy!. IBM is also teaching Watson medical diagnosis knowledge so that Watson can help develop medical prescriptions like a doctor. See Figure 1.5.

Figure 1.5: IBM Watson beating Jeopardy! champions
(Source: Wikimedia)
Another popular and even cooler application of AI is in building a sense of perception in machines. Here the computer inside of a machine collects and interprets data from advanced sensors to help the machine understand its environment. Think of a self‐driving car that uses cameras, LiDAR, RADAR, and ultrasound sensors to locate objects on the road. Self‐driving cars have AI computers that help them look for pedestrians, cars, signs, and signals on the road and make sure they avoid obstacles and follow traffic rules. Figure 1.6 shows Google's self‐driving car, Waymo.

Figure 1.6: Google's self‐driving autonomous car
(Source: Wikimedia)
AI can also be used for strategy and planning, where we have smart agents that know how to interact with real‐world objects and achieve given objectives. This could be an AI beating the Grandmaster at a game of chess or an industrial agent or robot picking up your online orders from an Amazon warehouse and preparing your shipment in the fastest manner.
More applications of AI include recommendation engines like Amazon uses, which propose the next items you may be interested in based on your purchase history. Or Netflix recommending a movie you will like based on past movies you have seen. Online advertisement is a huge area where AI is used to understand patterns in human activity and improve visibility to products for sale. Google and Facebook automatically tagging photos of your friends is also done using AI.
Video surveillance is another area that is being revolutionized by AI. Recently many police teams have started using AI to identify persons of interest from video footage from security cameras and then track these people. AI can do much more than just find people in security footage. We are seeing AI understand human expressions and body posture to detect people with signs of fatigue, anger, acts of violence, etc. Hospitals use camera feeds with AI to see if patients are expressing high levels of stress and inform the doctor. Modern cars, trucks, and trains use driver cameras to detect if a driver is under stress or getting drowsy and then try to avoid accidents.
Last but not least, the industry that was one of the foremost to start adopting it and is making the most of the latest advances in AI is video gaming. Almost all modern games have an AI engine that can build a strategy for gameplay and play against the user. Some of the modern games have such an amazing engine that it captures the flawless rendition of the real world. For example, in my favorite game, Grand Theft Auto V, the railway crossing interactions are extremely realistic. The AI inside the game captures all aspects of stopping the traffic, flashing crossing lights, passing the train, and then opening the gates to allow traffic to pass, absolutely perfectly. Using methods like Reinforcement Learning, games can learn different strategies to take actions and build agents that can compete with humans and keep us entertained.
The field of AI that has really jumped in prominence and attention over the past years is Machine Learning (ML). This will be our area of focus for this book. ML is all about learning from data, extracting patterns, and using these patterns to make predictions. While most people put ML as a category under AI, you will find that modern ML is pretty much a major influencer in different areas of AI applications. In fact, you may struggle to find AI without some learning element of ML. If you think back to the different AI applications we discussed, ML touches all of them in some way or another.
IBM Watson builds a knowledge base and learns from this using Natural Language Processing (an area of ML) to be good at prescribing solutions. Self‐driving cars use ML models—more specifically Deep Learning (DL) models—to process huge volumes of unstructured data to extract valuable knowledge like location of pedestrians, other cars, and traffic signals. An agent playing chess uses Reinforcement Learning, which is again an area of ML. The agent tries to learn different policies by observing games of chess over and over again and finally gets good enough to beat a human. This can be compared to how a child learns to play the game too, but in a highly accelerated fashion. Finally, the robot finding your items and preparing your order is mimicking what 10 or more warehouse workers would be doing—of course, without the lunch break!
One topic gaining a lot of attention in the world of AI is Artificial General Intelligence (AGI). This is an advanced AI that is almost indistinguishable from humans. It can do almost all the intellectual tasks that a human can. Basically, it can fool humans into thinking that it's human. This is the kind of the stuff you will see on TV shows like Black Mirror or Person of Interest. I remember during a 2018 Google event that CEO Sundar Pichai demonstrated how their virtual assistant could make an appointment calling a restaurant (see Figure 1.7). The reservations attendant could not tell that a computer was on the other end of the line. This demo spun off many AI ethics debates and lots of criticism of Google for misleading people. Sure enough, Google issued an apology and released an AI ethics policy basically saying they won't use AI for harm. However, the fact remains that AI capability is maturing by the day and will greatly influence our lives more and more.

Figure 1.7: Google CEO demonstrating Duplex virtual assistant fooling the reservations attendant
(Source: Wikimedia)
Building Analytics on Data
Development of analytics depends on the problem you are trying to solve. Based on the intended outcome you are chasing, you first need to understand what data is available, what can be made available, and what techniques you can use to process it. Data collected from the system under investigation may be human inputs, sensor readings, existing sources like databases, images and videos from cameras, audio signals, etc. If you are building a system from scratch, you may have the freedom to decide which parameters you want to measure and what sensors to install. However, in most cases you will be dealing with digitizing an existing system with limited scope to measure new parameters. You may have to use whatever existing sensors and data sources are available.
Sensors measure particular physical characteristics and convert them into electrical signals and then into a series of numbers to analyze. Sensors measure characteristics of a system under study like motion, temperature, pressure, images, audio, video, etc. These are usually located at strategic positions so as to give you maximum details about the system. For example, a security camera should be placed so that it covers the maximum area you want to watch over. Some cars have ultrasound sensors attached at the back that measure distance from objects to help you when you're reversing. These physical characteristics are measures and converted into electrical signals by sensors. These electrical signals then flow through a signal processing circuit and get converted into numbers that you can analyze using a computer.
If our system already has sensors collecting data or existing databases with system data, then we can use this historical data to understand our system. Otherwise, we may have to install sensors and run the system for some time to collect data. Engineering systems also use simulators to generate data very similar to how a real system would. We can then use this data to build our processing logic—that is our analytic. For example, if we want to build temperature control logic to simulate thermostat data, we can simulate different temperature variations in a room. Then we pass this data through our thermostat analytic—which is designed to increase or decrease heat flow in the room based on a set temperature. Another example of simulation may be generating data on different stock market conditions and using that to build an analytic that decided on buying and selling stock. This data collected either from a real system or simulator can also be used to train an AI system to learn patterns and make decisions on different states of the system.
Whether you are building an AI‐ or non‐AI–based analytic—the general pattern for building is the same—you read inputs from data sources, build the processing logic, test this logic on real or simulated data, and deploy it to the system to generate desired outputs. Mathematically speaking, all these inputs and outputs whose values can keep varying over time are called variables. The inputs are usually called independent variables (or Xs) and the outputs are called dependent variables (or Ys). Our analytic tries to build a relationship between our dependent and independent variables. We will use this terminology in the rest of the book as we describe the different AI algorithms.
Our analytic tries to express or map our Ys as a function of our Xs (see Figure 1.8). This could be a simple math formula or a complex neural network that maps independent variables to dependent ones. We could know the details of the formula—meaning that we know the intrinsic details about how our system behaves. Or the relationship may be a black box where we don't know any details and only use the black box to predict outputs based on inputs. There may be an internal relationship between our dependent variables or Xs. However, typically we choose to ignore that and focus on the X‐Y relationships.

Figure 1.8: Expressing Ys as a function of Xs
Types of Analytics: Based on the Application
The job of the analytic is to produce outputs by processing input data from the system so humans can make decisions based on the system. It is extremely important to first understand the question we want to ask the system, before jumping into building the analytic. Based on the question we are asking, there may be four categories of analytics. The following sections explain some examples with the questions they try to answer.
Descriptive Analytics: What Happened?
These are the simplest kind but are also very important because they try to clearly describe the data. The outputs here may be statistical summaries like mean, mode, and median. We could have visual aids like charts and histograms that help humans understand patterns in the data. Many business intelligence and reporting tools like Tableau, Sisense, QlikView, Crystal Reports, etc., are based on this concept. The idea is to provide users with a consolidated view of their data to help them make decisions. The example in Figure 1.9 shows which months we had a higher than usual monthly spending.

Figure 1.9: Describe the data to humans
Diagnostic Analytics: Why Did It Happen?
Here we try to diagnose something that happened and try to understand why it happened. The obvious example is when a doctor looks at your symptoms and diagnoses the presence of a disease. We have systems like WebMD that try to capture this amazing human intelligence that doctors possess and give us a quick initial diagnosis. Similarly, healthcare machines like MRI scanners use diagnostic analytics to try to isolate patterns of disease. This type of analytic is also very popular in industrial applications for diagnosing machines. Using sensor data, industrial control and safety systems use diagnostic rules to detect the presence of a failure occurring and try to stop the machine before major damage occurs.
We may use the same tools used in descriptive analytics like charts and summaries to diagnose issues. We may also use techniques like inferential statistics to identify root causes of certain events. In inferential statistics, we establish a hypothesis or assumption saying that our event is dependent on certain Xs in our problem. Then we collect data to see if we have enough data evidence to prove this assumption.
The analytic here will normally provide us with evidence regarding a particular event. The human still has to use her intuition to decide why the event occurred and what needs to be done. The example in Figure 1.10 shows how the engine oil temperature kept increasing, which might have caused the engine failure.

Figure 1.10: Diagnose an issue using data
Predictive Analytics: What Will Happen?
The previous two AI applications dealt with what happened in the past or in hindsight. Predictive analytics focus on the future or foresight. Here we use techniques like Machine Learning to learn from historical data and build models that predict the future. This is where we will primarily use AI to develop analytics that make predictions. Since we are making predictions here, these analytics extensively use probability to give us a confidence factor. We will cover this type of analytic case in the rest of the book.
The example in Figure 1.11 shows weather websites analyzing history data patterns to predict the weather.

Figure 1.11: Weather forecasting
(Source: weather.com)
Prescriptive Analytics: What to Do?
Now we take prediction one step further and prescribe an action. This is the most complex type of analytic and is still an active area of research and also some debate. Prescriptive can be looked as a type of predictive analytic; however, for an analytic to be prescriptive, it also clearly states an action the human must take. In some cases, if the confidence on the prediction is high enough, we may allow the analytic to take action on its own. This analytic depends heavily on the domain for which you are trying to make the prediction. To build impactful prescriptive analytics, we need to explore many advanced AI methods.
The example in Figure 1.12 shows how Google Maps prescribes the fastest route by considering traffic conditions.

Figure 1.12: Route to work
(Source: Google Maps)
Figure 1.13 shows the types of analytics at a high level. We see that the complexity rises from descriptive to prescriptive and the assistance to human decision‐making also increases—with prescriptive having potential to drive complete automation. I used examples from different domains to stress that analytics is a general discipline applicable in multiple domains—Healthcare, Engineering, Finance, Weather, etc. If you rethink each example, we tend to ask ourselves these questions and calculate the answers in our brain.
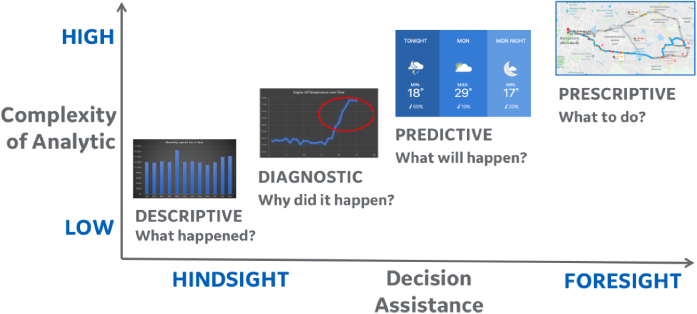
Figure 1.13: Types of analytics
We look at our bank statements for different months and use descriptive analytics to deduce that we spent more money in a certain month compared to others. Then we dig deeper and try to diagnose why that was—maybe there was a family vacation that led to increased expenses. We use mental models to correlate our daily events such as consumption of certain cuisines like Thai food (rich in fish oil) to allergy symptoms we may have encountered. We all become weather experts by making inferences like, “It usually rains in Bangalore during the evenings in August.” And we often get these predictions right. Finally, we know of our expert mechanics who can sense overheating or certain noises in the car's engine and prescribe actions like oil changes or that the water level is low.
Each analytic has a case for AI. We are making these smart decisions in our brain and we can build AI systems that can do the same. We can build an AI system that tries to delegate these thought processes to the computer and help us get the insights as fast as possible with maximum accuracy. This is what we will do with AI‐based analytics. AI can be applied to any of the analytics applications to improve upon the results.
Types of Analytics: Based on Decision Logic
A different way to classify analytics that is more common in the industry is based on the way the decision logic is encoded in the analytic. Based on how we write the logic, we may have the following two types of analytics.
Rules‐Based or Physics‐Based Analytics
Rules‐based (also referred to as Physics‐based) is the more traditional approach to building analytics. Here you need to know how the different independent variables are related to form your dependent variables (see Figure 1.14). This approach is common when you have a good understanding of the system internals and understand how the variables relate. You use this knowledge and program explicit equations that the computer then calculates.

Figure 1.14: Rules‐based analytics models
Data‐Driven Models
Here we don't fully understand the system under study. We use historical data to derive patterns and encode these patterns into artifacts called models. With more and more data, the models get good at making predictions and form the internals of our analytic (see Figure 1.15). As you may have guessed, this approach is gaining huge popularity with growth in data being collected from real‐world systems. This is also going to be the focus of this book.

Figure 1.15: Data‐driven analytics models
Building an Analytics‐Driven System
Finally, let's look at a simple example of analytic development. This is by no means a full system with all details. We will just talk about it at a high level to whet your thinking on how the core analytic forms part of a bigger system and what the system considerations are. Keeping these in mind is very important when you are developing any type of analytic. Also, we will talk about three concepts that will help us decide the type of analytic to be developed.
Let's take an example of a system to measure the calories burned by a person while exercising. The outcome we are interested in is the number of calories burned—this is our dependent variable, our Y. To measure this, we want to consider the independent variables we can measure—our Xs. If we can establish our dependent variable as a function of the independent variables, we have an analytic.
To measure the exercise, we need to measure the motion that happens during the exercise. The motion is directly proportional to the outcome, which is the number of calories burned. The more you move, the more calories you burn. We could measure motion in several ways, discussed next.
Subject Walking on a Treadmill
We make the subject—our person of interest—run on a treadmill (see Figure 1.16). We find the distance run and try to use this to calculate the amount of exercise. Based on the distance, time, and weight of the individual, we can develop an equation that measures the calories burned in that period. This is a rules‐based analytic since you know exactly how the Xs relate to the Ys. This is a case of “known knowns”—we know all the variables and their relationships.

Figure 1.16: Person on treadmill
(Source: Wikipedia)
Fitbit Motion Tracking
We can use a Fitbit to measure the motion of the hand and correlate that to calories. Fitbit measures acceleration in three directions (see Figure 1.17). It is very difficult to relate this acceleration directly to steps walked or run and then to calories. For this problem, a data‐driven approach like Machine Learning is usually taken. We take samples from many people walking and measure the acceleration values corresponding to actions like walking and running. We use this data to train an ML model. After learning from a large volume of data, the ML model becomes good enough to start predicting the number of steps taken from raw acceleration data. This data of steps taken can then be mapped to calories burned. ML gets us into the area of “known unknowns.” We know the Xs that affect our outcome but don't know the relationship to our Y. We use data to determine that relation.

Figure 1.17: Fitbit wrist device
(Source: Wikipedia)
Using External Cameras
Now what if we decide to use a camera to monitor a person while he is walking or running (see Figure 1.18)? No sensors are attached to the person and there is no special equipment like a treadmill. The sensor data we have here is video footage of the person walking. The video is basically a sequence of images and each image is digitized as an array of pixel intensity values. This is unstructured data because we only have a big blob of data without formal columns. From this big blob of data, how do we identify where the person is and measure his motion? This is where Deep Learning (DL) comes into play. DL builds large models with many layers of learning that helps decode this large unstructured data and extract knowledge. This is an area where we deal with “unknown unknowns.” There are too many Xs and we don't know how they relate to Ys. We will cover Deep Learning in detail in Chapter 4 and also show examples of building, training, and using a model developed in Keras.

Figure 1.18: Cameras tracking motion
(Source: Wikipedia)
Summary
This concludes Chapter 1. We talked about how our world is being transformed by digitization, both in the consumer and industrial spaces. We see exponential growth in volumes of data generated by devices, more than a hundred times growth in processing power and rise of Artificial Intelligence (AI) to give us a new breed of applications that “learn” from experience. The next chapter explores AI further and talks about the most popular AI application—something that is transforming all other applications of AI—Machine Learning.