
CHAPTER 5
The Processes behind the Use of Alternative Data
5.1. INTRODUCTION
As explained in a lot of detail in the previous chapters, there are several potential pitfalls in the implementation of an alternative data strategy. In this chapter, we will discuss how to organize these implementation efforts in order to deliver a successful strategy. We must emphasize that the key to this success is to have the right processes, systems, and people in place. There are, of course, external constraints, such as the availability of talent in the marketplace, or internal ones, like budgeting and legacy systems. These will also determine how successful one can be in implementing an alternative data strategy.
We must also note that once a given strategy is deployed in production, that does not mark an end of the work. In fact, the signals generated from alternative data may begin to degrade. This means that the accuracy and performance achieved in model development and as measured through backtesting declines in time. Reasons for this can range from non-stationarity through technical implementation problems. While we cannot solve the problem of non-stationarity except under very special circumstances, we can address most other performance degradation issues by establishing and acting upon a suitable monitoring process. We will discuss this matter further.
We will divide the process of developing an alternative data process into a number of steps as follows:
- Set up the vision and strategy.
- Identify the relevant data asset(s) according to the investment strategy, mandate, and constraints.
- Perform due diligence on the vendors of those data assets.
- Pre-assess risks (e.g. technological, legal, cyber, etc.).
- Pre-assess the existence of signal(s) – run a proof-of-concept (POC) on a sample of data. If the outcome of the last step is positive, then one can proceed to the next steps.
- Perform data onboarding.
- Perform data preprocessing (if needed).
- Perform signal extraction (modeling).
- Implement the process (or deploy in production).
The sequence of steps may vary depending on the degree to which data has already been preprocessed.
5.2. STEPS IN THE ALTERNATIVE DATA JOURNEY
5.2.1. Step 1. Set up a Vision and Strategy
The first question an investor/risk manager can ask is: shall we begin to venture along the alternative data journey? This is a strategic question that involves the highest-level decision makers within an organization such as the chief investment officer (CIO), the chief risk officer (CRO), or the chief executive officer (CEO). The answer lies in their convictions that this kind of data has alpha after discounting for its price and the complexities behind its incorporation in the existing processes. It is a complex question to answer based on impressions and not on substantial quantitative analysis. As we remarked previously, the press has conveyed mixed messages and stories of success or the lack of it. Hopefully this book will provide more clarity in that direction.
Reading whitepapers by vendors is a good first step to be aware about the existence of signals in data and have a rough idea about the strength of the signal. However, running a small proof-of-concept (POC) along the lines of what we describe in the following could be a more convincing step for the decision makers in an organization. POCs are not costly to run because they neither require a complex infrastructure nor do they involve the complexities of a live implementation. The advantage of a POC is that decision makers can have a more tangible proof on their portfolio of whether or not a dataset is valuable.
Once the decision is made to attempt going along the alternative data path, a strategy must be put in place. In general, the strategy will depend on the type of investor. For example, one strategic choice could be whether to opt for raw data acquisition or for derived signals (see Section 5.4 on data vendors who provide this service). Quantitatively sophisticated investors (e.g. hedge funds) typically build their own analytics and hence prefer purchasing raw or lightly processed data.1 For this purpose, they require access to good-quality raw data and the deployment of cutting-edge technology and algorithms. Co-location of analytics and data could also speed up the research and deployment of signals.
More traditional but still quant-minded investors (e.g. large sell-side banks or big funds) are interested in derived analytics and more intuitive solutions. Smaller shops are less willing to employ technology, data science, and programming capabilities. They would opt for low-cost maintenance/build analytics platforms and sourcing on-demand of data science talent. Finally, there are small fintechs whose purpose is not to invest but to buy data and resell it in the form of a trading signal (e.g. CargoMetrics).
Hence, according to the type and size of the investor (or fintech), a strategy consists of defining a roadmap of data science capabilities and technology. In what follows, we will describe the full journey from raw data to signals. As we have just explained, an investor does not have to embark on all these steps as they might prefer the acquisition of curated signals. In other words, most of the steps that we will describe can be performed on the side of the data vendor.2
We note that regulatory, risk and reputational considerations should be monitored throughout the process we will describe to minimize the risk of investing in signal products that do not meet the buyer/vendor firm's relevant appetites.
5.2.2. Step 2. Identify the Appropriate Datasets
Once a strategic decision has been taken, the next step when starting an alternative data journey is to understand which data assets to pick up and test for a signal from a virtually infinite universe. Essentially, we are seeking to prune our search space. Most of the datasets will have potentially limited value, but this is not known upfront. This is a difficult task but new professions with the right skillset to perform it are starting to appear. In particular these new roles include those of data scouts or data strategists (we use the terms interchangeably). The role of the data scout is crucial for an organization wanting to have an edge. In fact, a lot of experience and common sense is needed to assess whether a data asset is worth purchasing and to make a decision how to test it. To make a judgment call with only a minimal amount of testing is difficult. However, it is necessary, given that it is too costly to do a thorough test for every single dataset on the market. There is obviously also a limited budget for purchasing datasets or samples of them. In this mission, the data scouts must be assisted by SMEs (subject matter experts) who deeply understand the markets and the investment portfolios and the risks of their institutions.
Organizations that have not established such highly specific roles can still rely on the experience of the chief data officer and their data scientists. There are also consulting firms such as Neudata, which can help outsource part of the data scout function to keep track of new alternative datasets. Neudata is compensated by data users, as opposed to data sellers. This is somewhat different to data markets discussed in Section 2.3, where typically the data marketplace owner is compensated in some form by the data seller. The emergence of outsourced data scouting services and data marketplaces is likely to help simplify the task of finding alternative datasets.
Depending on the stage of processing, the data scout/chief data officer has to approach the selection of a data asset differently (see Section 5.4). It is important to say that the bias on the vendor's side is to avoid advertising any omissions in the data. Hence, there are some checks to be performed upfront by the buyer in order to make sure that there aren't any gaps that could appear at a later stage or omissions that could become critical. This should be the case, even if the provider claims to be selling signals that are already “clean.”
We described in Section 1.8 some dimensions on which a data asset can be projected. It is important to note that the asset classes required, the investment mandate and constraints that an asset manager has can help with preselecting a dataset. For example, is the asset manager investing only in fixed income instruments issued by governments and public entities? In that case, foot traffic data for only very specific shopping malls might be less useful at first glance. PMI indicators can be much more appropriate for this specific purpose. In this sense, a good approach to data asset selection can be both bottom-up and top-down. It can be bottom-up because one could start from the portfolio constituents and work out which data assets in the market could contain signals for the asset classes under management. It can also be top-down because one could start from a specific data asset (maybe a new entrant in the market) and cascade down on which asset classes it could have useful information about.
Coverage, breadth, and depth are also important considerations here. For example, sometimes it is better to try to increase coverage rather than focus on improving modeling techniques, such as adding extra complexity (which could even lead to overfitting). Whether this is possible must be considered at this stage.
5.2.3. Step 3. Perform Due Diligence on Vendors
As we mentioned previously and will again examine in detail in Section 5.4, there is a diverse spectrum of alternative data providers. Some of them can be big organizations with a long track record and history while others can be relatively new, small, and niche providers. Third-party due diligence is then needed to avoid risk of disappearance of these companies after subscribing to their data feeds. The risk of ceasing activity is, of course, an extreme issue but it is not the only one we have to be concerned about with respect to third parties. In general, organizations that create, gather, and/or distribute alternative data could often operate with immature risk and control frameworks. This means that the data they sell could be prone to errors and hence not truthful, or potentially obtained through processes that are not legally cleared. Hence, working with such vendors can be also a source of reputational and legal risk.
For example, third-party checks are performed by data aggregators for alternative datasets that they distribute to their clients. These are onboarded after a careful due diligence of their providers. If such a due diligence service is not available for a dataset we want to purchase, we have to make such checks ourselves, maybe through the help of external consultants. In any case, all these assessments should be performed before purchasing a dataset.
5.2.4. Step 4. Pre-assess Risks
There are many risks associated with alternative data, as we already discussed in Section 3.2. We discussed third-party due diligence in the previous section. The risks in this section are risks that are not associated with a third party. Some of this non-third-party risk assessment can be done at an early stage (i.e. before even purchasing a data asset by working with a sample of it or through metadata only). We must make sure that we do not expose ourselves to accuracy/validity risk of the data, privacy risk, and material non-public information (MNPI) risks.
From the metadata and the contractual agreement proposed by the vendor, we can also consider infrastructure risks connected to the frequency and the structure of the data. Can our infrastructure cope with the velocity of the data (e.g. millisecond ticks)? Is it also able to ingest the required volumes of data? This problem is present in many forms of unstructured data where volumes are typically bigger.
5.2.5. Step 5. Pre-assess the Existence of Signals
This step is a quick-and-dirty one to make sure that it is worth investigating the data asset further. As we explained, onboarding of data and processing it in a production environment might be costly so this step will help us to avoid committing time and resources that could lead to something that ultimately is of little use. Some data vendors already sell signals or evidence of a signal in the form of whitepapers (see Section 5.4 on data vendors) as we mentioned in Section 5.2.1. This could greatly facilitate the work of signal discovery if the asset manager wants to go their own route of working out a signal from the raw data. If they want to acquire a final signal, then this step can be skipped.
Getting a sample of the data and its metadata will be enough to assess (1) the quality of the data (e.g. missing values, anomalies), (2) what modeling techniques could be relevant and whether the data science team has expertise in them, and (3) possibly run some very simple transformations and models. Due to the requirement to identify signals quickly, coarser analyses techniques are typical (e.g. binned ![]() analyses for potential signal factors). Note that, with respect to the last point, the lack of a signal when attempting a very simple model is not sufficient to discard the dataset. A more sophisticated set of nonlinear models can be also attempted provided there is a solid justification to suspect nonlinearities in the data. Open source libraries make this last step straightforward even in the case of complex deep learning models. We also note that datasets in isolation may not yield a signal, but joining them with a number of other datasets could result in finding more usable signals.
analyses for potential signal factors). Note that, with respect to the last point, the lack of a signal when attempting a very simple model is not sufficient to discard the dataset. A more sophisticated set of nonlinear models can be also attempted provided there is a solid justification to suspect nonlinearities in the data. Open source libraries make this last step straightforward even in the case of complex deep learning models. We also note that datasets in isolation may not yield a signal, but joining them with a number of other datasets could result in finding more usable signals.
Again, all this could happen without onboarding the data and setting up regular data feeds. A sample of a few thousand observations may be enough in many cases. It could be enough to create a very simple proof of concept to assess whether the data asset contains any alpha after subtracting costs.
At this stage it is also important to think about model risks and trade-offs. Does the model need to be interpretable by portfolio managers? If not, a deep learning model can, in principle, provide a better fit. But, is it overfitting? To check this, appropriate out-of-sample tests must be considered. Does it need to deliver results on a mobile device and also in real time? Hence, a simpler model that can deliver results even in the case of slow connectivity must be devised, typically by sacrificing some accuracy.
The list of datasets to explore should be prioritized according to the expected value likely to be added and also the business demands. Questions from the business can, for example, help us to focus on datasets relevant to particular asset classes, geographies, and so on. The experience of a data strategist could also prove useful in this regard.
5.2.6. Step 6. Data Onboarding
Even if the previous steps did not touch upon an implementation in production, there were still some overheads to be considered (e.g. infrastructure setup and legal arrangements with the data vendor). Once they have been dealt with and the presence of a stable signal has been proved, it is time to consider a fair price for which the dataset can be purchased. We discussed the delicate issue of pricing in Sections 2.4–2.6. If a price is agreed, the next step is to onboard the data in the local infrastructure.
Data sources often come with their own schema (or sometimes with no schema at all, which can make interpretation more challenging). This can affect how we work with the dataset. Any data we receive from an external (or indeed internal source) needs to be stored in a database. The nature of how we store the dataset will be dependent on its schema. For example, relatively well-structured high-frequency tick data could be stored in columnar databases like KDB. By contrast, other lower-frequency structured datasets might be better suited to SQL databases. A lot of alternative data, especially in its raw form, tends to be relatively unstructured; hence, it might make sense to store it in a data lake.
5.2.7. Step 7. Data Preprocessing
It is likely that a dataset requires some element of preprocessing when implementing in production. One common part of this is in tagging assets in a structured dataset. A data source describing firm-specific data might be tagged with Bloomberg tickers but without any other ticker identifiers. However, a fund might use ISIN codes internally as their common ticker mapping. Hence, the Bloomberg tickers would all need to be mapped to ISINs. This is done in order to facilitate joining it with other datasets. We would need to join market data for backtesting of trading strategies or indeed other alternative datasets to generate composite signals. For raw datasets, we would likely need to do entity matching from scratch. See Section 3.3.1 for a more detailed discussion on entity matching.
If datasets have time stamps with different time zones, it results in misaligned points when joining these datasets. All sorts of problems can ensue, such as using future data. It is possible to keep time stamps in their original time zone in each dataset (and keep track of that). However, it is much easier to convert them to a common time zone, such as UTC, during an earlier preprocessing stage.
In some instances, the time zone data might be missing, hence we would need to infer it. Typically, one way to infer it is by joining with another dataset, which is likely to have correlated points. For high-frequency data, we might be able to infer it by joining it with an indicator for major economic data releases. Typically, for important events, like the US employment report, FOMC, and so on, we would observe jumps in assets like FX, rates and equity futures. Hence, we can infer the time zone of our market data by observing where these jumps are in the month. Other important fields could also be missing, not purely the time stamp, that need to be inferred.
There might be other sorts of discrepancies in time stamps. For very high-frequency data, the time stamp between different sources might be slightly offset, which can prove problematic when aligning them.
There might also be the case where we need to fill in missing points in our dataset. The simplest way is to interpolate. In Chapter 7, we discuss more sophisticated ways of filling missing data points, which can help to preserve the properties of the dataset better (such as mean and variance). We give a specific example for CDS data, in Chapter 8, where data might be missing in certain tenors. If a dataset has very little structure, we may need to do a significant amount of preprocessing in order to make it usable for signal generation later. This is especially likely to be the case if our dataset consists of data types such as text or images.
In general, data quality is fraught with challenges such as:
- Clarity. Is there sufficient data definition clarity to support decision making with the data?
- Uniqueness. Is there a single source of truth, both globally and within a given dataset?
- Internal consistency. Is the data internally structurally sound, with datatype requirements obeyed throughout dimensions?
- External consistency. Is the data externally structurally sound, with no impossible combinations of data attributes?
- Timeliness. Is the data available at the required time for a given application?
- Completeness. Is data missing irrespective of time?
- Validity. Is the data an accurate reflection of the real-world event(s) it describes?
- Veracity. Is the data credible, and what confidence level can be attributed to the data, given its context (including any transformations it has undergone)?
Throughout data's usage lifecycle, machine learning techniques can enhance quality by both automating existing tasks and extending monitoring to previously resistant quality dimensions. We will show some examples in Chapters 7, 8, and 9.
5.2.8. Step 8. Signal Extraction
Once the dataset has been fully preprocessed after our initial testing suggested a dataset had some promise, the next step is to construct the signals. For trading this is likely to entail a number of steps, such as the construction of strategies or indices. In some cases, the objective might be simple buy or sell signals, for example, for a quantitative hedge fund. Often this is done by combining the signal with those derived from other datasets. These signals are then fed into a portfolio optimizer to weight them. For discretionary traders, it may well simply be a forecast that is used as an input into the trading process. For economists, the signal is likely to be in the form of a forecast. For risk managers, a signal might involve the construction of volatility forecasts or other similar risk metrics, or signal to exit a certain market/asset class/asset. Whatever the purpose, we need to backtest any signal to see how it performed with historical data, if available and sufficient, as discussed in Section 2.5.
The signal extraction process is iterative and involves the use of SMEs and business analysts. Brainstorming sessions are a critical component of scaling the signals extraction process by generating testable hypothesis for data science resources. Hence, expertise in data and market trends is required to encourage full exploitation, and monetization, of the purchased data assets.
The end state of this step could be the lack of a signal or strong enough signal to justify implementation (even if Step 5 pointed in the opposite direction!). This will be judged by some pre-established success criteria or metrics such as the alpha generated by the signal averaged across a period of time minus the costs. If this is the case, a careful consideration must be made as to why this is the case. Is it because of mistakes – and hence this step should be repeated – or some other fundamental reason? The conclusion could be that there is indeed no signal. The findings should be archived and the process terminated here. In case of positive outcome of the signal extraction, the next step is to implement it in production.
5.2.9. Step 9. Implementation (or Deployment in Production)
So far, we have gone through a successful signal extraction stage and found a usable signal that has been validated in our analysis. We have also onboarded the dataset and preprocessed it. The final step is to create a production implementation of our model and to run it in a live environment.
For a POC, it is fine to receive data from a vendor in an ad-hoc way, such as via e-mail or USB key. However, in order to use data for production, we need to be able to retrieve it in an automated way. For high-frequency data, this will often require the writing of wrappers for APIs provided by the data provider, to ingest high-frequency data on a real-time basis. The time it will take to integrate such an API into a framework will depend on the format in which the data is provided to us. For lower-frequency data, such as daily or weekly data, we might potentially be able to download flat files (e.g. in CSV, XML, or Parquet format) on a batched basis, which is likely to be simpler to install.
From a production perspective, we need to make sure that our test infrastructure is also replicated, from ingesting the data, to preprocessing, generating the signal, and so on. This will require the rewriting of code, possibly even starting from scratch. For applications where high performance is required, this can mean shifting from languages used in data science such as Python and R, to languages like C++, Java, or Scala. It can also mean spending a significant amount of time making sure that any calculations are done on distributed infrastructure to speed up processing, if this wasn't already undertaken during the testing phase. For firms that have not dealt with such datasets before, it is likely that they will need to invest extra time and budget in developing such infrastructure.
At this stage, appropriate controls for risks must be put in place. For example, if one of the data feeds to the model disappears, we must receive a notification. If the trading signal is too strong and suggests high-volume trades that exceed trading limits, a “kill switch” control could be put in place.
5.2.10. Maintenance Process
Once a dataset is used as a production model, we need to monitor it. There are two types of live monitoring that can be put in place to detect dataset shifts and act accordingly. The first one follows the performance measures. This might be challenging in cases where there is not an established ground truth. For example, if it is a predictive classification model (e.g. stock going up or down), this could be a regularly generated confusion matrix. The second monitors the discrepancies between the distributions of the independent variables in the training dataset and the live data. We must stress that a model could also start producing poor forecasts because of purely mundane problems, such as one of the input features is missing due to a fault in the data flows or maybe because the sensors and the processes were reconfigured not to collect this information anymore, and the data vendor failed to inform us. Controls must be put in place to detect any such anomaly. Hence, alternative data variability which makes proactive quality monitoring and remediation much needed.
If deterioration in the model is detected, there are several actions that can be taken. First, we need to understand what caused the problem. Is it a mundane problem like the one mentioned above or is there evidence of a dataset shift? Second, we need to fix it. If the problem is technological, the remedy should be also technological. If it is due to a change in the processes that capture the data, the fix may not be that straightforward. There can be many reasons why this can occur. Data companies may shut down or they might simply stop publishing datasets, if the source data is no longer available, or they may simply change the format of the data. This will result in missing variables in our model. There is a reduction in the quality of data we receive from a data vendor, because the panel of data has changed significantly, which makes it less representative.
For more commoditized datasets, we may be able to substitute these easily with similar datasets. However, this might prove trickier for more unusual alternative datasets. Furthermore, within alternative data space, even for datasets within the same category, such as news, the way the dataset is generated and treated might differ significantly between vendors. Hence, we can't simply swap datasets without additional work and changes to the underlying model, like recalibration. If the missing variable has low marginal predictive power, for example, perhaps we could simply ignore that feature and not expect this to impact returns significantly. Of course, this is a temporary fix and a redevelopment of the model without that feature becomes necessary. If the problem is caused by a dataset shift, we must understand what type of shift that is. This can be challenging and also time consuming. It is not an exaggeration to say that detecting the reason for deterioration can take longer than model development itself.
There might well be other reasons why a model has stopped working as expected that are not related to data recording issues. It might be the case that the capacity of the trading strategy has been exceeded as more and more traders are replicating it and we start seeing alpha decay because of this. Furthermore, as mentioned in the introduction to this chapter, financial time series are often not stationary, whether we are referring to price data or macroeconomic data. Their properties can change over time. We can observe significant shifts in behavior of the market, such as when we observe changes in market regime. This change of regime may render the strategy loss making, as the market is no longer reacting to the factor we are modeling. Let's say we have had a model that aggregated Greek language news during the Greek debt crisis. At the time this was a major driver for EUR/USD. By contrast, once the worst turbulence had passed for the Greek debt crisis, such a dataset was unlikely to be as relevant for trading EUR/USD.
The maintenance process doesn't only encompass technical issues associated with the models. There is also a need to continually monitor any regulatory developments to make sure existing processes are compliant. This can also be useful, for example, in giving us prior warning about the discontinuation of datasets due to regulatory changes. Lastly, we need to make sure that we have sufficient manpower to run the maintenance process of our alternative data model. We are likely to need data scientists, data engineers, technologists, compliance officers, and others to help with such maintenance tasks.
5.3. STRUCTURING TEAMS TO USE ALTERNATIVE DATA
When structuring a team for dealing with alternative data, we note that in the long term, it is not sufficient purely to hire data scientists in isolation and ask them “do something with the data.” Data can only be monetized in an investment firm if it is used to help make profitable investment decisions. In many large firms, there has been effort to centralize alternative data initiatives into central teams, which cover several different parts of the pipeline from identification and sourcing of data, to ingesting data, and then analyzing data.
Data scouts/strategists are an important part of any alternative data process, to help locate and identify datasets externally and to act as a bridge with internal teams. As we noted in Section 5.2.2, a data scout requires very specific skills. It is not possible to evaluate every dataset in existence given the constraints of time and cost. Hence this initial identification stage to choose which datasets to evaluate more closely is key. As a result, a data scout is an essential figure in the team.
Data engineers need to be hired to deal with the challenges of ingesting large quantities of data and storing them. The skillset for data engineers will be somewhat different than that for data scientists, and will involve understanding how to distribute processes and how to create data lakes.
Data scientists work to analyze the data. For fundamental firms, this might involve answering specific questions from the portfolio managers. In a sense, we can think of data scientists as generalists with skills in several different areas, including coding and statistics, as well as an element of domain knowledge, so similar in skillset to traditional financial quants.
Centralization of the process of data purchasing is also likely to reduce costs of purchasing datasets, rather than having individual teams negotiating separately, potentially for the same datasets. When data purchasing is centralized, it can make it easier to keep track of which datasets a firm can access. By creating a centralized pipeline for dealing with new datasets, it can reduce the time and cost of the evaluation process.
It is also incumbent on the business to leverage these resources. For example, in funds, if portfolio managers do not see alternative data as part of their investment process, then it is unlikely that a firm will be able to extract much value from the whole exercise of developing an alternative data pipeline. Data strategists and data scientists need guidance from the business to understand what investment questions are the most important and what metrics would be most useful for the business. This will help to guide them in identification of which datasets are most likely to be useful. Ultimately, communication between the various teams is critical to ensure the success of using alternative data within an investment firm. Otherwise, the data scientists end up working in an isolated environment, unable to provide the business with insights. Communication is important to ensure that data scientists have the right resources for their job. If a lack of communication and internal politics means that data scientists are unable to even have access to data, it is likely they will leave.
The creation of centralized data science teams can often be done gradually, in particular in firms that have a more discretionary focus. With these types of firms, often it is a good idea to start with smaller alternative datasets, which are less resource intensive to investigate and do not require massive team to support using it. Often resources might be reassigned internally at the early stages. As the business side sees benefits from using such datasets, it helps to justify additional spending of time and resources to grow the data team and buy additional datasets.
The “big bang” strategy of hiring a very large number of people externally to create a centralized data team all at once requires a substantial immediate upfront budget cost. If the business does not see immediate benefits of such an approach, it might be difficult to justify spending such large amounts of money. A strategy of obtaining small wins from using alternative data and gradually expanding the team may be more appropriate and more easily endorsed by the business.
We must say that creating a data science/engineering team capable of harnessing alternative data signals can be both expensive and time consuming. A diverse talent pool, typically not found within existing functions, is required to find, analyze, model, and productionize alternative insights. Large firms can set this up at a cost that is far below the benefits they will draw from alternative data. By contrast, smaller firms could opt for signals created by data vendors/fintechs and/or use platforms where the big infrastructure costs are avoided. From this point of view, smaller firms must shop around to see which data vendor's offering matches their requirements and demand.
| ||
| Annual Salaries | ||
| Role | Entry Level Salary (USD k) | Approx Bonus |
| Data Analyst | 80–100 | 25% |
| Data Scientist | 80–100 | 40% |
| Data Scout | 70–90 | 15% |
| Data Engineer | 80–110 | 30% |
| Head of Data | 250–1000 | 100% |
Source: Based on data from alternativedata.org.
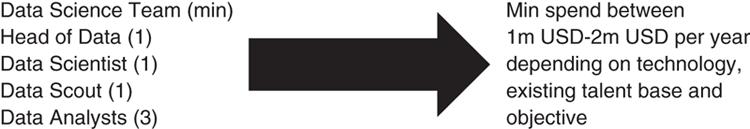
FIGURE 5.1 Cost of setting up a data science team.
We report in closing the approximate average spend to set up a data science team in an organization (see Figure 5.1). We note that the sums could vary between geographies and also the nature of the fund.
As we see, a spend of $1m–$2m can be a big ask for small or medium-size investor. We turn to discuss how the data vendor is responding to this and other challenges described in the previous steps.
5.4. DATA VENDORS
At the time of writing, the data vendor market remains fragmented; there are several hundred data vendors and thousands of datasets exist, and their number and variety continue to grow every month. The press often brands data as the new oil3 (Economist, 2017), and the supply chain that data moves bears a significant similarity to the oil industry (Passarella, 2019). We can explore this analogy to better understand the data industry. There are many parts of the “data” supply chain.
Initially, data resides in the “ground,” akin to crude oil; for example, this might be an actual corporate firm where the exhaust data was generated. Raw data providers, selling data with little to no preprocessing, populate the upstream portion of the supply chain. Here the burden of analysis is on the buyers' side, who must invest time and resources to make the data clean and usable. Buyers are likely to be other data companies themselves, who can ingest this dataset, or in some cases large quant hedge funds.
In the middle of the supply chain there are providers of processed data who clean and aggregate data from different sources to make it usable for a specific purpose such as equity markets signals, oil price movements, and so forth. An example dataset is the full geographical coverage of ship movements through aggregation and integration of data from different Automatic Identification System (AIS) systems.
Finally, at the end of the supply chain, there are providers of signals engineered specifically for the investment community, usually covering one or a few asset classes. This refinement process is similar to that performed by large chemical companies such as BASF in the oil refinery process. These providers often offer whitepapers to prove the existence of signals through specific case studies.
The data vendors' universe can also be segmented according to their offering, that is, the level of refinement of the data and the technological infrastructure used to deliver it. We can summarize this more explicitly as follows.
Most of the big data vendors provide Data-as-a-Service (DaaS) – minimally refined data supplied directly to customers. State of the art provides: (1) connected data, via a single point of access (SPV), and the ability to customize the data feed to a client's specific requirements, and (2) cleansed data with appropriate imputation and normalized data concepts and entities.
We also see a few cases of Infrastructure-as-a-Service (IaaS)/Platform-as-a-Service (PaaS) – flexible cloud infrastructure (and platforms) provisioned with simplified access to data. State of the art provides: (1) simplified access to data while improving usage monitoring, (2) co-located cloud infrastructure capable of supporting ultra-low-latency algorithmic decisions (and reducing communication infrastructure costs), and (3) access to cloud-based elastic/burst computing capabilities and a variety of price point storage solutions, presuming the co-location occurs in a cloud environment with sufficient scale. Given the complexities and costs, this option is typically reserved for the large data vendors such as Refinitiv.
We have not yet seen any data vendors fully capitalizing on the Analytics-as-a-Service (AaaS) space – where analytics data platforms hosted in IaaS/PaaS supply prebuilt environments at scale.4 State of the art of this potential offering provides: (1) simplified access to data processing, providing off-the-rack data platform solutions that can be readily accessed, (2) app store engagement model that fosters agile fintech ecosystem, and (3) utility-based pricing. A key consideration here is the degree to which custom-built analytics platforms represent a differentiator for the data consumer. In most cases these represent a cost without any discernible market edge and hence the requirement is better solved through engagement with industry utilities.
Finally, some data vendors (or small startups that acquire data from different vendors) generate signals5 that are sold to clients at a premium that target specific market segments and use cases.
The delivery model of a data vendor and the degree of transformation of the data must be driven by market research (and direct client outreach) and targeting appetite. We discussed in Section 5.2.1 that there are different types of data buyers that we ranked according to the level of sophistication. The question for the data vendor is what segments to target that will inform the most appropriate delivery model and the required investments.
5.5. SUMMARY
In this chapter, we discussed the general process for firms wishing to start using alternative data. The initial stages require a lot of organizational work and investment to get the right team hired. When it comes to selecting and evaluating datasets, as well as technical work to understand the value of a signal, a large amount of due diligence needs to be performed before any data is even ingested. This due diligence involves understanding how the data is produced. This also involves understanding the source of the raw data to assess whether it poses any legal and other risks. If the dataset passes these initial checks, and proves to be valuable in the backtesting (or another performance measurement) stage, it is then possible to move into production. However, the work does not stop there. It is also necessary to monitor the production process carefully and maintain the high quality of the model.
NOTES
- 1 The conviction is that processing data (e.g. removing outliers) can throw away precious information.
- 2 This, however, restricts the options because curated signals might not be offered by all data vendors.
- 3 However, unlike oil, data is a nondepletable and non-rivalrous asset. It is in principle nonperishable, although its value can decay in time.
- 4 Generic analytics vendors (e.g. SAS, Cloudera, Pivotal) provide these capabilities.
- 5 For example, Research Signals of IHS Markit.